DXY Potential UpsidesHey Traders, In the upcoming week, we are closely monitoring the DXY (U.S. Dollar Index) for a potential buying opportunity around the 102.600 zone. The DXY has been trading in a downtrend, but it recently broke out of this trend. However, it is currently in a correction phase, attempting to retrace for the second time before potentially continuing its upward movement.
From a fundamental perspective, there are signals indicating a potential upcoming couple of rate hikes from the Federal Reserve in their next monetary policy decisions. This information can have a significant impact on the DXY and related currency pairs.
I would recommend keeping a close eye on the DXY, not just prior to the new trading week, but also on a daily basis. This will help you trade USD pairs more professionally by identifying their direction. Additionally, monitoring the correlation between the DXY and the crypto market, as well as equities and indices, can provide valuable insights for trading decisions.
By staying informed about the DXY's movements, you can enhance your trading strategy and make more informed decisions regarding USD pairs and related markets.
Trade safe, Joe.
Monetarypolicy

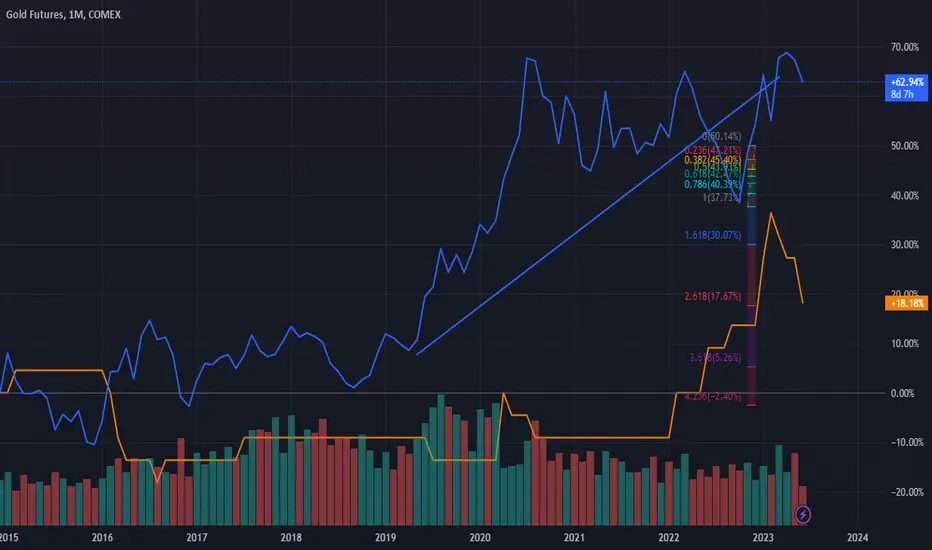
Gold:the monetary commodity’s fate in the hands of central banksGold is arguably the most sensitive commodity to monetary policy. The metal operates more like a pseudo-currency than a regular commodity (a regular commodity’s price is driven by the balance of supply and demand, gold is driven by many of the macro determinants of currencies).
After hiking rates every meeting since February 2022, the Federal Reserve (Fed) took a pause in June 2023. The central bank has lifted the upper bound of Fed Fund target rates from 0.25% to 5.25% over that timeframe, marking one of the most rapid rate hiking cycles in history. At times, the Fed was hiking in 0.75% clips. Rising interest rates were an extreme headwind for gold for most of this period. Can gold investors breathe a sigh of relief now? Is this a temporary pause, or a halt on rate hikes? Well, if Fed Fund futures are to believed, there may be one more rate hike by September 2023. If the participants of the Federal Open Market Committee (FOMC) are to be believed, there could be several more rate hikes (with the median expectation of these participants pointing to a terminal midpoint rate of 5.625%, that is, an upper bound of 5.75%). Professional economists1 seem less sure of such decisive action, with the median looking for no change in rates this year (and cuts commencing in Q1 2024). Senior Economist to WisdomTree, Jeremy Siegel, believes the Fed is done hiking and that alternative inflation metrics, which incorporate real time housing inputs, show inflation running at 1.4% instead of the official 4.1% in May 20232.
Market inflation expectations are not falling away as fast as we would expect. Judging by the 5yr5yr swaps, longer-term market inflation expectations are actually rising modestly. Higher inflation tends to be gold-price supportive (other things being equal).
After hitting an all-time high in 2022, central bank demand for gold has maintained strong momentum. Official sector gold buying in Q1 2023 was the largest on record for the first quarter (albeit lower than Q3 2022 and Q4 2022). A YouGov poll, sponsored by the World Gold Council3 , showed that developing market central banks are expecting to increase their gold reserve holdings and decrease their US dollar reserve holdings.
With a lack of forceful stimulus from the Chinese government, and still elevated gold prices in Renminbi terms, we expect a slowing of retail demand in China. In fact, Shanghai premiums over the London Bullion Market Association (LBMA) price slowed in May and remain low in June.
Looking to WisdomTree’s gold price model, we can see that bond headwinds have clearly fallen away and US dollar depreciation (relative to a year ago) is offering gold some support rather than dragging prices lower. However, investor sentiment towards the metal has moderated since March 2023, when the collapse of Silicon Valley Bank (SVB) and the shotgun marriage between UBS and Credit Suisse Banks was announced. With the passing of the US debt ceiling debacle, there aren’t any specific risks driving gold demand higher. However, general recession fears and the potential for unspecified financial sector hiccups are likely to keep gold demand moderately high as the metal serves well as a strategic asset in times of uncertainty.
Source:
1 Bloomberg Survey of Professional Economists, June 2023.
2 The alternative measure calculates shelter inflation using Case Shiller Housing and Zillow rent which annualise at 0.5% instead of the 8% that is biasing the Bureau of Labor Statistics CPI higher.
3 2023 Central Bank Gold Reserves Survey, May 2023.
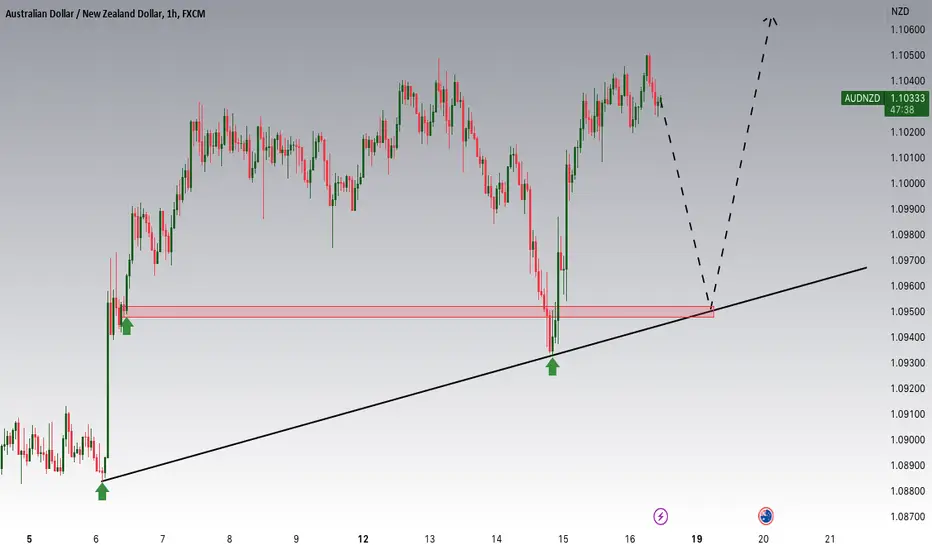
AUDNZD Potential UpsidesHey Traders, In today's trading session, we are paying close attention to the AUDNZD currency pair, as we believe there might be an opportunity to buy around the 1.09600 zone. From a technical standpoint, AUDNZD is currently in an uptrend but experiencing a corrective phase. It is approaching a significant support zone around 1.09600, which adds to its appeal as a potential buying opportunity.
From a fundamental perspective, it's worth noting that the Reserve Bank of Australia (RBA) is still in the process of gradually raising interest rates. This indicates their intention to tighten monetary policy in order to manage the economy. On the other hand, the Reserve Bank of New Zealand (RBNZ) has officially halted any further rate hikes, suggesting a more stable or potentially looser monetary policy approach.
Considering both the technical and fundamental factors, the current market conditions suggest that the AUDNZD pair could present an attractive buying opportunity near the 1.09600 support zone.
Trade safe, Joe.
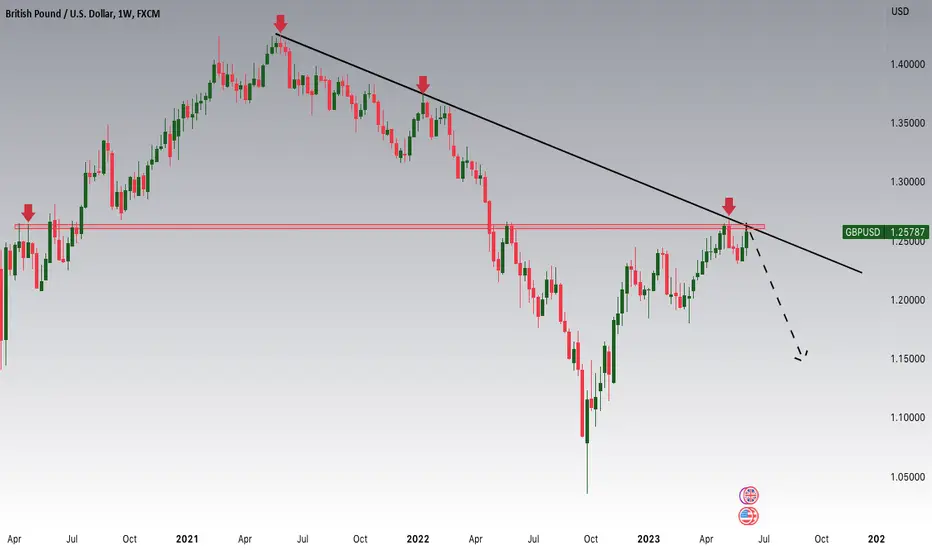
GBPUSD Approaching the weekly trend ahead of CPI data.Dear Traders,
I'd like to bring your attention to the current market conditions of GBPUSD. It is currently experiencing a downtrend but is undergoing a correction phase. The price is approaching a significant resistance zone at 1.26100, which coincides with the major trend. This area is worth monitoring closely.
In addition, it's crucial to take into account the upcoming Consumer Price Index (CPI) release this week. This economic indicator is expected to have a substantial impact on the strength of the US dollar and may provide insights into the future actions of Fed Chair Powell. If the CPI figures are higher than anticipated, it suggests that the Fed may need to continue raising interest rates, which could strengthen the dollar further. On the other hand, if the CPI falls below expectations, it is more likely that the Fed will postpone any rate hikes in their next monetary policy decision.
Remember to prioritize risk management and trade with caution.
Best regards,
Joe
Yen Step Back, Two Steps ForwardDespite sharp inflation, the Bank of Japan (BOJ) left YCC unchanged on March 10th. This was Haruhiko Kuroda’s last meeting as BOJ Governor. Japan is still struggling to stoke growth at risk of sustained stagflation. Hence, his decision to leave rates intact was no surprise.
Kuroda left the YCC unchanged. Analysts expected him to scrap the YCC so that the new incoming governor, Kazuo Ueda could start afresh. Hopes of change are now expected at the next BOJ policy meeting on April 27th.
Kuroda leaves behind a mixed legacy. His strong monetary stimulus lifted the Japanese economy out of deflation at the cost of hurting bank profits with ultra-low rates. Growth has remained tepid.
Kuroda has been a source of stability. More than what was needed in the staid land of the rising sun. Now, the monetary policy landscape is expected to shift as Ueda takes charge.
New BOJ leadership and an aggressive US Fed will create near term weakness in JPY followed by medium term strength.
This case study analyses a two staged positioning in CME Japanese Yen Futures to harness yield from anticipated currency moves.
Change of Guard at the BOJ
Under the new governor, definitive shifts are afoot. Inflation in Japan is non-negative. Really? Yes. Not only non-negative but also at levels unseen in 43 years.
Kuroda may not have radically transformed Japanese economy, but he managed to revive its equity market. The risk of uncertainty and volatility exists once he leaves the office.
Markets are used to perennial Japanese low inflation, and to a consistent central bank leadership. Both are now going or gone.
Another big shift is BOJ's more definitive independence. While separate from Government of Japan, BOJ was seen as being an integral part of Abenomics to snap out of deflation. The Kishida-Ueda relationship is different.
Prime Minister Kishida has not outlined a particular direction on macroeconomic policy. Politically, the LDP is far from united, not least on fiscal and monetary policies. Kishida’s base of support within the party is fragile, and his approval ratings have been in a prolonged slump.
As a BOJ governor, Ueda comes from an unconventional background. He is the first academic to assume leadership of BOJ. He has not managed a large organization. He is knowledgeable about monetary policy and is a protege of Stanley Fisher.
What, then, can we expect from Ueda? He is not convinced that inflation is sticky. Ueda maintains that “…inflation is led by cost-push factors” and “it will still take time to achieve sustainable inflation.” It does hint that he isn't someone who will make any sudden major moves.
That said, in a parliamentary hearing earlier this month, Ueda hinted that the current YCC was unlikely to survive. Engaging the market is essential he said before adding that “in some cases, adding a surprise factor is unavoidable.”
There is growing evidence emerging from the annual “shunto” (a big wage negotiation between unions and employers) that workers are asking for the largest raise in base pay in 25 years.
Some Japanese employers have already raised wages sharply higher with case in point being Fast Retailing (a Japanese listed firm and parent company of Uniqlo) which raised pay by 40% earlier this year.
Until now, it has been possible to attribute Japan’s inflation to the rise in the cost of imports driven by weak yen. Big wage increases would change that.
However, the latest data, published Tuesday, shows that wage growth is not rising as fast as expected. In cash terms, it reached the highest level in decades last year, but the January figure was far lower. Real wages adjusted for inflation have been falling the most since 2009.
Balancing growth while keeping inflation under control is not a small feat.
Next BOJ policy meeting is more than a month away. Meanwhile, the US Fed is becoming more hawkish in its fight against domestic inflation. Another rate hike by the US Fed will further weaken the fragile Yen.
The US macro environment is making an already complicated situation even more difficult. The failure of Silicon Valley Bank along with closure of Signature Bank and Silvergate Bank is testing the Fed’s wit. US Inflation continues to remain hot and three times the Fed’s target. With the liquidity backstop in place, the Fed is likely to jack up its rate by another 25 basis points when it meets on March 22nd. CME’s FedWatch tool pegs the likelihood of that happening at 82% as of March 14th.
Against that backdrop, Ueda could do one of the three once in office – (1) further widen the 10-year JGB interest rate band, (2) target shorter term yields & thereby reduce JGB holdings, and (3) abandon yield targeting altogether.
Options Markets are Bullish JPY/USD
Options on CME’s Japanese Yen futures have an overall Put/Call ratio of 0.56 across all expiries, indicating that investors are expecting the Yen to weaken.
In sharp contrast though, options for the July contract show a deviation from the trend with a Put/Call ratio of 2.6x. This coincides with the release of the 2nd Outlook Report by the BOJ after Ueda takes over, indicating the market expectation on Yen’s reversal versus USD starting July.
How much more JGB can BOJ keep buying to sustain YCC? Can this last?
Last December, the BOJ tweaked its YCC policy, to allow the 10-year Japanese Government Bonds (JGB) yield to move 50 basis points (bps) on either side of its 0% target, wider than the previous 25 bps band. The move stunned markets as BOJ hinted at monetary tightening after having stuck to its ultra-loose policy stance for a long time.
YCC tweak spilled over into January as BOJ was forced to purchase a record $182B of JGB to defend its higher yield cap from breaching the ceiling of 0.50%. The BOJ now holds more than 50% of JGB, making the situation ever more unsustainable. Adding to the JGB burden, BOJ also owns the majority of domestically listed exchange traded funds (ETFs).
Besides massive JGB purchases, the BOJ remodeled in January a funds-supply operation into a tool to prevent yields from rising rapidly.
Beyond the current short-term loans, the BOJ amended the rules to offer funds extending up to 10 years with variable rates. In January, BOJ provided loans of 3T Yen in the January offer before extending the terms of the loan to 10-year for subsequent loans. In February, BOJ tweaked the fund-supply policy terms, including the quadrupling of minimum lending fee from 0.25%-1%, to limit the short-selling of JGB’s, this indicates that the BOJ is having to use all tools at their disposal in order to defend JGB yields from rising above their defined cap.
The BOJ defended yet another attack on the YCC again in February prompting a further $2.2B of JGB purchases to keep yields from breaching the ceiling.
Economists anticipate that Ueda will fundamentally revisit YCC before BOJ lands in crisis.
Ueda starts on April 9th. It is unlikely that he will make any radical moves instantly.
Meanwhile, Fed Chair Powell is going all guns blazing to tame inflation down. Jobs data released last Friday showed the creation of 311,000 jobs smashing expectations of 225,000 jobs indicating a tight labor market. A strong labor market risks fueling a wage-inflation spiral, leaving the Fed with no choice but to jack up rates further.
Two Stage Trade Setup to Gain from Near Term Weakness & Medium-Term Strength
CME’s Japanese Yen Futures provides investors an exposure of 12.5 million Japanese Yen for every lot with the price quoted in USD per JPY increment. Every 0.0000005 change in JPY provides an increment of $6.25 in contract value.
With the USD expected to strengthen in the near-term, JPY will weaken until the next policy meeting on April 27th. As such a short position using CME Japanese Yen futures expiring in June (6JM2023) would provide a reward-to-risk ratio of 0.6x.
Stage 1
Entry: 0.0075390
Target Level: 0.0074550
Stop Level: 0.0076670
Profit at Target: $1,050
Loss at Stop: $1,725
Reward-to-Risk: 0.6x
Stage 2
Thereafter, if Ueda starts to steer Japan’s monetary policy stance differently, JPY will start to strengthen in the medium term.
Following from a short position in the near term, a subsequent long position in CME’s Japanese Yen futures will allow the investor to gain from the strengthening JPY.
Entry: 0.0074550
Target Level: 0.0081445
Stop Level: 0.0072775
Profit at Target: $8,620
Loss at Stop: $2,220
Reward-to-Risk: 3.88x
MARKET DATA
CME Real-time Market Data helps identify trading set-ups and express market views better. If you have futures in your trading portfolio, you can check out on CME Group data plans available that suit your trading needs tradingview.sweetlogin.com
DISCLAIMER
Trade ideas cited above are for illustration only, as an integral part of a case study to demonstrate the fundamental concepts in risk management under the market scenarios being discussed. They shall not be construed as investment recommendations or advice. Nor are they used to promote any specific products, or services.
This material has been published for general education and circulation only. It does not offer or solicit to buy or sell and does not address specific investment or risk management objectives, financial situation, or needs of any person.
Advice should be sought from a financial advisor regarding the suitability of any investment or risk management product before investing or adopting any investment or hedging strategies. Past performance is not indicative of future performance.
All examples used in this workshop are hypothetical and are used for explanation purposes only. Contents in this material is not investment advice and/or may or may not be the results of actual market experience.
Mint Finance does not endorse or shall not be liable for the content of information provided by third parties. Use of and/or reliance on such information is entirely at the reader’s own risk.
These materials are not intended for distribution to, or for use by or to be acted on by any person or entity located in any jurisdiction where such distribution, use or action would be contrary to applicable laws or regulations or would subject Mint Finance to any registration or licensing requirement.

Traders are waiting for the BoJ Monetary Policy on Friday!USD/JPY experienced a rally up to 135.13 last week but then retreated during the dollar softening. At the start of this week, the initial bias is neutral in the 4-hour chart since the market is waiting for the BoJ interest rate decision that will be released on Friday. Therefore, technically, a further rise is expected if the support level of 132.01 can be held. On the upside, if 135.13 is broken, the rebound will continue from 129.62 to the next resistance level of 135.73. Conversely, the support of 132.01 was broken; it may go further down to 131.61.

How to Build Wealth (Even During Monetary Tightening)One question that many investors are asking right now is: How can I build wealth during monetary tightening?
To answer this question, one must understand how the money supply works.
The Money Supply
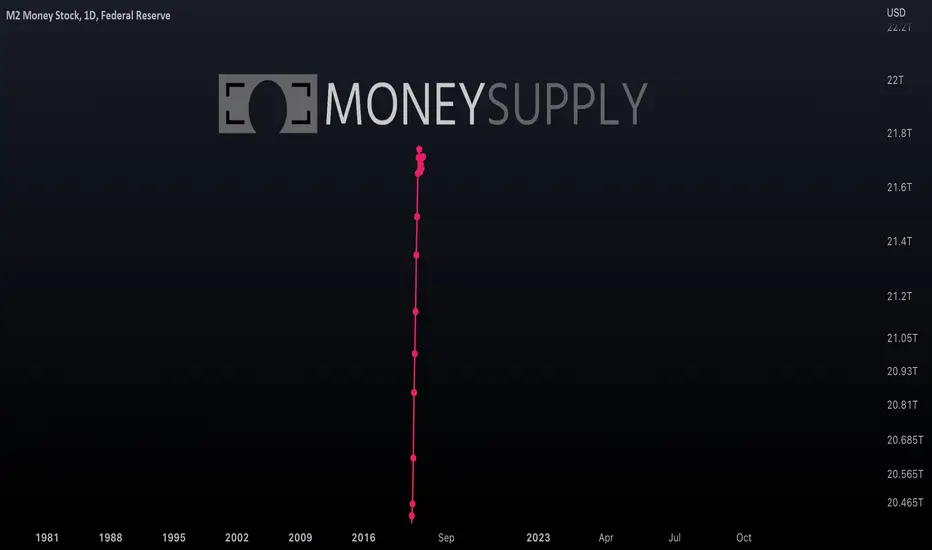
The money supply refers to the total amount of currency held by the public at a particular point in time. M2 is one of the most common measures of the U.S. money supply. It reflects the amount of money that is available to be invested. M2 includes currency held by the non-bank public, checkable deposits, travelers’ checks, savings deposits (including money market deposit accounts), small time deposits under $100,000, and shares in retail money market mutual funds.
The chart above is a time-compressed view of the money supply. The time scale has been compressed such that the money supply appears as a vertical line with clusters of dots. Each dot represents a quarter (or 3-month period).
During periods of monetary easing, when the central bank accelerates increases in the money supply, the dots stretch wider apart, as shown below.
During periods of monetary tightening, when the central bank decelerates increases in the money supply, the dots tighten together. In rare cases, the central bank can reduce the money supply to fight inflation, in which case the dots can retrograde.
The central bank rarely reduces the money supply because it usually results in economic decline.
The Money Supply and The Stock Market
Since the money supply reflects the amount of money that can be invested in the stock market, the stock market tends to track the money supply. As the money supply (M2SL) grows so too does the stock market (SPX).
The chart above shows that despite the stock market’s oscillations, over the long term, the growth rate of the stock market tends to track the growth rate of the money supply. The stock market goes up, in large part, because the money supply goes up.
The chart below is from the book Stocks for the Long Run by Jeremy Siegel, Professor of Finance at the Wharton School. The chart shows that compared to other asset classes, stocks generally perform the best over time.
Stocks generally perform the best over time because the growth rate of the stock market generally tracks the growth rate of the money supply fairly well. Investing in the stock market is therefore an efficient means of preserving wealth over the long term.
One will always be better off investing in assets that grow in price at a faster rate than the rate at which the money supply grows than investing in assets that do not. When the money supply decreases during periods of monetary tightening, as is happening right now, only assets that outperform the money supply can produce positive returns.
Knowing these facts, we can reach the following conclusion: Generally, investing in the stock market does not intrinsically build wealth, it merely efficiently preserves wealth over time against the perpetual erosion of an ever-increasing money supply. To build wealth one must invest in assets that grow in price faster than the rate at which the money supply grows .
Preserving Wealth vs. Building Wealth
As noted, to build wealth one must invest in assets that move up in price faster than the rate at which the money supply moves up.
Investing in assets that move up in price over time, but at a rate less than that which the money supply moves up over time may seem like a good investment to an investor if the investor is making money, but such investments are not typically wealth-building. These investments are merely some degree of wealth-preserving.
When the price of an investment increases over time at a rate less than the money supply, that investment causes a loss of wealth, despite giving the investor the perception of increased wealth. A loss of wealth occurs because the investor’s purchasing power is decreasing over the period of time which the investment is held.
Purchasing power is the value of a currency expressed in terms of the number of goods or services that one unit of money can buy. It can weaken over time due to inflation. To keep things simple, let’s assume that other elements of inflation, such as money velocity, remain fairly constant and that an increasing money supply is the main cause of inflation.
Let’s consider some case studies.
Case Study #1: REITs
Suppose an investor, John, invests his money in real estate investment trusts (REITs), specifically BRT Apartments Corp.
John is a smart investor and does research before investing. In his research, he sees that BRT has decent profitability and a fair valuation. He also sees that BRT has decent growth potential.
After analyzing fundamentals, John does technical analysis. He sees the below chart which shows a decades-long bull run.
(Chart has been adjusted to include dividends)
He thinks to himself: This asset is a money maker. Despite periods of corrections, price generally goes up over time.
John then buys shares of BRT as part of a long-term investment strategy. John has done his due diligence and indeed he is right that, over the long term, his investment is likely to make quite a bit of money.
However, if John invests in this asset, although he will make money, he will lose wealth or purchasing power. That’s because the Federal Reserve is increasing the money supply at a rate that is faster than John’s investment grows.
Here’s a chart of BRT adjusted for the money supply (and adjusted to include dividends).
Adjusting the price of BRT by the money supply shows a clear downtrend over time. This means that while BRT is growing in price and its investors are making money, BRT’s investors are generally losing purchasing power over time by investing in this asset because the central bank is increasing the money supply at a faster rate than the rate at which BRT's price grows.
By increasing the money supply exponentially over time, central banks trick people into believing that they are building wealth by investing when in fact most investments are, at best, some degree of wealth preserving. Only a minority of assets outperform the money supply, and usually, that outperformance is temporary.
In the era of monetary easing, during which central banks drastically increased the money supply using various monetary tools, perceived wealth skyrocketed. However, actual gains in purchasing power or improvement in living standards, as measured by increased productivity, largely did not occur.
You may be thinking that I simply chose a bad investment to demonstrate my point. While BRT is actually a great investment relative to most other assets, let's move on to the second case study: an asset that has skyrocketed in price in recent years.
You will find that even for assets that have outperformed the growth in the money supply, the period of outperformance is usually temporary.
Case Study #2: Microsoft (MSFT)
Microsoft is an example of a stock that has outperformed the growth rate of the money supply in recent years. Below is a chart of MSFT adjusted for the money supply.
The chart shows that although the growth in MSFT's price generally outperforms the growth rate of the money supply, it undergoes prolonged periods of underperformance when investors can lose wealth. This wealth loss effect cannot be fully ascertained by looking only at a chart of just MSFT's price. It only becomes fully apparent when one compares the stock's price to the money supply.
Tech stocks have generally outperformed the money supply since the Great Recession. They were excellent wealth-building investments. However, now that the central bank has begun monetary tightening, interest-rate-sensitive tech stocks are especially likely to decline. Investing in these assets while the money supply is decreasing, and while interest rates are surging, may result in loss of wealth.
Case Study #3: Utilities (XLU)
The chart below shows how well the utilities sector performed over the past two decades.
Let’s adjust the chart to the money supply. (See chart below)
You can see that XLU moved horizontally relative to the money supply, meaning that it merely preserves wealth to varying degrees but does not generally build wealth over the long term.
By including the money supply in our charts, we remove the confoundment of monetary policy and elucidate the true intrinsic growth potential of assets.
Case study #4: ARK Innovation ETF (ARKK)
Look at the chart below which shows ARK Innovation ETF (ARKK), managed by Cathie Wood, relative to the money supply.
Cathie Wood’s investment choices have actually caused a loss of wealth since the fund’s inception in 2014. You can see in the above chart that price is slightly below the center zero line, which means that wealth has been lost by those who invested in ARKK in 2014 and held continuously to the current time.
Finally, check out the below chart of SPY relative to the money supply. The entire post-Great Recession bull run in SPY was merely a recovery of the wealth lost since the Dotcom Bust, over 2 decades ago. The stock market is ominously again being resisted at this peak level.
The below chart shows that the stock market has given back much of the wealth built since the pre-Great Recession peak.
In summary, wealth-building requires investing in assets with a growth rate that is greater than the growth rate of the money supply. To accomplish this, an investor should compare an asset against the money supply before choosing to invest. Assets that continuously outperform the money supply over the long term are better investments than those that do not. One can use standard technical analysis on the ratio chart to determine candidates that are most likely to outperform the money supply.
In the face of high inflation, central banks must reduce the money supply. A decreasing money supply pulls the rug out from under the stock market. When the money supply is falling, corporate earnings and the stock market typically fall as well.
Inflation
When the COVID-19 pandemic hit, the Federal Reserve and central banks around the world increased the money supply by an unprecedented amount.
Throughout the course of its entire history up until the pandemic, the U.S. money supply moved up predictably within a log-linear regression channel, as shown in the chart below. Before the pandemic, the log-linear regression channel had an exceptionally high Pearson correlation coefficient (over 0.99), which suggests that the regression channel was reliably containing the money supply’s oscillations over time.
When the pandemic hit the global economy came to a halt. The Federal Reserve increased the money supply by a magnitude that was so astronomical that it went up vertically even when logarithmically adjusted. (See the chart below)
As a thought experiment, let’s assume that the log-linear regression channel above is valid and that data are normally distributed (typically they are not in financial markets).
If it were the case that such a sudden, astronomical increase in the money supply occurred totally randomly, the event would be a 10-sigma event (meaning 10 standard deviations away from the mean). The chance of such a rare event happening totally randomly is so small that it would occur about once every 500,000 quadrillion years. Since this is much longer than the age of the known universe, a 10-sigma event is essentially equivalent to an event that will statistically never happen. Thus, no one was prepared for the action that the Federal Reserve took.
By exploding the money supply by this extreme amount and flooding the market with so much newly created money, central banks instantly made everyone feel wealthier by giving them more money, but this action would eventually make everyone less wealthy by destroying their purchasing power as inflation ensued.
Once high inflation begins, it can be hard to stop. When inflation stays high for too long the public begins to expect more of it. The public then alters its spending and saving habits. The public also begins to demand higher wages to keep up with high inflation. This creates a negative feedback loop: When workers receive higher wages to keep up with inflation, workers can afford to pay inflated prices which keeps inflation higher for longer. As workers get paid more, keeping demand high, companies also charge more for their goods and services. Eventually, workers again demand higher wages to keep up with yet even higher prices.
At every stage of inflation, the best strategy for central banks is to downplay its true severity. This is because the easiest way to control inflation is by managing the public’s perception of it. The hard way to control inflation is to raise the cost of money – interest rates – which in turn induces economic decline, and which can cause financial crises as highly indebted consumers, companies and governments cannot afford higher interest payments.
Bonds
Government bond yields reached a record low during the COVID-19 pandemic.
The chart below shows that interest rates – or the price of money – reached their lowest level in the nearly 5,000 years for which records exist.
Since the start of 2022, interest rates have surged higher, breaking a multi-decade downtrend, and ushering the market into a new super cycle where interest rates will likely remain higher for the long term.
Interest rates and the money supply are inextricably linked. Few people know why an inverted yield curve predicts a recession. An inverted yield curve reflects the destruction of money. When the yield curve is inverted, banks can no longer profitably borrow at short term rates and lend at long term rates. Bank lending creates the most amount of money. An inverted yield curve is a market perversion that does not occur naturally but occurs only through central bank action. Inverting the yield curve is a highly obfuscated tool that central banks use to decrease the money supply. Furthermore, as we discussed before, since the stock market generally tracks the money supply, an inverted yield curve is a warning that the stock market will fall in the future. Recently, the yield curve (as measured by the 10-year minus the 2-year U.S. treasury bonds) inverted by the most on record.
Below is the chart of iShares 20+ Year Treasury Bond ETF (TLT). TLT tracks an index composed of U.S. Treasury bonds with remaining maturities greater than twenty years.
As you can see from the chart above, which excludes the past two years, it looks like TLT has been a great investment over the past two decades. (For this chart, I included dividends. TLT pays out dividends that derive from interest payments on its bond holdings.)
Look at the chart below to see what happens when we adjust the chart for the money supply.
In the chart above we see that since its inception TLT moved horizontally relative to the money supply. What this means is that holding TLT over this period was not wealth-building, but it was good at preserving wealth. Its price moved up in perfect lockstep with the money supply.
Now, let’s see how TLT performed in the past two years.
As we see in the chart above, until 2021, an investor who held long-term U.S. government bonds would have been preserving their wealth and shielding it from the erosion of perpetual increases in money supply. However, as interest rates on government debt surged higher as central banks fight high inflation, bond investors are now seeing major wealth destruction. In a stable monetary system, investing in government bonds should preserve wealth, since if it fails to do so, no one will buy bonds to finance the government.
The situation is also concerning when we examine investment-grade corporate bonds (LQD) relative to the money supply.
This chart of investment-grade corporate bonds adjusted for the money supply shows that we should be concerned about the current state of even the most high-grade corporate bonds. We see that the value of investment-grade corporate bonds over time, inclusive of their interest payments, has fallen off a cliff relative to the rate at which the money supply is increasing. This chart suggests that those who invested in corporate bonds have recently lost a lot of wealth. Until the current trend reverses, who would want to invest in corporate bonds? This is a problem for corporate finance.
Below is a chart of high-yield corporate bonds (HYG), (which are riskier than investment-grade corporate bonds), as compared to the money supply.
You can see from the chart above that all the wealth built by investing in high-yield corporate bonds since the Great Recession has been completely wiped out.
What I am about to explain next will be somewhat dense. Look again at the two charts below which show investment-grade corporate bonds relative to the money supply and high-yield corporate bonds relative to the money supply.
Recall that bond prices move inversely to bond yields. Thus, if we flip these charts of corporate bond prices, we will get corporate bond yields relative to the money supply.
Now let’s think. These charts show that the yields on corporate bonds are moving up faster than the supply of money. Corporate bond yields reflect the amount of money that corporations must pay on their debt. In other words, the amount of money that corporations will have to pay to service their debt is moving up faster than the money supply. As noted previously, the money supply speaks to corporate earnings since corporations can only ever earn some subset of the total supply of money in the economy. Thus, if the money supply decreases, as it is now, corporate earnings will likely decrease as well. If the interest on corporate debt is moving up much faster than the money supply, and the money supply which reflects corporate earning capacity is decreasing, what might this say about the future?
Mortgages
In the chart below, I analyzed the current median single-family home price in the United States adjusted by the current average 30-year fixed-rate mortgage (as a percentage). I then compared this number to the money supply.
This chart gives us a sense of whether or not the Federal Reserve is supplying enough money to the economy to support the current expense of home ownership. As you can see, price is rapidly approaching the upper channel line (2 standard deviations above the mean), which signals that home ownership is the least affordable it has been since the early 1980s – the last time the upper channel line was reached.
If one believes that the 2 standard deviation level is restrictive, then one may conclude that there is not enough money being supplied by the Federal Reserve to sustain such high home prices as coupled with such high mortgage rates. If the Federal Reserve does not pivot back to a less tight monetary policy soon, then there is a high probability that a housing recession will occur in the coming years.
Perhaps what is more alarming is the below chart, which shows the EMA ribbon. The EMA ribbon is a collection of exponential moving averages that tend to act as support or resistance over time. When the ribbon is decisively pierced it reflects a trend change.
We can see in the above chart, that for the first time since the mid-1980s, we have pierced through the EMA ribbon. This could be a signal that a new super cycle has begun, whereby a higher interest rate environment will persist alongside high inflation for the long term, potentially making homes less affordable for the long term. This is one of many charts that seem to validate the conclusion that inflation will remain persistently high for the long term.
Commodities
In the below chart, the price of commodities is measured as a ratio to the money supply.
This chart informs us that commodity prices have broken their long-term downward trend relative to the money supply.
The chart above shows commodities as a ratio to the money supply side-by-side an inverted chart of the S&P 500 as a ratio to the money supply. It appears that the ratio of commodities to the money supply reflects an inverse relationship to the S&P 500 and the money supply. Think about what these charts may be indicating. Could they suggest that in the face of a shrinking money supply, more money will flow out of the stock market into increasingly scarce commodities? In a deglobalizing world facing conflict, climate change, and declining growth in productivity, it’s unlikely that commodity prices will return to the extremely undervalued levels seen in 2020.
One commodity, in particular, deserves its own discussion: Gold.
Gold
During a monetary crisis, the usual winner is physical gold.
Since the dawn of human civilization, gold has played an important role in the monetary system. As a scarce commodity gold is often perceived as inherently valuable.
In his 1912 book, The Theory of Money and Credit, Ludwig von Mises theorized that the value of money can be traced back ("regressed") to its value as a commodity. This has come to be known as the Regression Theorem.
Once paper money was introduced, currencies still maintained an explicit link to gold (the paper being exchangeable for gold on demand). However, the U.S. abandoned the gold standard in 1971 to curb inflation and prevent foreign nations from overburdening the system by redeeming their dollars for gold.
Currently, gold is extremely undervalued when priced in U.S. dollars. The current fair dollar-to-gold ratio is currently about $7,200 per ounce of gold. This number is produced by dividing the year-to-year increases in the money supply by the yearly production of gold in ounces.
Eventually, a monetary crisis will occur, and according to Exter’s Pyramid, investors will scramble for gold, which may force fiat currency to regress back to a gold standard to stabilize markets.
Bitcoin
In this final part, I will give a few thoughts on Bitcoin, as it relates to the money supply.
Below, you will see that when charted as a ratio to the money supply, Bitcoin formed a nearly perfect double top in 2021.
This chart could have warned traders that Bitcoin had topped in November 2021 given Bitcoin's inability to achieve a new high relative to the money supply. This shows that one can use the money supply in their charting as an additional layer of technical analysis.
In the below chart, we see how Bitcoin's market cap is moving relative to the U.S. money supply.
Bitcoin’s yearly chart is a bull flag relative to the money supply. There are very few assets outside of the cryptocurrency class that present as a bull flag relative to the money supply on their yearly chart. What might this chart reveal about Bitcoin's tendency to disrupt central banks' ability to conduct monetary policy?
The Federal Reserve’s inability to stop people from converting dollars into Bitcoin to store wealth is a problem that will likely result in Bitcoin and other forms of decentralized finance coming under the greater scrutiny of the U.S. federal government. In the future, I plan to write a post on investing in cryptocurrency. In that post, I will explore Bitcoin and blockchain technology in much greater depth.
Final thoughts
To build wealth one must invest in assets that grow in price faster than the money supply erodes purchasing power. To become a successful investor, one must revolutionize one’s perception of money and understand that cash – or central bank notes – are worth nothing more than the belief that the government will persist and remain solvent. To build wealth an investor’s goal should not be to make as much cash as possible, rather an investor’s goal should be to convert cash into assets that grow faster than the money supply and to accumulate as much of such assets as possible.
Rethinking Fed Intervention: Wages, Inflation, and AIIn light of the precarious global economy and numerous contributing factors, such as deglobalization, the inflationary impact of the war in Ukraine, an aging population, and an overwhelming amount of debt, the Federal Reserve's role and efficacy in the current economic climate have come into question. Drawing on Jeff Snider's work, it is increasingly evident that the Federal Reserve has not completely controlled the financial system. Despite their efforts to manipulate interest rates, external factors and market forces continuously challenge the Fed's authority. The market's current outlook suggests that the Fed may be forced to cut rates soon, indicating that its strategy of hiking rates may not have been the best approach.
The central premise that the Fed should intervene to suppress inflation by keeping wages low is fundamentally flawed. Higher wages can lead to increased productivity investments, reducing the need for labor and raising living standards over time. However, hiking interest rates can stifle investment, hindering economic growth and exacerbating inequality.
In recent months, inflation has decreased independently, without the direct influence of the Fed's actions, suggesting that the economy may be self-correcting. However, this natural deflationary pressure could be disrupted by external factors, such as the tightening of lending standards brought on by the mini-banking crisis. The ongoing threat of AI-driven job losses and an impending recession further complicates the situation for American workers.
Jeff Snider's research at Eurodollar University offers valuable insights into the complex relationship between the Fed and inflation. Snider argues that the Fed's actions may not be the primary cause of inflation, as it has limited control over the money supply. Instead, he posits that the global financial system, specifically the eurodollar market, plays a more significant role in influencing inflation rates.
As we progress into the exponential age, the rapid advancement of technology and artificial intelligence (AI) will lead to significant disruptions. However, there are potentially positive aspects to these developments. AI could revolutionize industries, streamline processes, and create new opportunities. The widespread adoption of AI can lead to increased efficiency, improved decision-making, and the automation of repetitive tasks, ultimately driving economic growth. The productivity gains associated with AI could offset some of the negative impacts of the current economic climate, such as job losses and wage stagnation.
In summary, the belief that the Fed should intervene to suppress wages to tackle inflation is fundamentally misguided. Such intervention can have numerous negative consequences, including hindering investment and stifling economic growth. In contrast, allowing wages to rise can lead to increased productivity investments and improved living standards. To effectively address inflation, it is essential to consider a more comprehensive range of factors beyond the Fed's actions and recognize the importance of encouraging sustainable economic growth through policies promoting higher wages and productivity investments. Policymakers and financial analysts must carefully consider the consequences of their actions and their impact on the broader economy and society.
Thanks to Michael Green, aka @profplum99, for inspiring me to write this analysis :) twitter.com

THE MOST USEFUL TRADING SITES ...and how to utilize themIn this post, I will share the some of the most useful trading sites that are available to you and how you are able to utilize them to your advantage whether it's for fundamentals, charting, analysis, performance tracking, news events or just to follow your favorite professionals and their ideas & education that they share publicly.
First and foremost, if you haven't made this your PRIMARY trading platform, I want to encourage you to use and SUBSCRIBE to TRADINGVIEW
As we all evolve as traders, I'm sure we can all relate to one thing in common which is hard work and dedication. Trading is one of the hardest professions out there and without hard work, practice and dedication, we know that 90% of traders fail to make it in this industry. TRADINGVIEW gives you all the resources you need to be able to become one of the 10% as it enables you to become a content creator, it gives you a community to research ideas, you're able to watch livestreams, catch news flows, back test & analyze your own strategies and most importantly of all, you have direct support team to help guide you by sharing their own personal trading experiences, publicly as well as privately. Whether your choice of market is Forex, Stocks, Crypto, Bonds, Futures, Commodities or Yields, TRADINGVIEW has all the tools to be able get you well on your journey to become a professional trader.
See Figure 1: Subscriptions
WWW.MYFXBOOK.COM
MYFXBOOK has a variety of different tools to use ranging anywhere from position size calculators, COT data (Commitment of traders), Broker spreads/quotes/volumes, news flows, correlations and most importantly, account linked performance analysis. You may be a full time trader or a part time trader with a 9-5 job, either way analyzing your entries, exits, RR ratio, drawdowns etc. are necessary to find what works and what doesn't. Trading is about probabilities and if you're not making money in 25 trades, you need to reanalyze and change your approach. Myfxbook.com allows you to link your trading platform to breakdown your performance, ultimately being your own coach to find the approach that suits you the best.
See Figure 2: Performance Stats
WWW.TRADINGECONOMICS.COM
As many different crises happen throughout the world (especially the most recent ones within the last few years), understanding how the Federal Reserve operates to manage monetary policy is key to get an edge in your positions in the forex market. TRADINGECONOMICS gives you all the accurate information needed to be able to forecast and research throughout 196 countries like, economic indicators, exchange rates, stock market indexes, government bond yields and commodity prices. Micro and Macro economics are a big part of how this world operates and having access to all the most important information that drives the Feds decisions due to the economy being split between these two realms are valuable as they could be bridged together for more accurate forecasting.
See Figure 3: Inflation Rates/GDP Growth (By Country)
WWW.FOREXLIVE.COM
FOREXLIVE has many different helpful resources to keep you up to date in the market no matter what time zone or trading session you take part in. As our lives are busy with family, day jobs, business endeavors or simply being in different time zones, you may not be able to watch all sessions play out and in fact, taking a break from the screen is healthy for your mind and emotions. The great thing about FOREXLIVE is that you are able to read Session Wraps to keep you up to date with a summary after each session (Asian, European, U.S) completes. Psychology is a big part of why a trader either succeeds or fails which balancing your time on and off the markets are important to detach your emotions from your positions. Set a plan for how many times you will scan the charts a day and fill that in between time with activities like exercising, reading, chores, spending time with your family, going for a walk and much more.
See Figure 4: Session Wraps
WWW.INVESTOPEDIA.COM
INVESTOPEDIA was founded in 1999 headquartered in the heart of New York city U.S. This website provides comparisons of financial products, reviews, ratings, comparisons of different financial products and most importantly, it is a financial dictionary. With the broad range of information provided, it gives readers the confidence to manage every aspect of their financial life. Whether you're learning about money and investing for the first time or are looking to improve your knowledge and skills, anyone from an experienced investor, a business owner, a professional, an advisor, INVESTOPEDIA has all the information to build your skills.
See Figure 5: 4 Basic Things to Know About Bonds/Key Takeaways
WWW.INVESTING.COM
INVESTING.COM is a well known site that offers real-time market quotes, information about stocks, futures, options, analysis, commodities and most importantly an economic calendar. Keeping an eye out for the high impact news events will help you adapt and control the volatility during those peak hours. Another helpful aspect of this site is knowing what will drive the market mood for each upcoming week. The top 5 most important fundamental areas to watch for are explained and broken down to help your forecast and analysis so you can prepare your trade setups accordingly. Applying fundamental analysis along with technical analysis will help you become a better trader as when the high impact news events hit, markets get volatile which could cause a running profit turn into an absolute loss. Knowing when to be in or out of the market is valuable so you don't go into a draw down phase.
See Figure 6: Economic Calendar
As I only have mentioned a small number of sites that you are able to access, we all know there are so many other ones available out there, paid and free.
Researching and spending the time to read to broaden your knowledge in the financial world will only help you grow as a trader and essentially improve your trading results.
Check out some more free sites:
www.fxstreet.com
www.dailyfx.com
www.forexfactory.com
www.babypips.com
Please share the site that most helps you in by leaving it in the comment section. I would love to see the variety of ones available.
** If you felt this was helpful in anyway, please support by hitting the LIKE button and FOLLOW me for more educational and analysis ideas **
I appreciate all the feedback!
Thanks
Trade Safe

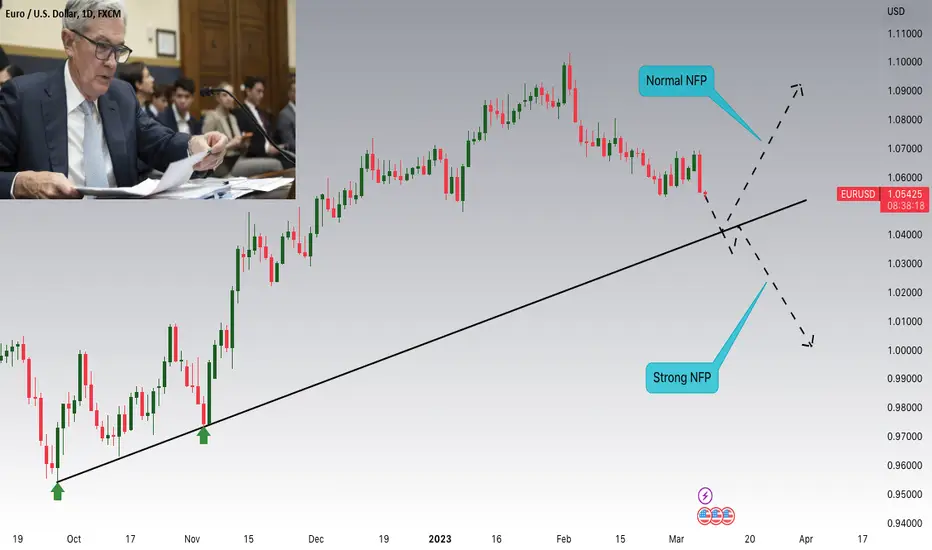
EURUSD:Couple of Scenarios depending on Friday's NFPHey Traders, above is a technical overview on EURUSD and the most important zones to watch, Fed yesterday have threw some hawkish comments "rates are likely to be higher than previously anticipated", but before the next FOMC we have a couple of events to consider. First of all NFP and next week CPI data.
If NFP comes again above expectations that will signal more rate hikes from the fed and thus more USD strength and EURUSD downsides. If the numbers are normal that will not be enough for fed to hike rates massively. and for CPI it's the same story. Numbers above expectations will lead to a more restrictive monetary policy and normal number will slow down the pace.
Feel free to ask any questions in the comment section.
Trade safe, Joe.
Gold Update - Read notesGold is expected to continue bullish trend on London session open due to bad PMI data.
Bad PMI data is indicating reduced demand and reduced manufacturing outcome.
Investors take it as an economical indicator leading to recessionary period.
I am expecting the trend to continue until Powell speaks on Wednesday and give us direction where the monetary policy will be leading to in 2023.
I am also expecting high inflation readings on Friday report after a spending spree during holiday season and it will be reflected in this month's inflation report.
High inflation will leave the Feds with no choice other than continue raising interest rates, and the decision will be enough catalyst to change the trend to Bearish.
Stay tuned for updates.

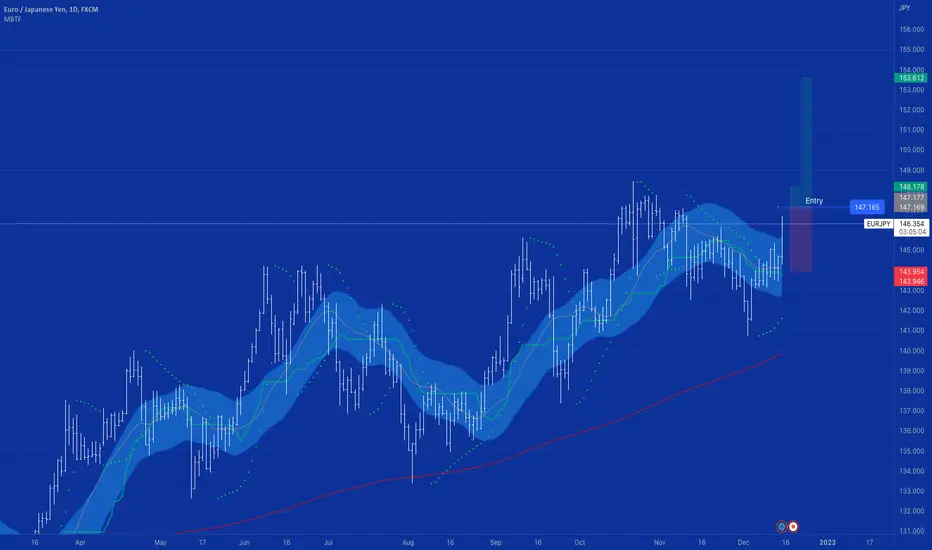
EURJPY long End of Day trend follower (EOD)Here is what the fundamentals are following the ECB rate decision today, words from ©Lloyds Bank
European Central Bank (Dec): We're not pivoting
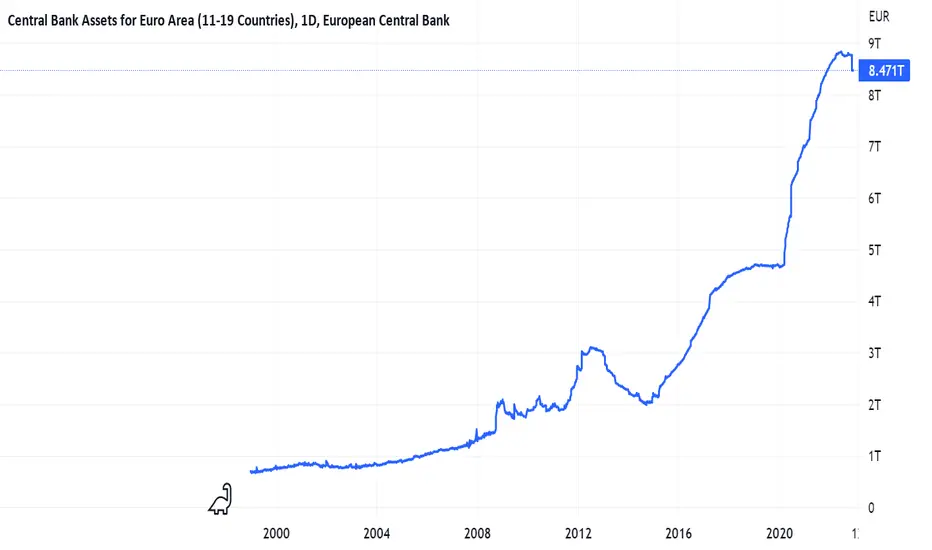
The European Central Bank (ECB) raised interest rates today by 50bps, in line with expectations. It follows 75bp hikes in the last two meetings in September and October, and a 50bp rise in July. There was broad agreement (not unanimity) on the decision and it brings the deposit rate up to 2%. There were similar increases in the main refinancing rate and the marginal lending rate to 2.5% and 2.75%, respectively. Policy rates have been raised by a total of 250bp since July (Chart 1).
Although the hiking pace was reduced today, the ECB warned that interest rates will “still have to rise significantly” and that they will be kept at “restrictive levels” to dampen demand and guard against second-round effects on inflation. President Christine Lagarde indicated that more 50bp rises could occur early next year (the next update is on 2 February). She said, “we’re not pivoting” and that the ECB is “in for a long game” and there is more ground to cover.
Current inflation was described as “far too high” (Chart 4) and forecast to stay above target for what is seen as “too long”. The ECB’s new quarterly economic projections upgraded inflation for 2023 to 6.3% (from 5.5%) and for 2024 to 3.4% (from 2.3%). The first forecast for 2025 is 2.3%, still above the 2% target (Chart 2). The ECB envisages a “short and shallow” recession – while next year’s GDP growth was revised down to 0.5%, it remains above the consensus forecast (Chart 3).
Detail on the start of quantitative tightening (QT) – the reversal of QE – was also provided today. The ECB said that from March it will no longer reinvest fully the proceeds from maturing assets held in its Asset Purchase Programme (APP) portfolio. From March until the end of Q2 next year, the average decline will be €15bn a month, meaning that about half of estimated redemptions wil be reinvested (Chart 7). This degree of detail could also be interpreted as hawkish, because it reinforces the impetus to reduce the ECB’s balance sheet (Chart 6).
Overall, while today’s interest rate decision was expected, the messaging was nevertheless surprisingly hawkish. There seems to be increasing disquiet about persistent upside surprises to inflation and the extended period in which it is expected to remain above target, while the economic downturn is now perceived as potentially less severe than previously feared. The market reaction saw the euro rise above $1.07 for the first time since June, while the pound fell below €1.15. Markets now expect the ECB ro raise interest rates above 3% next year.
Hann-Ju Ho
Senior Economist
That may be the fundamental reason and may be I am a little early in my trade idea as today's candle hasn't closed.I am assuming that we don't make a new higher high before the end of the NYC session.
European Central Bank Preview – Time to PivotDespite facing the unknown external shock of a war, the Eurozone economy’s growth has been resilient in the first three quarters of the year. Eurozone Gross Domestic Product (GDP) rose by 0.3% quarter-on-quarter (QoQ) in Q3, easing from a 0.8% increase in Q2 2022 aided by the rise in government spending alongside an improvement in inflation adjusted trade surplus . However, this is likely to change in Q4 2022 and Q1 2023 as COVID reopening demand fades.
Eurozone recession remains a key risk until Q1 2023
Europe is set to embark on a harsh winter, and with savings rates extending the decline from a 1.7% drop in Q2, consumer spending is likely to come under pressure. The 1.8% month on month falls in euro area retail sales in October is consistent with the notion that real income squeeze is now catching up the with consumers. Services spending rose only 1.5% in Q3 compared to the 3.1% jump in Q2 2022 . The labour market has remained fairly resilient as Eurozone unemployment hit a new low of 6.5% in October, pushed down by falling unemployment in Southern Europe, the Netherlands, Finland and Austria. However, unemployment is likely to rise as the economic slowdown and tightening financial conditions impact hiring. That being said, fiscal policy could come to the rescue as major Eurozone governments have earmarked €573Bn into the economy to shield the private sector from the upcoming fallout in economic activity.
Inflation in the Eurozone declined more than expected from 10.6% in October to 10% in November. Yet it’s hard to say for certain that the inflation rate has passed its peak as it is largely dependent on the fluctuations in energy prices. Core inflation remained at 5% in November and is likely to remain close to 5% through Q1 2023 . Companies continue to transfer higher input costs to consumers and in spite of an approaching recession, we expect this process of cost-push inflation to extend into 2023, keeping price pressures higher for longer.
European Central Bank (ECB) split between the doves and hawks
Ms Isabel Schnabel (a member of the executive board of the ECB) warned in November that loose fiscal policy risks adding to underlying inflation pressures by boosting consumption and reducing the incentive for consumers and businesses to save energy. We would argue that while the volume of relief packages is large, they are insufficient to provide complete relief for all consumers and companies. Ms Schnabel also noted that, “that the room for slowing down the pace of interest rate adjustments remains limited, even as we are approaching estimates of the ‘neutral rate’”.
This hawkish sentiment was echoed by Dutch central bank head Klaas Knot in his statement that risks are tilted towards the ECB doing too little to combat rising inflation, noting that an economic slowdown, or perhaps even a recession, is needed to bring inflation under control. President Lagarde stressed that she would be surprised if inflation has already peaked, as there is too much uncertainty regarding the pass-through of high energy costs at the wholesale level into the retail level. She added that the ECB may have to go into restrictive territory with key rates. On the other hand, the head of the French central bank, Villeroy, who has often anticipated the actual ECB decisions in his statements, spoke out in favour of 50 basis points. Even hawks such as Bundesbank President Nagel and Estonian Mueller seem to be able to come to terms with a hike of just 50 basis points.
Further clarity on Quantitative Tightening (QT)
The ECB is likely to meet consensus expectations this week of narrowing the pace of rate hikes to 50Bps on 15 December, following two 75Bps rate hikes in September and October. This decision will lift its deposit and refinancing rates to 2% and 2.5% respectively. Neither peaking inflation nor a recession will give the ECB a reason to hold back from raising rates in Q1 2023, but both suggest that risks are tilted towards a slower pace of tightening. The outlook for the balance sheet, and more specifically QT, will be another key theme at this week’s meeting. It will be interesting to see whether the ECB will be pressed to sell bonds outright or stick with roll-off. We would expect the central bank to begin with an Asset Purchase Program (APP) roll-off equivalent to a monthly reduction of €25Bn in the balance sheet on average. Currently the ECB is still using Pandemic Emergency Purchase Programme (PEPP) reinvestments to compress spreads and the Transmission Protection Instrument (TPI) remains at its disposal if conditions deteriorate further. Both these tools limit how far the ECB can go with QT.
Sources:
1Eurostat as of 30 November 2022
2National Accounts as of 30 November 2022
3Bruegel as of 31 October 2022
4Bloomberg as of 30 November 2022
Yield Curve Control Goblin Capital presents you -- The most risky contrarian trade you can currently take --
Am I all in? Yes
Do I have children? No
Am I still young and not much to lose? Yes
Do I have a lot of bad debt? No
Will I financially recover if this trade goes South? Yes
Therefore, my dear Goblins: I urge you to only play with money that you are willing to lose. Please do not bet the house and the kids on this trade.
This will be the outcome you are betting on:
BOE — Recently reverted to Quantitative Easing (QE) in order to save its financial system, which will soon morph into YCC — more on this later.
BOJ — Continuing their policy of YCC in order to save their banking system and allow the government to borrow at affordable rates.
ECB — Continuing to print money to purchase the bonds of weak members of the EU, but has pledged to begin Quantitative Tightening (QT) soon — more on this later, too.
PBOC — Restarting the money printer in order to provide liquidity to the banking system to prop up the falling residential property market.
Fed — Continuing to raise interest rates and is shrinking its balance sheet via QT.
Source: A. Hayes, Medium article "Contagion"
See you in Dubai next summer.
Regards,
Hugo
Chief Executive Goblin
Goblin Capital
The SNB could surprise (again) with a larger than expected hikeThe SNB (Swiss National Bank) are expected to hike interest rates tomorrow, which would send their rate above zero for the first time since 2011.
The central bank entered ZIRP (zero interest rate policy) between 2011 – 2015 before switching to NIRP (negative interest rate policy) with a rate of -0.75%, where it remained until June this year. And with seemingly few paying attention, they not only hiked rates but came out swinging with a 50bp hike and sent shockwaves across currency markets. This quickly saw the yen strengthen as traders assumed the BOJ would be next to follow, but we’re still waiting and will likely be for some time. But the main point I am making is that the SNB are likely to hike again tomorrow, and it would be wise to at least be prepared for a larger hike than some expect.
A 50, 75 or even 100bp hike could be on the table for the SNB
A recent poll saw economists up their 50bp hike for the SNB to 75bp. But in light of Sweden’s Riksbank hiking by 100bp, wholesale prices in Germany exploding higher and the potential for the Fed to hike by 100bp, I’m not discounting the potential for the SNB to join to 100bp club. Besides, they hiked by 50bp when the consensus was for no change at all and have a track record with an element of surprise. Furthermore, the Swiss government upgraded 2022 CPI from 2.5% to 3%, and for 2023 from 1.4% to 2.3% - so perhaps they know something we don’t.
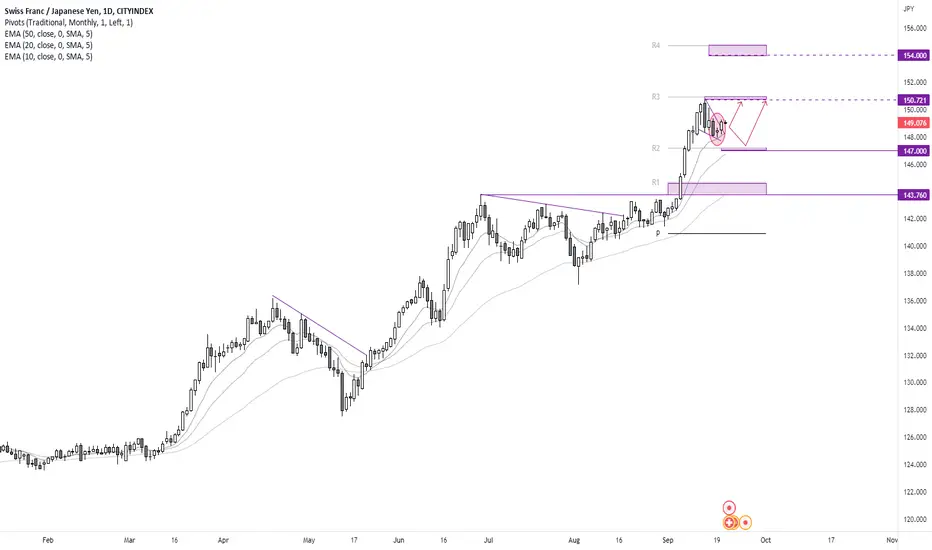
CHF/JPY daily chart:
There are fewer finer examples of a strong bullish trend on a currency chart, than CHF/JPY right now. Momentum has been increasing during each impulse move higher, the moving averages are in ‘bullish sequence’ and fanning out, and prices are respecting the closest average as support.
Prices have been coiling up within a falling wedge pattern (bullish in an uptrend) and potentially printed its swing low this week at the 10-day EMA. Furthermore, a 3-day bullish reversal pattern called a morning star has formed, so the bias remains bullish above this week’s low and for a move to the 150.71 high. A break above which brings 154 into focus.
However, even if prices break low we would still keep an eye out for a potential swing low, given the diverging policies between the SNB and BOJ.
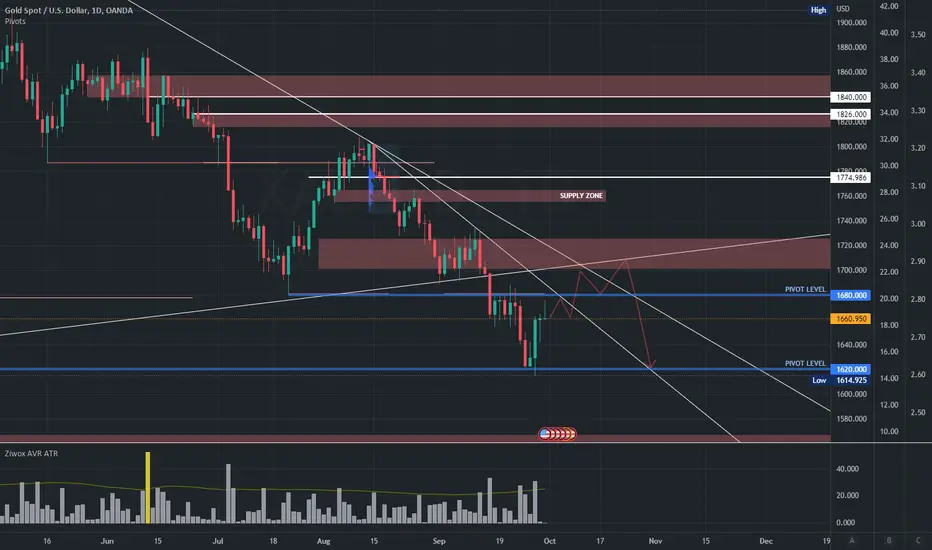
Weekly gold, another short opportunityTraders will keep eyes on global bond markets for next week because if the Bank of England's strange policies continue, it could help gold to rise
while the Bank of Japan, which is concerned about high prices in USDJPY, should intervene in the forex market. In addition to buying yen, they can sell US bonds in the markets and witness fluctuations in bond yields.
The risk of the economic recession is the driver of the rise of gold. But in the short term, the attention of all traders is on contractionary policies and decisions of central banks, which can put pressure on gold.
As we told you in last week's analysis, any upside movement in gold will be short-term and provide a selling opportunity.
Because the US dollar is in the overbought zone and also the bonds are at their highest points, the take profits have the possibility of raising the price of the gold.
On the other hand, due to the hawkish policies of the central banks as well as the US central bank, this pressure on gold will not be removed
and as long as we observe the rotation of the monetary policies of the central banks, we cannot expect a stable rise for gold.
The world's largest bond market has fluctuated strongly in the last week due to the fear of the British debt crisis.
But, with the intervention of the BOE and the introduction of the government bond purchase program, the treasury bonds' price fall was compensated.
The trend changed as the Bank of England intervened in the bond market and it lowered the yield of American bonds.
Now, in addition to the policies of the Federal Reserve, other central banks also affect bonds and we have to care about them.
As we said in the analysis, gold is bearish in the medium and long term until we see a turn in the contractionary policies of the central banks
But this week due to the upcoming economic data and the possibility of correction of the US dollar index and US bond yields, there is a possibility of gold increase.
However, we predict a turbulent week and our suggestion to traders is to wait this week and sell gold from the high points.
$1700 to $1724 is our sightly range to looking short opportunity to the$1620 area
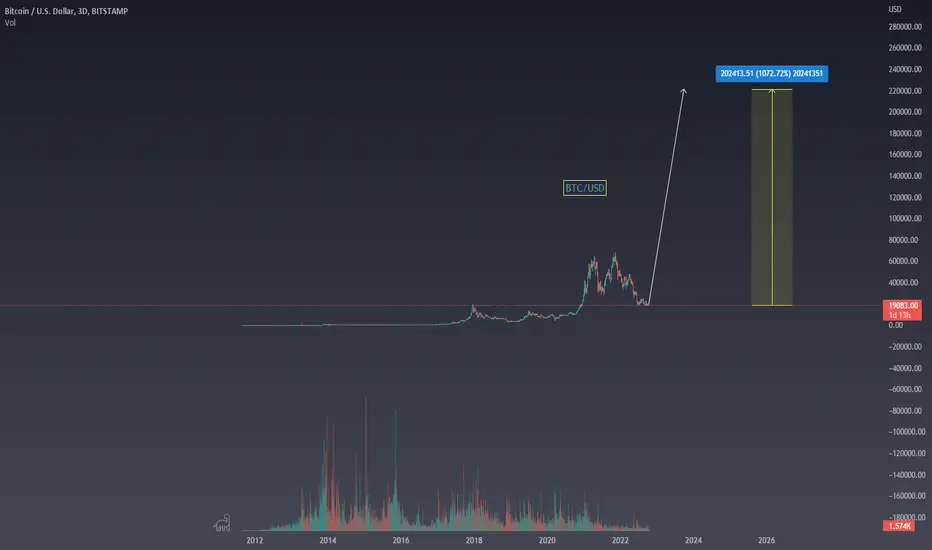
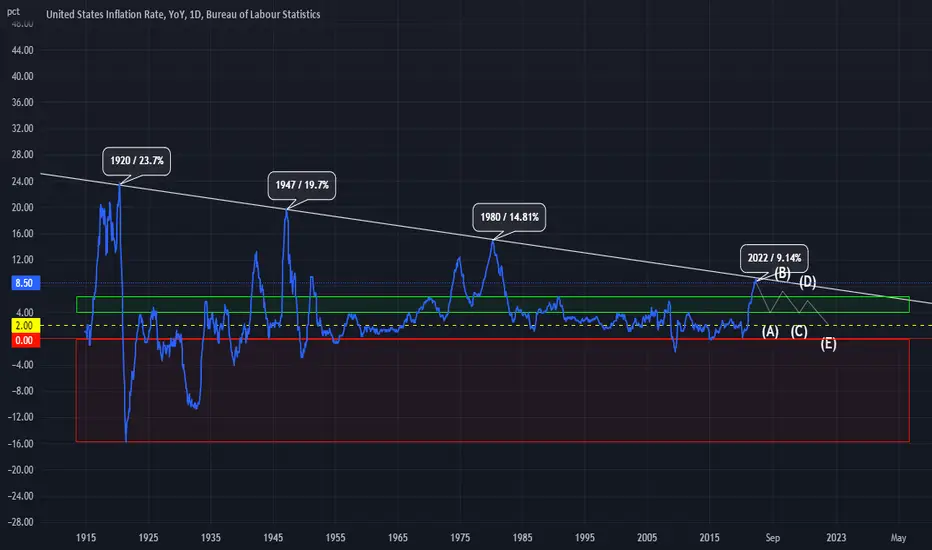
INFLATION HAS TOPPED OUT!Good day
We have all heard the news regarding the FED increasing interest rates in order to solve the inflation "crisis" we are currently enduring. Some say this is great, some say this is horrible, however, overall this move was inevitable as markets such as this are cyclical and manipulatable by those who control monetary policy. For those who are in the market for a quick buck that follows the advice of so-called pro traders, this may not be the greatest time for you. On the other hand those with diamond hands, the smart money understand the benefits of this very rare occurrence in time. Not only will you be handed a highly decreased asset to invest in, in the next few days/weeks but, your spending power will increase due to the FED's attempt to bring inflation to 2% on top of a substantial increase in wealth once we are out of the thick of it. (2024)
It is not possible to know when inflation will reach 2%, only those who control the market fluctuation know these dates but for now, we need to understand that we are going to be in a recession most likely for the better part of 2 years, which coincidentally will line up with the cyclical bull market structure of BTC. Could this be a coincidence or are we heading for a bull market never seen before? it could be argued that the crypto space specifically has been held back in the recent bull market and like a spring will eventually jump to levels only one could dream of.
This statement will be strengthened dramatically as the world moves into a space where digital currency becomes the framework of the exchange of value internationally and in all aspects of the current macroeconomic structure. This narrative will only be pushed on an institutional level once the ever-desired and increasing space achieves regulatory clearance of some sort in order to enable governments to sustain some sort of market dominance. This idea is widely unexcepted by the retail investor as most feel governments must be done away with in order to open up for a fully decentralized network to govern our financial sector globally... as great as this sounds it just sounds more and more like a pipe dream.
We as people need to have some sort of governance and a system that regulates our decision-making on a financial level or else chaos will break out leading to potentially societal collapse. But on the bright side, the crypto space will eventually allow for a stable deflationary environment where our wealth will have a safe haven to grow.
All we need to do is sacrifice complete decentralization in order to achieve a potential innovation of the financial system that will revolutionize finance forever... In this case, we all win...
@TradingView
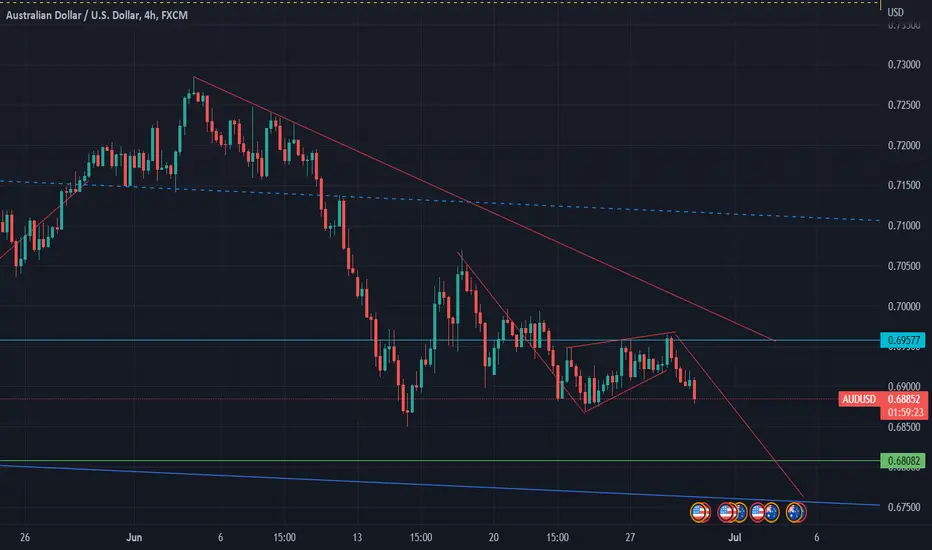
AUDUSD bout to go down underA couple of key factors here need to come into play, inflation figures need to come back worse than expected in July, followed by the fed becoming more hawkish with their monetary policy. Australia will follow suit and hit that cash rate target of 3-4%. Cost of living isn't taking a reprieve and the mining industry isn't saving the australian economy atm. If we see a reversal of QT from the fed we could see a bounce in risk on markets. But for now the USD looks to reign supreme. Shorting the bear flag to 0.6780 with a breakdown in the support we could see a bearish continuation to 0.6100! Things are getting spicy and you're kidding yourself if you think the markets seen the last of volatility. NFA DYOR
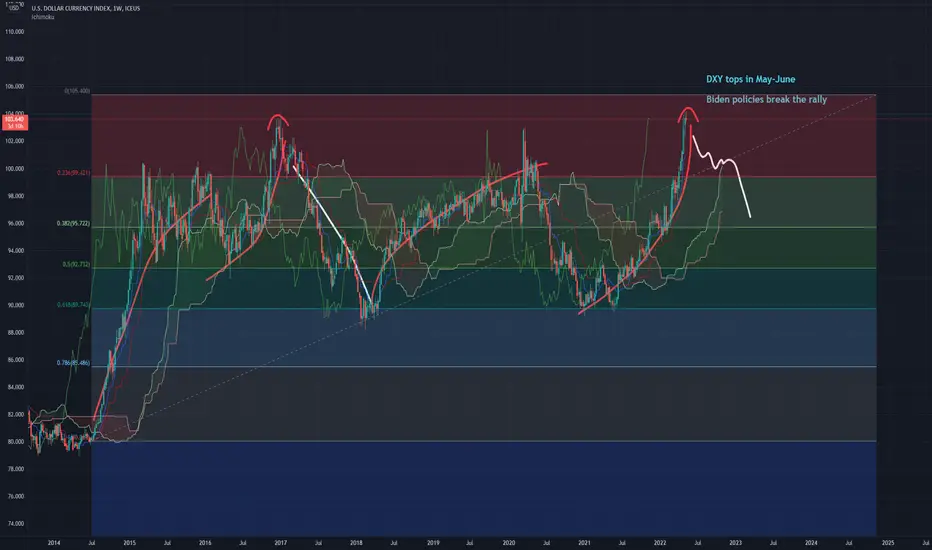
Dollar DXY Top happens May-June - Biden Policy CatalystDXY can run a bit higher, based on fib extension and candle patterns, this should find a catalyst to move it back down lower. This Dollar Long Mania is similar to the Gold fake-pump at the beginning of Russia-Ukraine conflict
WILMINGTON, Del. - President Joe Biden will draw a contrast between his economic plans and those of Republicans in remarks on Tuesday focused on inflation, a White House official said.
BATTERED U.S. STOCKS MAY NOT BE BARGAINS AS INVESTORS BRACE FOR INFLATION DATA
Biden, a Democrat who is suffering from low approval poll numbers ahead of the November midterm elections, has sharpened his rhetoric against Republicans in recent weeks, dismissing, for example, former President Donald Trump's "Make America Great Again" MAGA movement as extreme.
President Joe Biden will draw a contrast between his economic plans and those of Republicans in remarks on Tuesday focused on inflation, a White House official said. (Getty Images / Getty Images)
On Tuesday Biden will lay out his plan to fight inflation and "contrast his approach with Congressional Republicans' ultra-MAGA plan to raise taxes on 75 million American families and threaten to sunset programs like Social Security, Medicare, and Medicaid," the official said.
GET FOX BUSINESS ON THE GO BY CLICKING HERE
Last week Biden took aim at Republican U.S. Senator Rick Scott's economic plan, saying it would raise taxes on 75 million Americans, most of whom make less than $100,000 a year. Scott, who said he planned to cut taxes, is leading Republican efforts to get Republicans elected to the Senate.
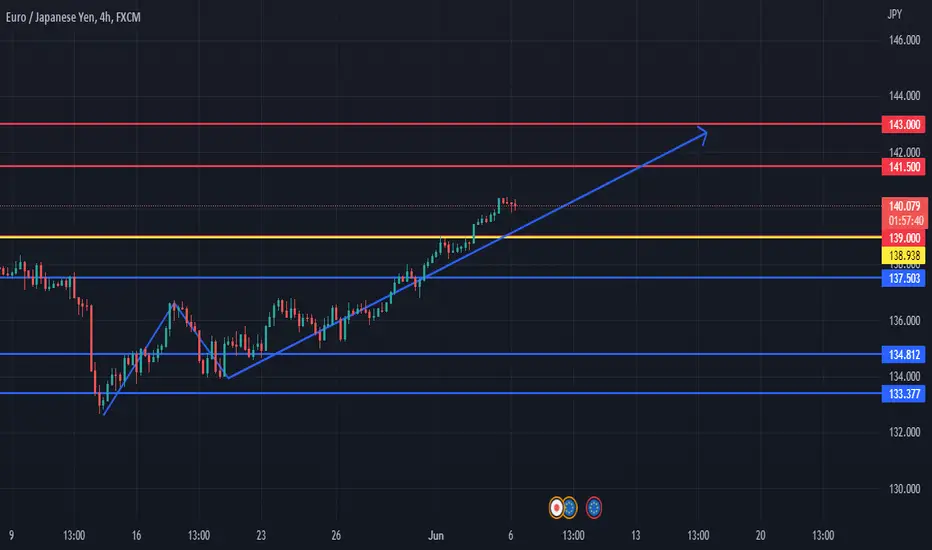
EUR/JPY CONTINUED GAINS SEEM LIKELYHaruhiko Kuroda, Governor of the Bank of Japan (BOJ), expressly denies expectations of monetary and fiscal policy tightening in the coming months.
He said Japan is in no position to tighten monetary policy.
This clearly indicates that the yen might be significantly weaker.
Technically, price is currently treading above 138.938.
We expect it to find resistance at around 141.629 to 143 area.
However, upside momentum may be nullified if a reversal happens to occur when price pullbacks and breaks below the turning point 138.938
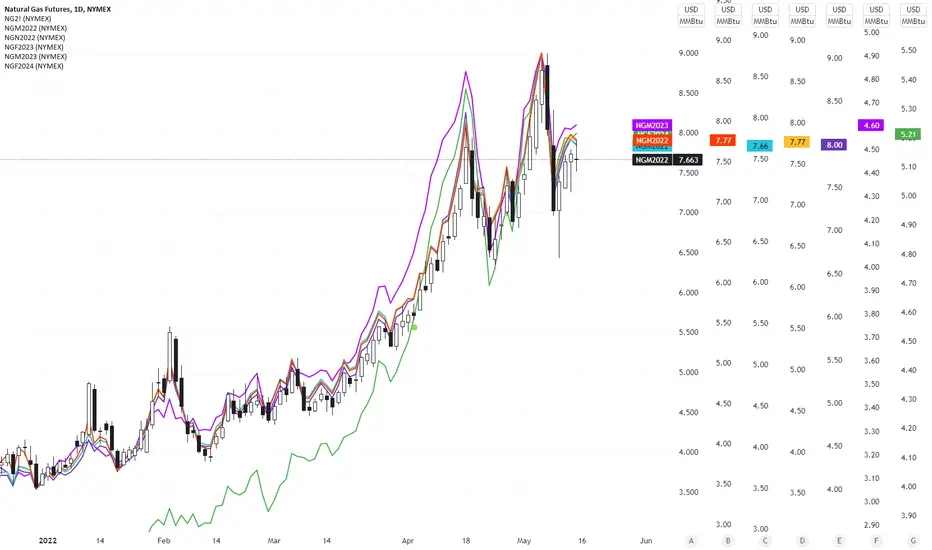
Henry Hub Natural Gas futures showing slowing momentumHenry Hub Natural Gas futures showing slowing momentum across the futures curve up to Jan 2024 ($NGF2024).
Recent geopolitical risks i.e. The Russian invasion of Ukraine, have pushed the prices of both spot and futures of commodities higher.
Natural Gas futures across the curve are tracking each other with a tighter spread till Jun 2023 implying that the market participants expect the prices to remain elevated for a longer time. However in the short-term, the price action shows an exhaustion by bulls forming a ranging pattern with a possibility of a reversal.
Central banks around the developed world highlighted in their Monetary Policy Statements this May that they expect energy prices to remain elevated for the next 18 months. I'll definitely be watching out for the impact of the policy tightening regime - which we are in now - to the demand side of the economy, and it's second-order effects on gas prices.
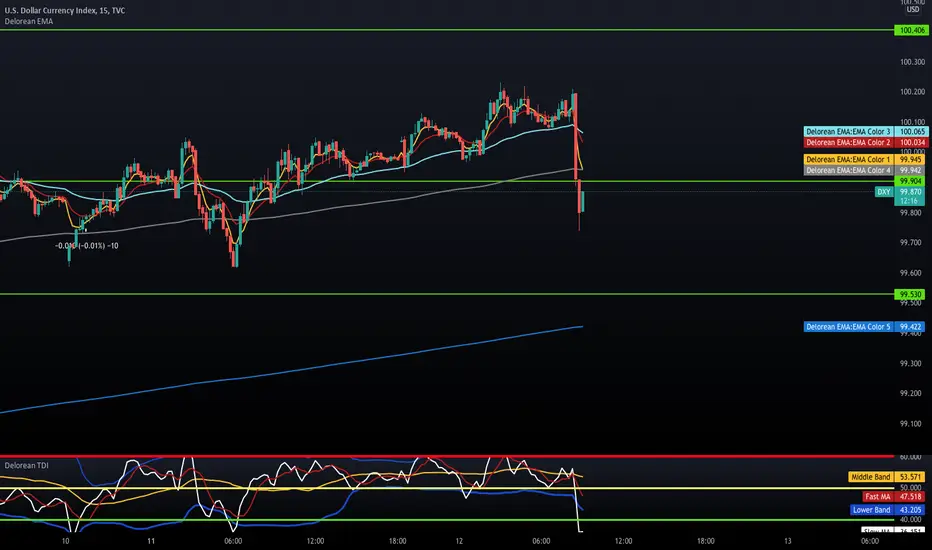
WHEN THE DOLLAR CRASHES!!!!!When you trade US Based pairs (anything tagged to the dollar) it's important to be mindful of news and what price the DXY is trading between.
EURUSD has been shorting hard because the DXY (dollar) has been at an all time high.
With the bad inflation news that just recently came out, the dollar immediately fell off a cliff causing all US Base pair to experience a correction in the markets.
This is nothing to get worried about.
When we know when and why these things happen in the FOREX market we can better capitalize on these moves for huge profits.
Happy Trading Family!
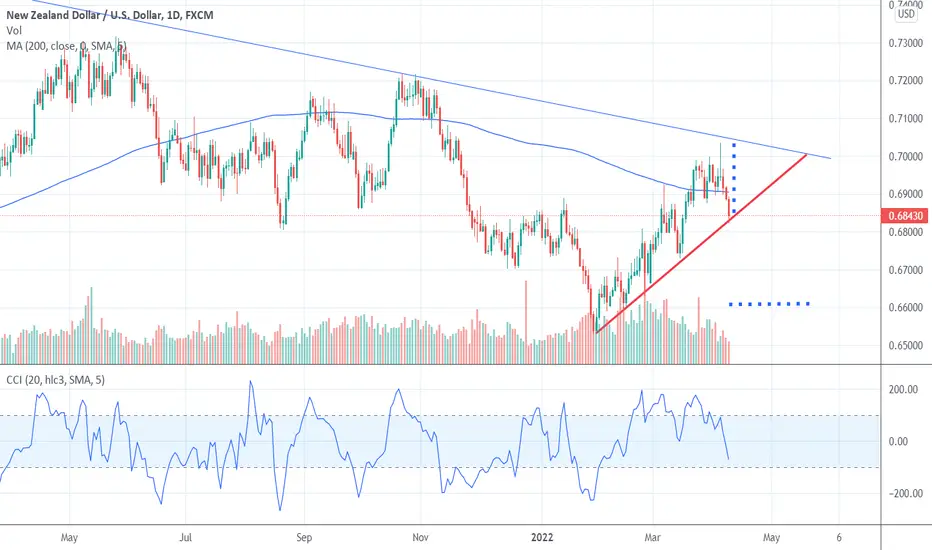
NZDUSD: short before the New Zeland central bank speachOn Wednesday, the New Zeland central bank will speak about the next monetary policy about raising the interest rate: it's been estimated that the probability of a rate hike is 90%.
From a technical point of view, NZD/USD seems to be uncertain: it plays around its 200 simple moving average but, lastly, it seems to show strong weakness. If the NZD would cross its support (red line), I expect the price to reach at least 0.66. Target has been found simply from the distance between its high (04/05/2022) and the support line.