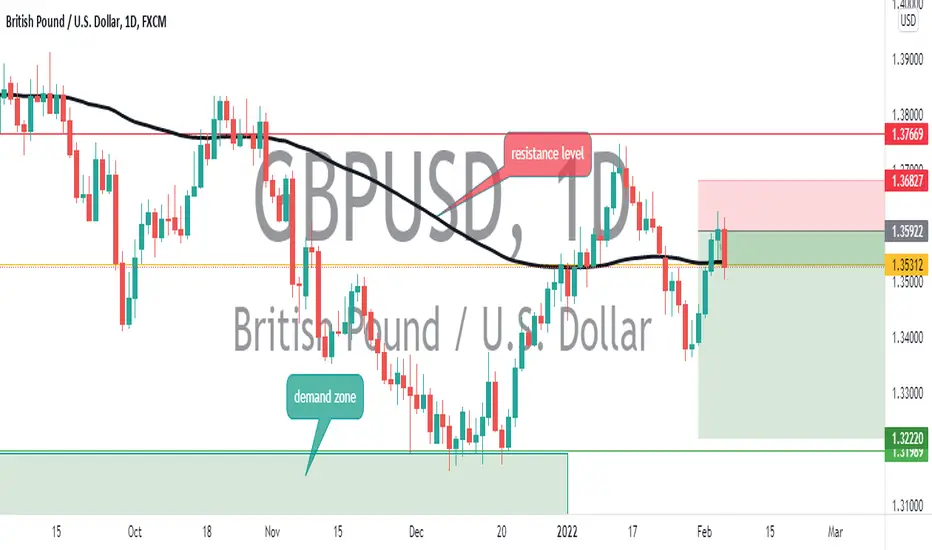
GbpUsd Analysis for 07-02-2022This is an analysis of GbpUsd for the coming week. Technically, Gbpusd has been in an overall downtrend printing lower highs and lower highs on the charts. recently, the price made a lower high from a demand area as shown on the chart approaching a resistance level as the BOE increased interests rates from the fundamental stand point. Irrespective of the rates increase, the figures reported was as expected, although, there are whispers that the BOE may still increase rates before the end of 2022 . However, the bull run was brought to a halt as the NFP reports from the US was released. the reports indicates a stronger USD hence signifying bearish opportunities for GbpUsd . Sentimentally...
Let's go take some risks, let's go make some money.
Money
Bitcoin Has Death Crossed - Buyers Beware - Protect Your Cash All simpcoins have followed suit. Death crosses abundant. Death crosses are not dips to buy. Protect your cash or lose it all. Historic volatility ensues. $VIX surge. Buy $UVXY

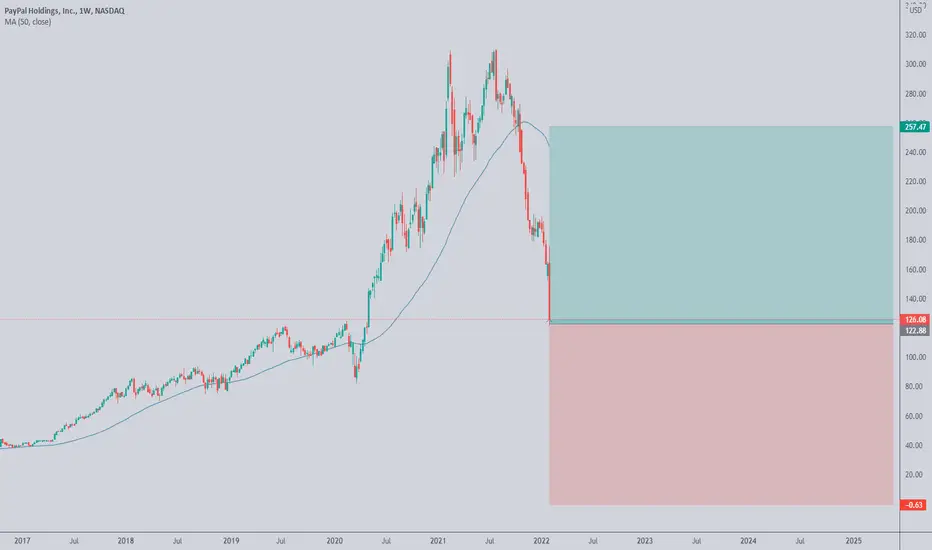
PAYPAlPayPal shares have slumped over the past several days.
The company still has strong competitive advantages.
The shares look cheap at current levels.
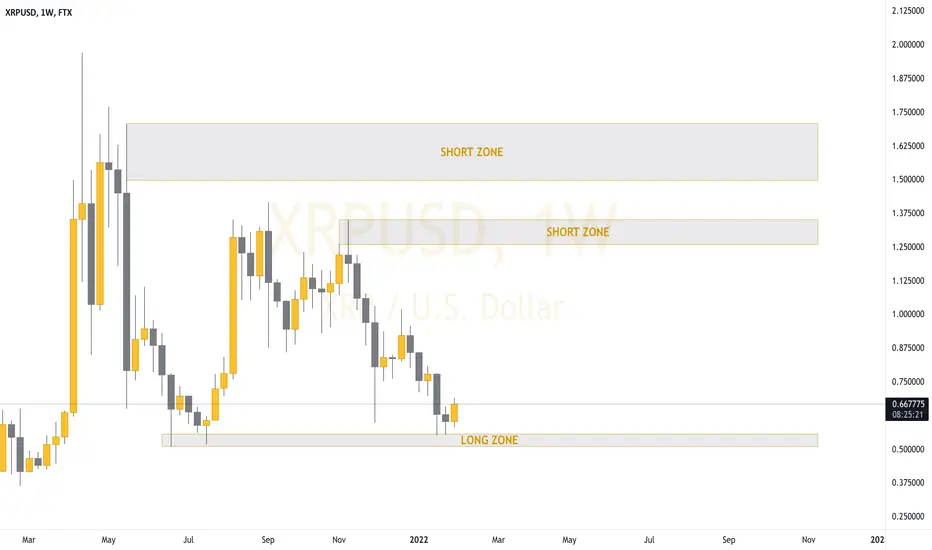
XRP FORECASTOccasionally we will post some crypto analysis if there is a lot of interest in the currency.
XRP is a very popular one so we decided to analyse it. Most cryptos are now reversing from a long term down trend.
XRP is no different, we don't tend to short crypto but use these points as targets to take profit from our longs as you can see by the potential short zones.
This is what we see for XRP long term if we continue bullish order flow.
$1.28 and $1.70 are our target zones!
ETHEREUM FORECASTEthereum respected our long zone and now is tapping our short zone. We don't usually tend to short Cryptocurrency but we like to be aware of where price can potentially reverse and take profits from our longs.
This is our analysis.

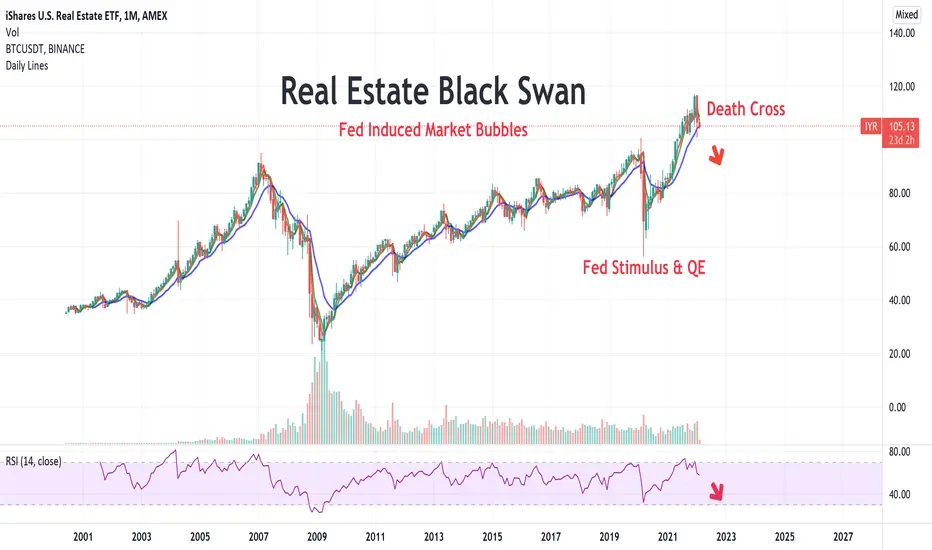
IYR Housing Market - Imminent Death Cross - A Black Swan EventFed induced market bubbles abundant. Buyer Beware. A financial crisis of biblical proportions is coming. Avoid the "easy money" investments that seemingly "always go up".
The masses will be left for dead. Volatility continues to surge.
Buy #UVXY
EURUSD 4hHELLO TRADERS
I hope you all a good holidays .
I think euros is on good position for a correction .
This is article not financial advice, always do your own research .
If you have any questions, you can write it in comments below and I will answer them.
And please don't forget to support this idea with your like and comment, thank you.
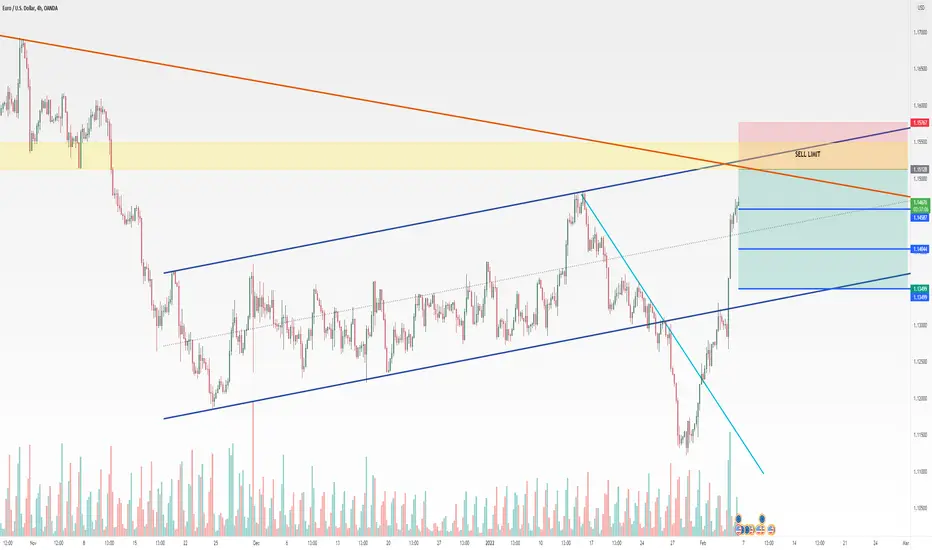
EURUSD 4hHello Trader
Let's take a look at EUR/USD situation in the chart
In the current situation, EUR has been able to maintain the level of support that can be the first area of accumulation.
We suggest buying at two lower levels as well
Do not miss this opportunity because you will regret it later.

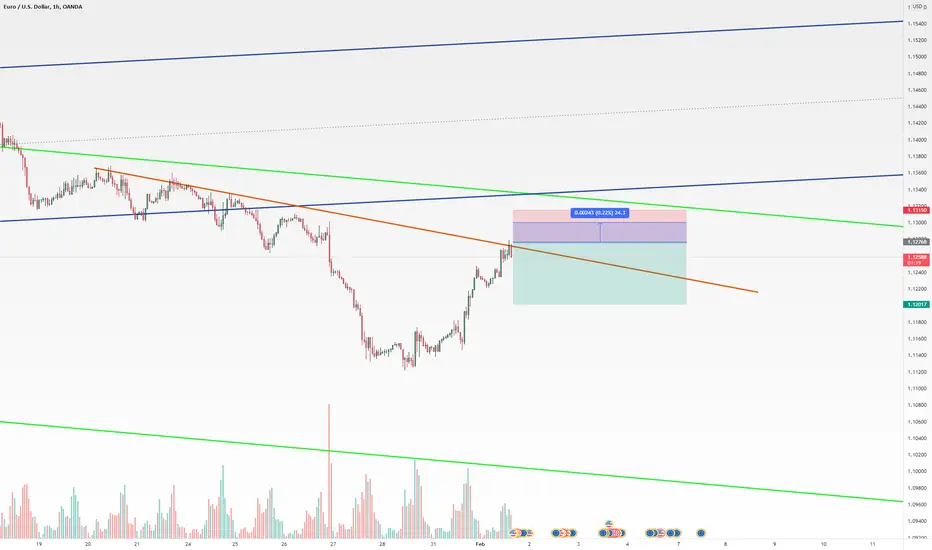
EURUSD 4hI hope all you have a good week in your trades
I want to talk with you about USDJPY , because its on resistance zone and we can have a correction .
This is article not financial advice, always do your own research .
If you have any questions, you can write it in comments below and I will answer them.
And please don't forget to support this idea with your like and comment, thank you.
Buying analysis USDCADWe got more evidence telling us the market might be stronger for buys. As you can see, we got a demand zone within the fibonacci. Adding that to the fact that we're currently in a uptrend tells me that the two trendlines are most likely just manipulation. I can also see some more evidence on a lower timeframe but that will be to complex for this timeframe:)

POSSIBLE 600 PIP DROP Keep it simple ... Always.
Risk : Reward
1 : 20
_______________________________
Moving Stoploss to break even if price gets to 1.8900
Manually closing order if price closes above 1.9015 (on the 4H timeframe)
Past Experience DOES NOT Determine Future Outcomes.
Past Experience DOES NOT Guarantee Future Outcomes.
Trade Safe 🥂✅

🤔 Healthcare Potential Booming Company?I have a long list as to why this is good. To just dumb it down, it's getting ready to potentially reverse. Check Kagi, Heikin, Baseline (I don't like the "stick" charts), and the regular candle to see where the original retest point was of the shoulder engulfing seller candle. Price has retested that point across all charts and is showing a complete slow down. Price sat at around 5.96 and below for quite some time due to the support level and is showing signs of major slowdown on the Heikin chart. Try baseline for a clearer version of the slowdown but aside from that, don't use it unless you're double checking your work. Anyways, I'm in. Enjoy if you do, if not thanks for reading. Note* I did not proof read, sending as is.

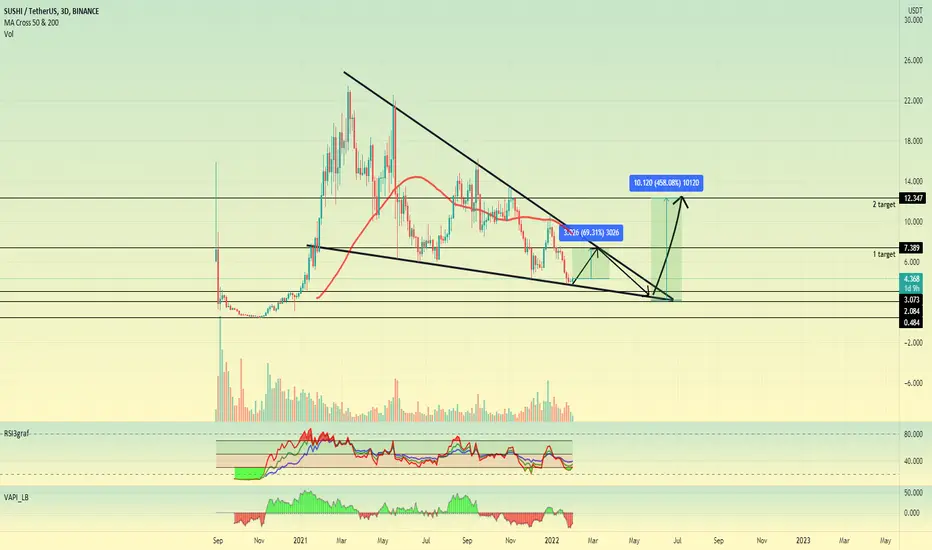
SUSHI/USDT - BTCHello everyone, I want to share with you, friends, my vision of the situation on the SUSHI cryptocurrency asset, both paired with USDT and BTC.
Since the end of January 2021, a descending wedge has been formed, the asset price is accordingly clamped to the lower point of this pattern.
At the moment, there has been another test of the lower boundary of this formation, an excellent zone for purchases with a local goal of up to +69% from the current values.
After reaching the upper limit of this pattern, as well as reaching the SUSHI price of 7.389, I would wait with further holding of the long position and only at the breakdown and consolidation above the upper limit of this figure I counted on further growth, there is a possibility of a drop in the price of the coin in the lowest part of the wedge with a goal of 2.2-3.073$.
I think this is an ideal option for buying this asset , and I am sure that this will be followed by pumping the price to at least $ 12.3
Also consider the chart to BTC
A classic double bottom is formed, after working out the wedge, the local formation of the descending wedge is also taken into account when drawing the right shoulder (inverted head and shoulders).
In addition, a certain trend is being carried out both from the lower part of the November 2020 loy and from the September 2020 peak, which intersects with the upper limit of implementation (May 2021 growth).
According to this pattern, traders can expect an increase in the SUSHI price in the 0.0003178-0.0003550 zone
If you liked this idea, please like it, thank you :)
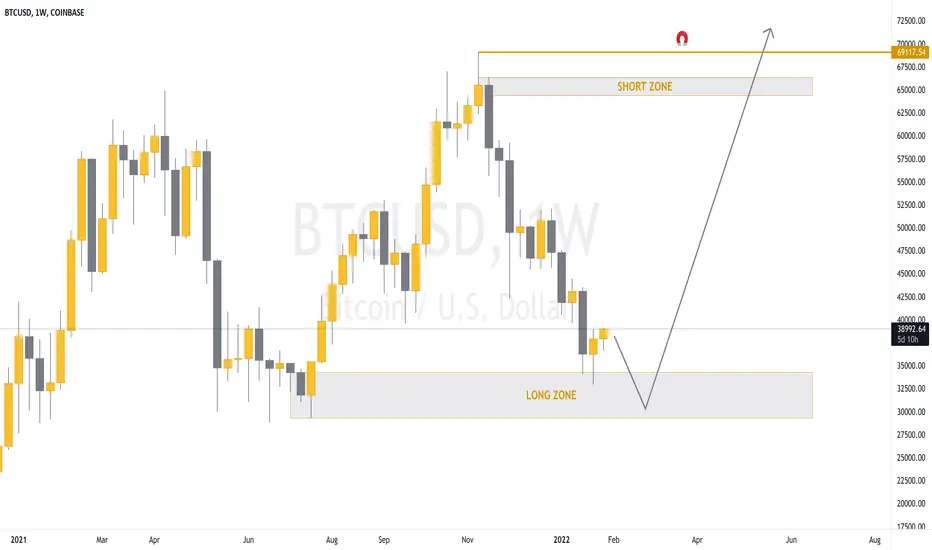
BTC ForecastThis is our forecast for BTC/USD we believe it may come back into our long zone once more before really taking off. If our short zone fails then we would expect price to drop to $18,500 lowest before rallying again.
Whats the difference between Risk Management & Money Management?TLDR:
Risk management generally is determining what portion of your capital you are willing to risk in a trade and staying true to that.
Money management is how you would spend the money earned (in this case through trading) .
Eg : Rather that withdrawing all the profits from your account you can let it be there and compound it, or rather than spending it on unnecessary luxuries you can save it for a rainy day .
_________________
Full:
This is something I usually get asked many times by new starters in trading as they are both common terms that you will hear as you learn about trading and investing. They are both vital concepts but it's important that you know the difference between them.
Money management refers to the processes of budgeting, saving, investing, spending, or otherwise overseeing the capital usage of an individual or group. The term can also refer more narrowly to investment management and portfolio management.
Money management broadly refers to the processes utilised to record and administer an individual's, household's, or organisation's finances.
Financial advisors and personal finance platforms such as mobile apps are increasingly common in helping individuals manage their money better.
Poor money management can lead to cycles of debt and financial strain.
In the financial world, risk management is the process of identification, analysis, and acceptance or mitigation of uncertainty in investment decisions. Essentially, risk management occurs when an investor or fund manager analyses and attempts to quantify the potential for losses in an investment, such as a moral hazard, and then takes the appropriate action (or inaction) given the fund's investment objectives and risk tolerance.
Risk is inseparable from return. Every investment involves some degree of risk, which is considered close to zero in the case of a U.S. T-bill or very high for something such as emerging-market equities or real estate in highly inflationary markets. Risk is quantifiable both in absolute and in relative terms. A solid understanding of risk in its different forms can help investors to better understand the opportunities, trade-offs, and costs involved with different investment approaches.

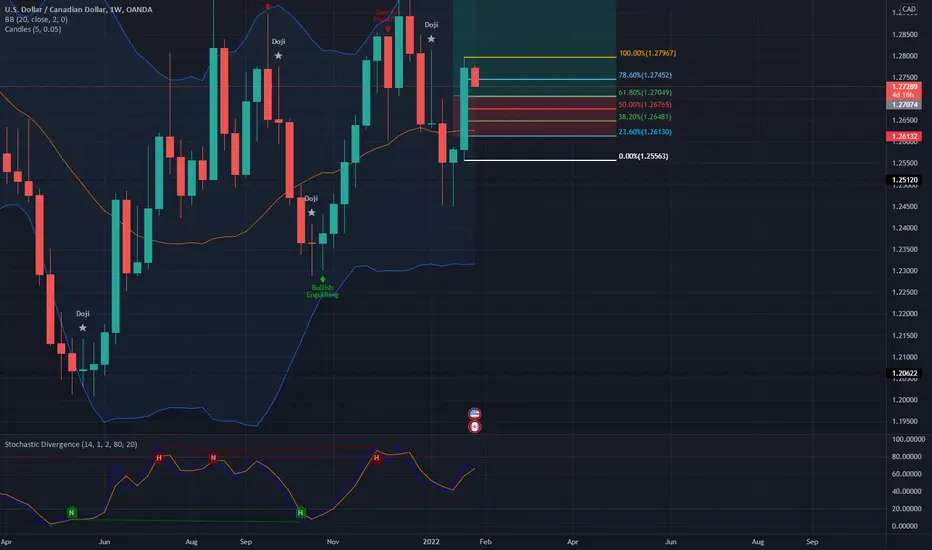
USD/CAD Outside Bar WeeklyWeekly Long trade on USD/CAD
Nice Outside Bar formed on the weekly looking to Long
Enter @ 1.27049 (retracement to 61.8)
SL @ 1.26130 (23.6)
TP1 @ 1.29453
TP2 @ 1.30371