Nice spot for a bounce on crypto marketThe crypto market has been in consolidation mode for a month since the big break down of mid june. Price perfectly held the retest of 2017's ATH.
Now the whole crypto market broke up this consolidation and is currently retesting it.
If you think the bottom is in and you would like to be long on this market, it's currently a nice area to enter position.
Keep it simple, use horizontals.
Thanks !
Moon

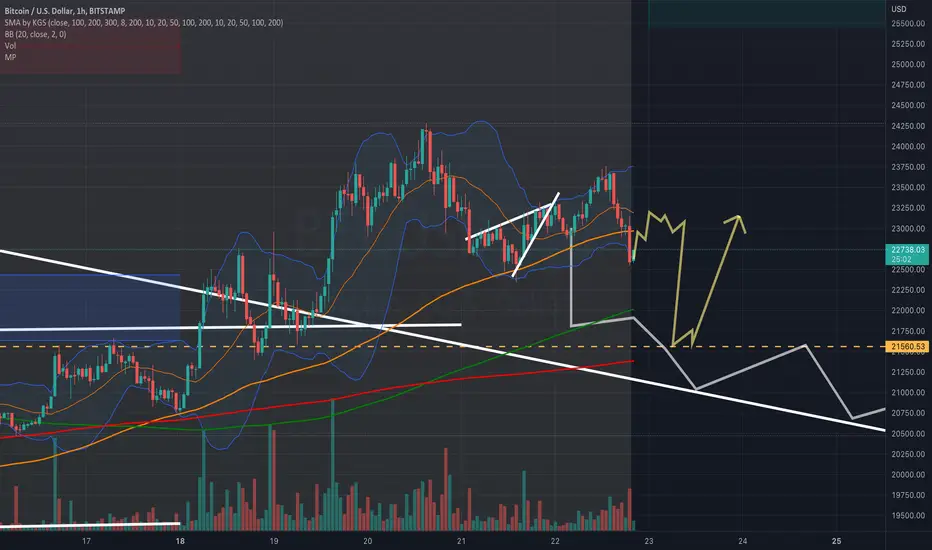
BTC forming Head and Shouldersif H&S forms and plays out, then BTC could drop down to support around 21.5 - 22k and see a bounce heading into New Moon on the 28th which reliably the time frame where local highs are made and price is generally bullish. We just exited the 5 days after the full moon where we reliably see local lows print, so I don't anticipate sustained bearish action, maybe some dips but should turn into a spring and have us hit higher highs than previous two seeks, maybe reaching up to 24k range
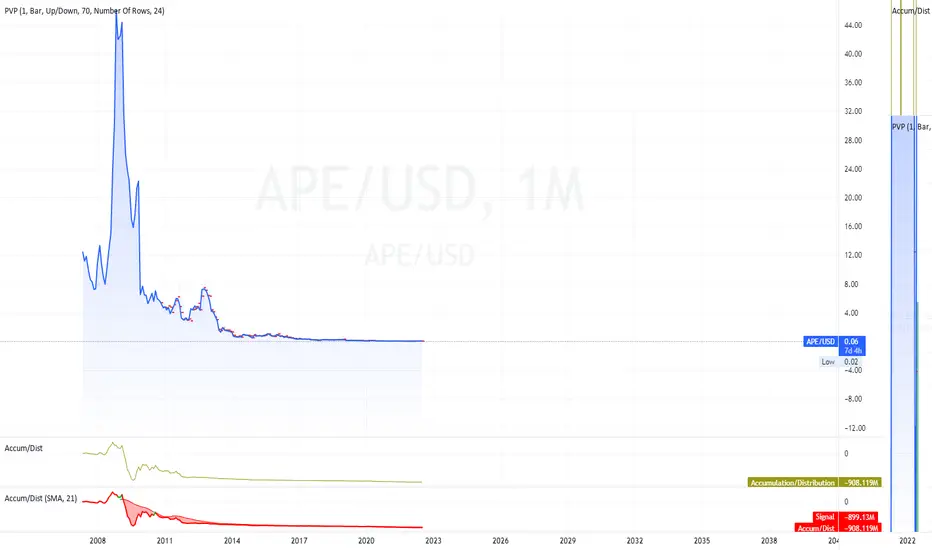
APE/USDThis is a classic sleeper your seeing the start of a big up tick. Huge dump off and huge buy in. Old money and new money and the start of a new shoot the moon scenario. Watch history repeat it`s self.
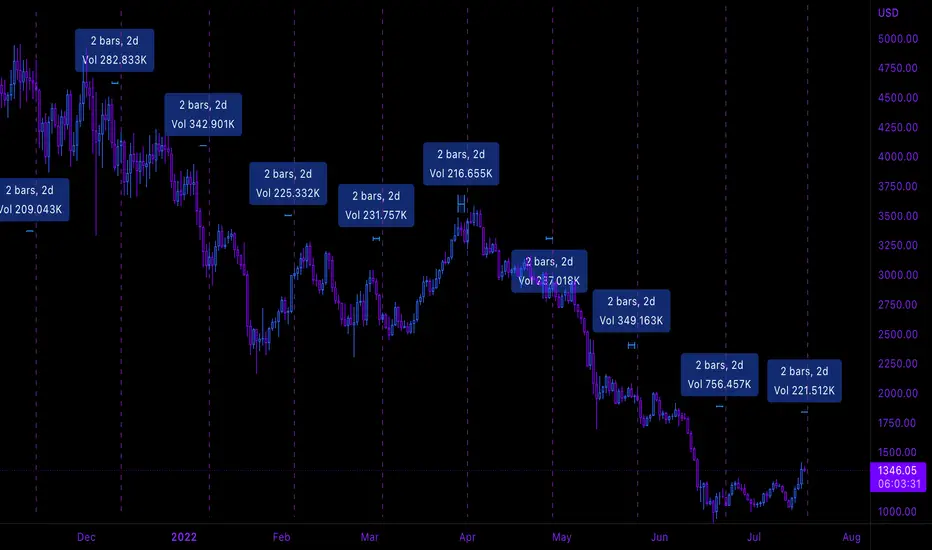
"Moon At Zero" ETH"Moon At Zero" is one of @NasserHumood most valuable indicators. When used with some common sense one can count the bars manually from phase to phase for clues.
For instance, counting 2 bars unto the next moon at zero dotted line presently with back data observation reveals with 95% repeated consistency what has happened in price.
One can then begin to observe the market conditions when consistent patterns are invalidated 3-5% of the time and compare to current market season.
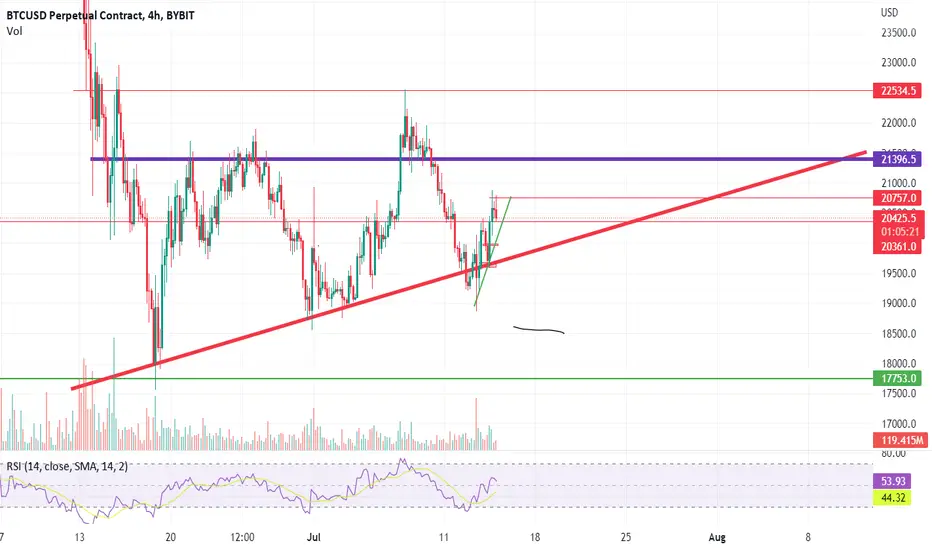
BTC 4HR ASCENDING TRIANGLEascending triangle is bullish pattern but cryto market behaviour anything will happen...
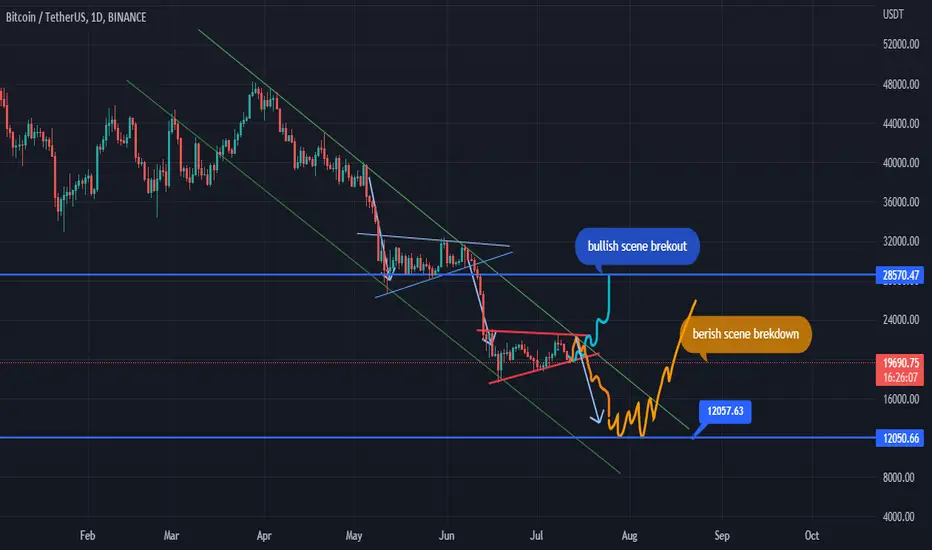
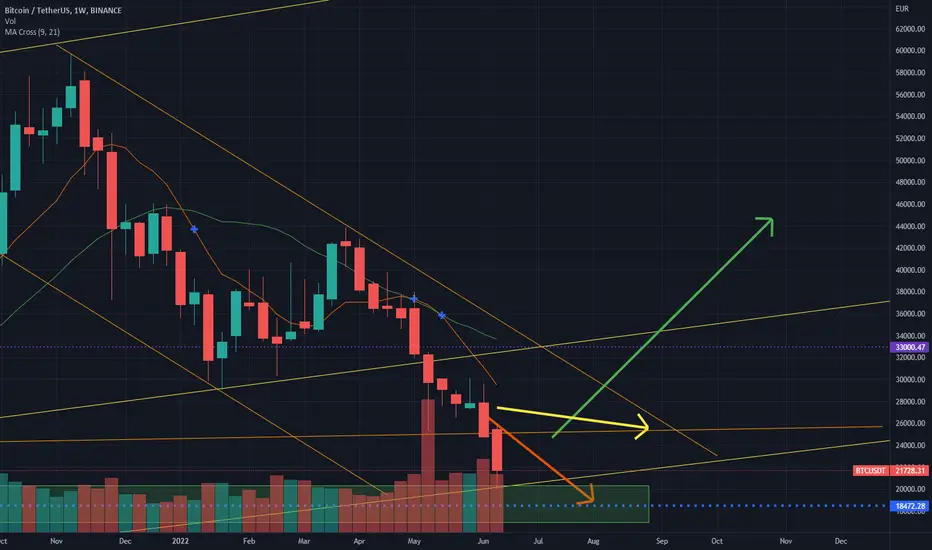
Bitcoin bullish or bearish.There are 2 scenarios which can play out one is bullish that we will have a bounce from the flag support upto 22k and we may see a pullback and breakdown from the flag support.
This is not a financial advice just for educational purpose.
bitcoin ideajust a potential play for bitcoin the yellow line isn't exact ofc but I'm guessing we will be ranging here for awhile feel free to share your opinion, allot people are expecting allot lower prices and it could happen. but I don't think so personally but DYOR

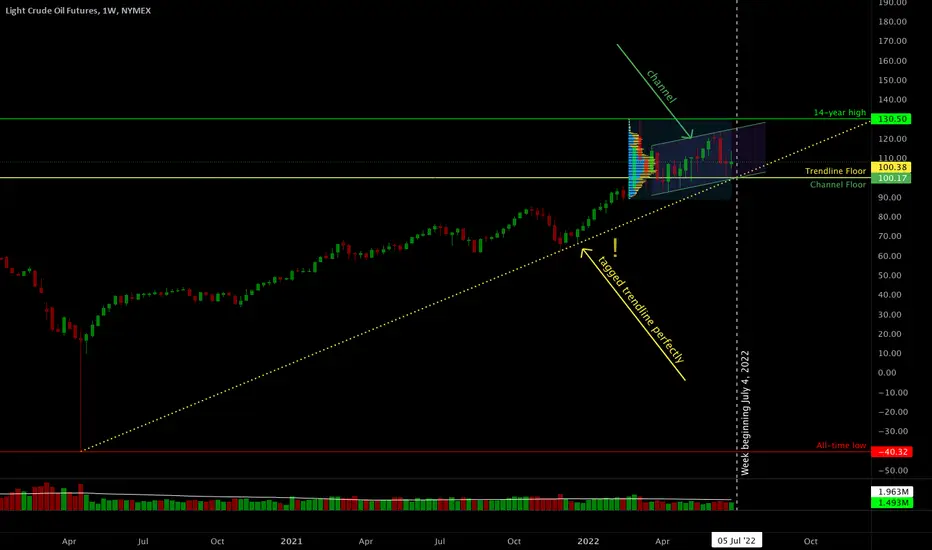
Negative-Price Oil Trendline Establishes Floor at 100.38A trendline drawn from the all-time low of -40.32 to the November 29, 2021 weekly low was tagged perfectly by the December 20, 2021 weekly low which occurred 3 weeks after the November low. This seemingly-unlikely tagging of a trendline which starts at a negative value suggests that the trendline may be respected if we approach it from the current $108 price level.
In the coming week which begins July 4, 2022, the trendline is at the price level of 100.38 and in the weeks that follow, it goes higher, therefore, it can be said that it has established a floor at 100.38.
There is also a parallel channel which many traders are watching some variation of. It establishes a floor of 100.17 as shown.
There is a volume profile drawn covering the price action from after the Russia/Ukraine conflict began up until today. Looking at it and at the setup on the week of February 4, 2008 which is similar to the current setup when looking at the 9/20wk smas and weekly candles, a swing long entry can be anticipated below 103 and above 100. A price target would be north of $120 if the 2008 situation is repeating itself.
The trendline increments at 1.22 cents per week so next week the floor will move up to 101.60, the following week it will be 102.88, the week after that it will be 104.10, etc.
XRP | USDT - Target 1 - 0.35The price has formed a falling channel . 100 MA - support level , 50-200 MAs - resistance. You can try to open trades from the lower border of the channel with a stop loss below the channel border

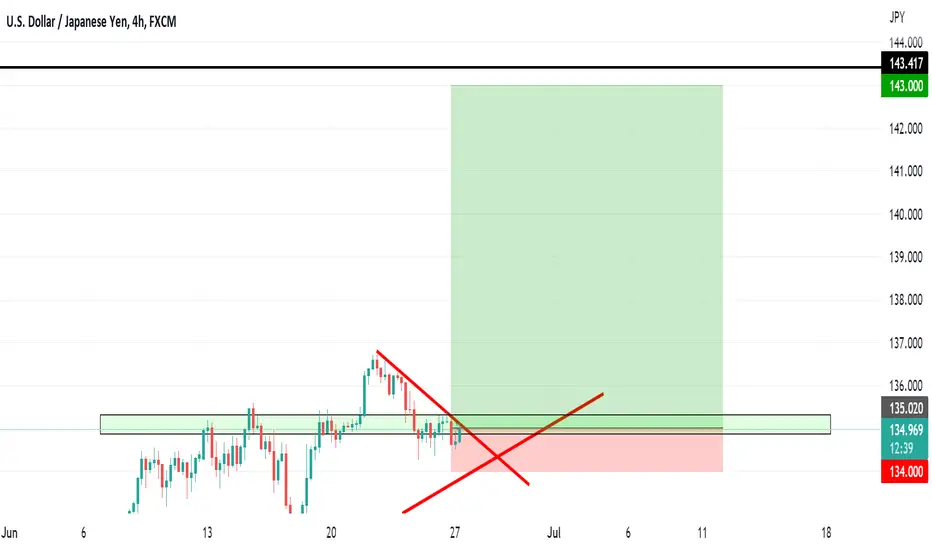
BUY NOW for 798 PIPSPair is still bullish, I don't see it going down anymore. Once we break the structure, we moon!
BITCOIN - Final Shorts ✅Following on from our last post, we indicated that there's a final bearish wave left. We are now on the verge of breaking down for the final time.
Once this bearish leg is completed, we will be looking for bullish price action for the next bull run.
Shorting Bitcoin here will be a bit risky with limited gains to be made. The bigger and better trade would be to wait for Bitcoin to bottom out and then look for buys.
However, if you want to trade the final shorts, approach it with caution.
SHORT Trade Idea:
- Watch for break of red ascending trendline
- Once broken, enter with stops above the recent highs
- Targets: 17700, 16000, 14500
We'll be back with an updated post once this bearish leg is done.
Goodluck and as always, trade safe!

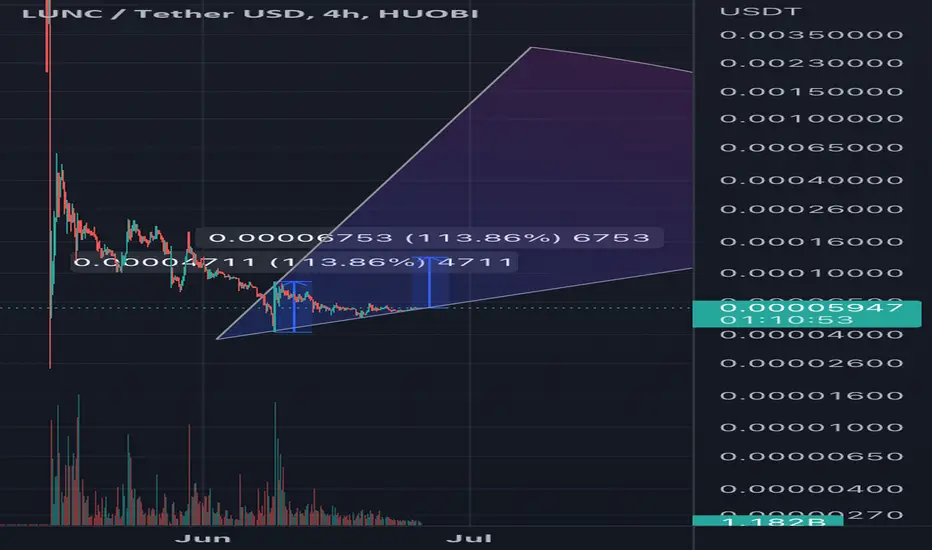
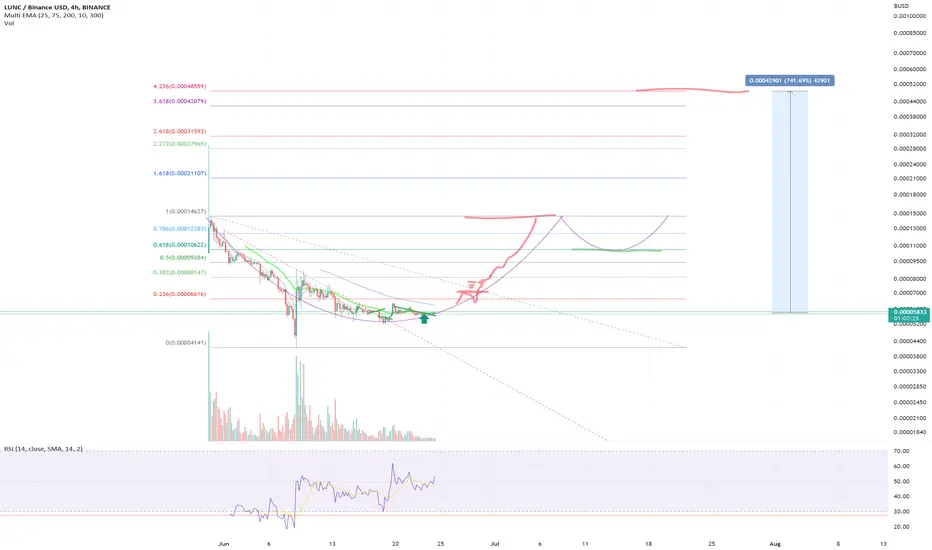
Luna Classic Long opportunitySo with all the crazy things going on with the Terra ecosystem Iam pretty surprised how the prices act for both Luna and Luna Classic.
I do believe this is a great time to buy in with a small amount of money and hope for the best. The community for Luna Classic is working hard to make it a
healthy ecosystem. If things go well this could make you millions so why not try it. It is a gamble though, I must admit. But worth it ;)
I do believe a cup and handle is possible to send it 700% up in the sky and who know how far real fomo will take it by then.. Let's hope for the best and good luck trading.
Cheres.
NKN Buying indicator gave PERFECT buying momentBuy nkn now , very oversold. Do your own research. Dont trade based on my ideas. Goodluck!

BTC just passed the test, bull is coming!btc will close the day >1.2 per cent.
bitcoin just reached the last fibo resistence at near 18.5k usd, and it passed without sticking.
after two weeks of slow recovery (0.1 per cent daily on avg), and two weekly inverted hammers (28 feb and 30 may), 0im sure the the price and buy volumes will rise on the next few weeks.
BUT make sure of buy patterns, even with a few potential profit loss.
it will test again near 30k, above that, may take less than a week, price will bull up.
JUST BE PATIENT!
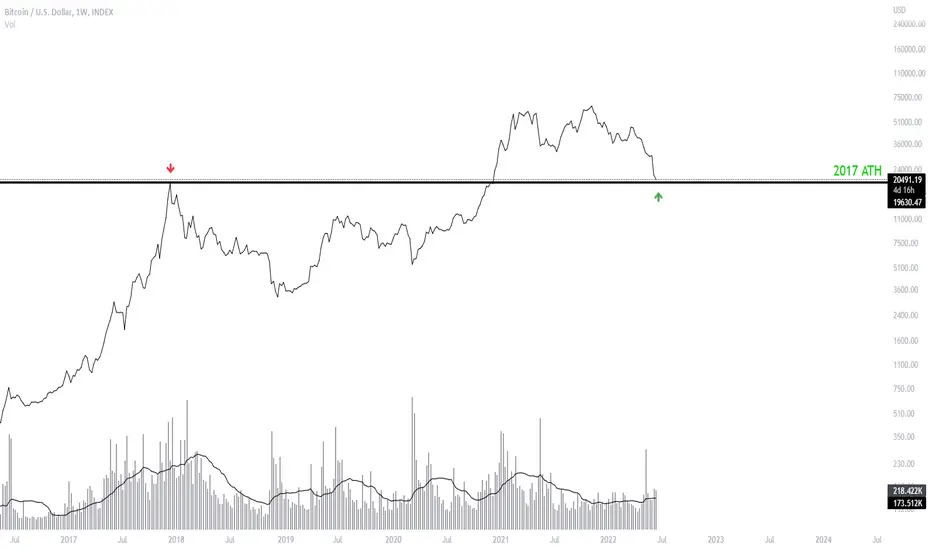
BTCUSD near 20.000$
EN : BTCUSD is actually near the top of 2017's bullrun, 20.000$.
This 20.000$ zone acted as a resistance. When we break a resistance, it flip usually into a support.
Is it going to happen this time again? Looks like a good long term opportunity.
FR : Le Bitcoin est actuellement à 2 doigts de toucher le point le plus haut du bullrun de 2017.
Cette zone des 20.000$ était une résistance. En général lorsqu'on casse une résistance, elle se transforme en support.
Est-ce que ça se passera comme cela cette fois? ça semble être une bonne opportunité d'achat pour le long terme.
Playin' hard to get...Ok whatever, change of plans, still moon just different path to target and revised target... what do you expect? This is GME.
I said everything I want to say on the chart, I'll probably have to file bankruptcy now but probably not. It's not about what I want, it's about what GME deserves.
Yours truly,
Hobo

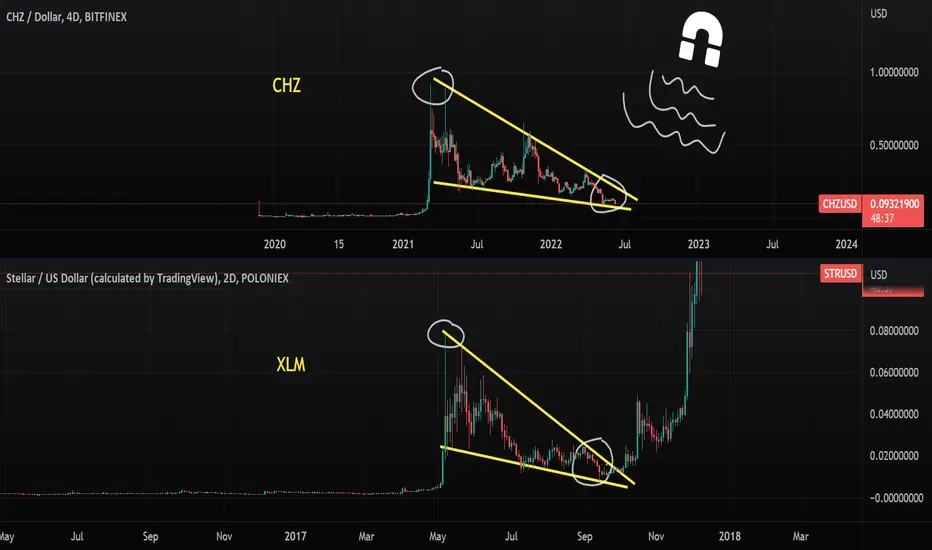
Chilliz Has a Junk Yard Magnet Wedge And is Ready For Bull!What's up trading view Family! What A Good Day to be Alive.
Today we will be taking a look at CHILLIZ and how similar the market structure is to XLM (aka STR).
Many people think we are headed into a bear market but I say we already had one! its exactly like the Altcoin bear market of 2017 (only a bit longer as the cycle grew)
I also see Bitcoin and Ethereum have a lot of upside left before they see another bear market anywhere near the size of 2018, and this will carry many undervalued altcoins into a bullish market.
Stay confident! Whales love buying blood in the streets.
Stay profitable.
ALT/USD on the best place for a bounce !TOTAL2 (which is Top 125 altcoins vs USD) is currently retesting the 2018 top.
This was previously resistance and is now being tested as support.
This is a good time to dig into some altcoin charts to find some nice risk-adjusted longs because invalidation of the trade is quite close
Thanks for following us! If you have any questions, please don’t hesitate to ask.

BTC- BOTTOM FOUND? Where would I buy fearlessly?Long Term, Scouting/Hunting for the Absolute LOW on BTC,
Bitcoin is considerably low right now, I do not see us getting close to this level but rather piercing it after we sit sideways in the future, we will likely see a retracement pretty heavy soon to the upside to create liquidity.
I would have limit orders set in this region if/when we approach these levels, first zone marked below at the absolute sniper of last BTC Blood Season, you will likely need a limit order this time around,
Reasoning behind the level is simple,
1. Monthly Higher Time Frame Demand Zone
2. Break of Structure
3. -RTO-
4. Target Buy Level is inside Accumulation
5. Imbalance
6. Risk to Reward Prime for BIG Funds to Manipulate Price and Wreck Sellers.
Will be looking to take targets to premium level marked above,
Good Luck!~

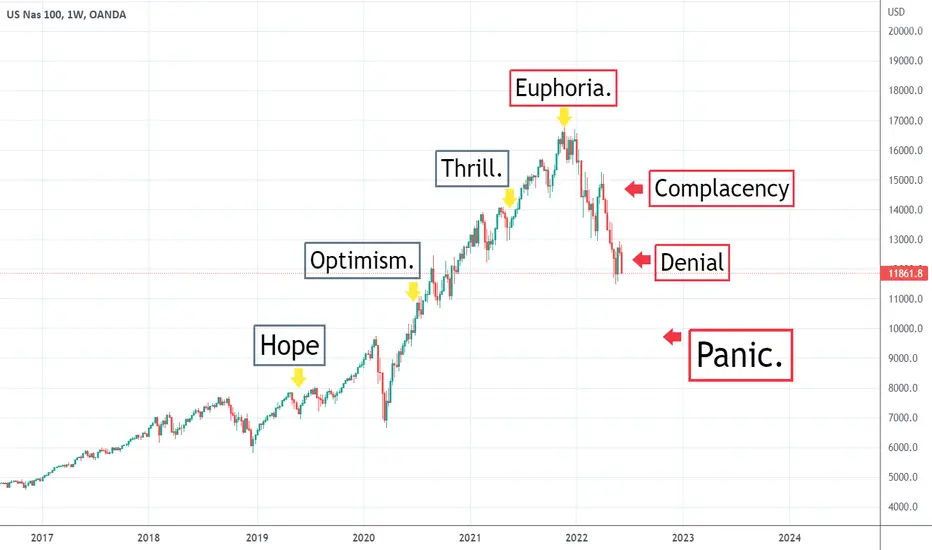
The great reset.The psychology of the stock market. As well as a prediction. Please follow and like for more. Predictions weekly on the stock market and the cryptocurrency market. OANDA:NAS100USD
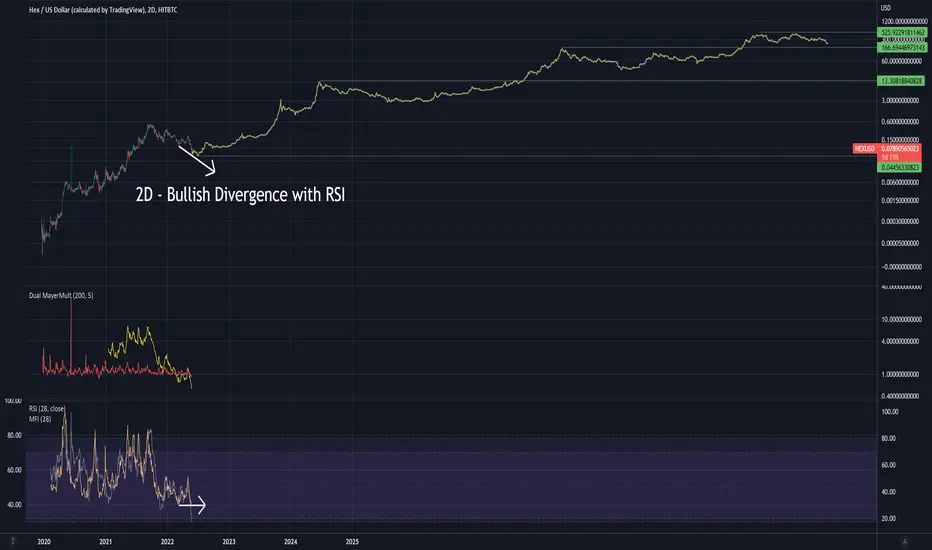
Hex overlaid with the BTC fractal - $500 Hex long term?Hex looks good for short term bears as you might be able to pick up Hex for around $0.04 in the short term as Rolexicans continue to exit out of their real asset (Hex) for plastic cars, plastic homes, and plastic women.
The Dual MayerMult yellow line being this low is a good sign the bears are getting weak. Bitcoin reached these same lows on the Dual MayerMult in the past in 2011 on the 2Day chart.
MFI is also bottomed out, a nice leading indicator that bulls are weakening.
We see bullish divergence with the RSI over the past few months, more signs of bears hybernating.
The real value of Hex comes with long term staking where you earn APY in the form of inflation of the Hex token which built into the contract code.
Note: I have to keep publishing this chart because TradingView screws with the log scale overlay in their database and my previous charts look messed up.
This is not Financial Advice. DYOR. I'm not your dad.
Contrarian Call Right Here. Optimal Bullish EntryThis is a typical bullish Wolve Wave that is on the final leg down currently. Expecting whipsaw reversal starting as soon as tomorrow, but main bullish price action will be around June 15 on the full moon (literally howl at the moon).
Expecting the yellow trajectory to play out and complete EW wave (5) around 430. The chart contains all the info you need to know, but there are a lot more dynamics at play here, mathematically/statistically, that have led me to feel highly confident about this.
- initial target is around 421-422, from there will retest ~415 and then make our way to 429-430
- the goal target is 448 by end of June ...and this makes sense with the confluence of wolve wave 1-4 projection and the ADX breakout "open long" target (stop loss 394)
- that DMI is low key bullish af, this is re-accumulation off the May 20 lows in 380s; stochastic RSI oversold and will give the escape velocity needed to reverse here and make explosive move to the upside
I'm playing the SPY June 17 411.00 calls and the June 27 429.00 calls, but this is not financial advice.
I am fully expecting the price to follow this yellow trajectory, so when you replay the bars at the end of June they'll perfectly coincide with this path, hah.
No Cap,
Prof. Lupin
