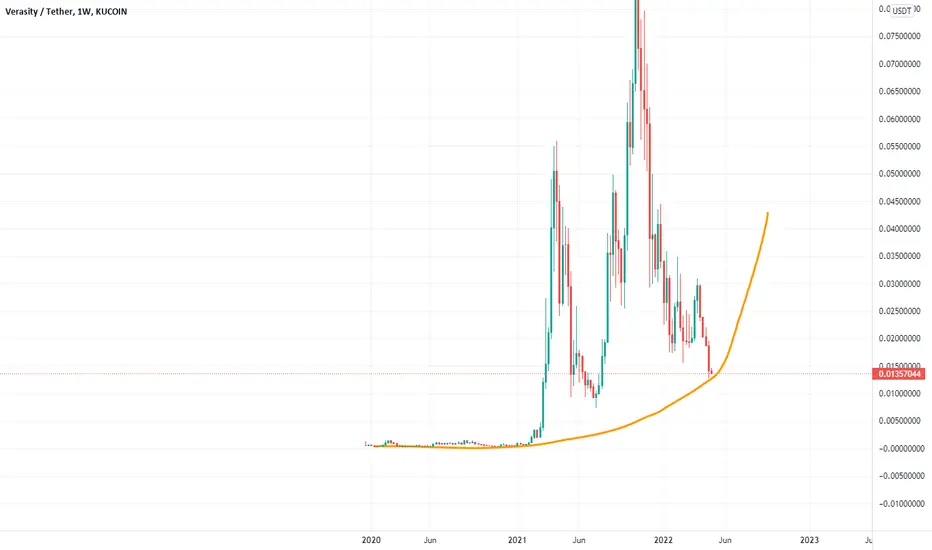
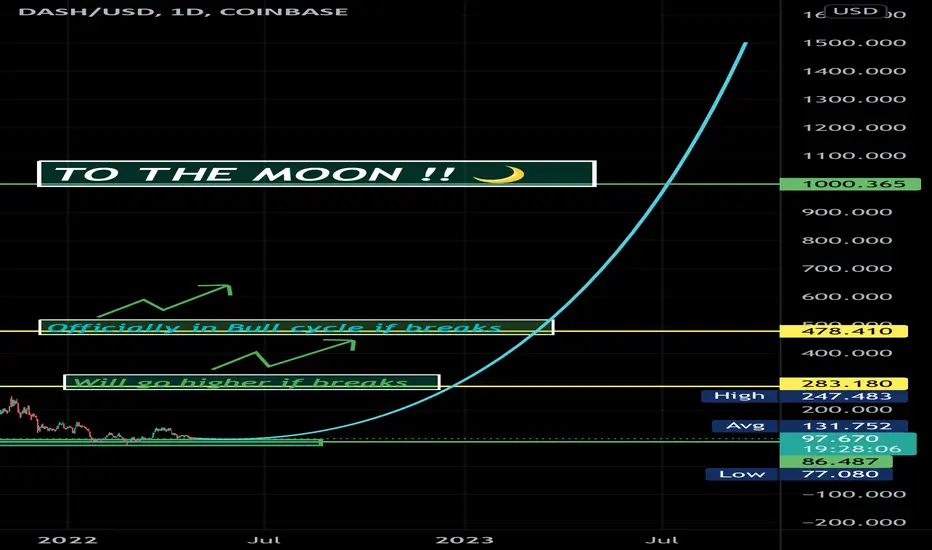
schitzo funzo, repost, nothing changed
Just a possible pattern detected, would funny if it played out but very low chance.
(Repost of may 7th chart with better thumbnail.)
Moon
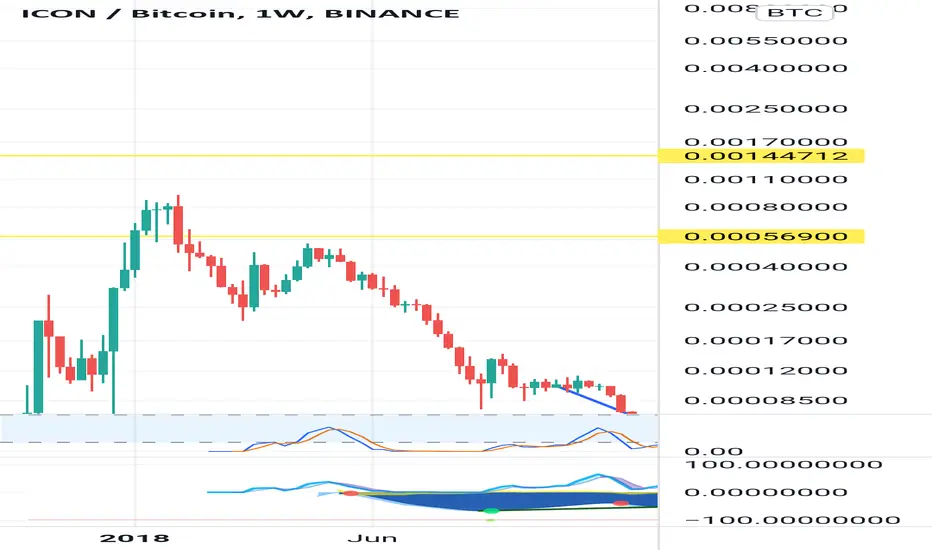
ICXBTC - Long term bullishnessHere u see the ICXBTC chart with resistances and big supports. This coin has been in the accumulation phase for ages creating Ws along the way. One it will break out most likely in 2023, and when it does that it can starts its parabolic rise up to its ATH marked in the pic. If by then btc reaches 100k to 200k this would means that ICXUSDT pair will reach 90-180usd based on this chart. I see a big Triple bottom playing out in the near future as u can see which also can form and inv HnS after the triple bottom breaks out. So bullishness on bullishness this coin will shock many people. I'd Dca in to this thing slowly this month and wait months before taking profits. NFA of course.
Bitcoin bears are in for a little surprise Hello my wonderful trading view family.
Great is the opportunity we have been given in this Cryptocurrency market.
This pattern minimum target is over 100K per Bitcoin.
How blessed we are to be sitting in front of such profitable market conditions.
Don't take it for granted, And definitely don't miss out on it due hesitation, Nature rewards courage (And God helps those who help themselves)
Not financial advice.
Stay Profitable.
- Dalin.

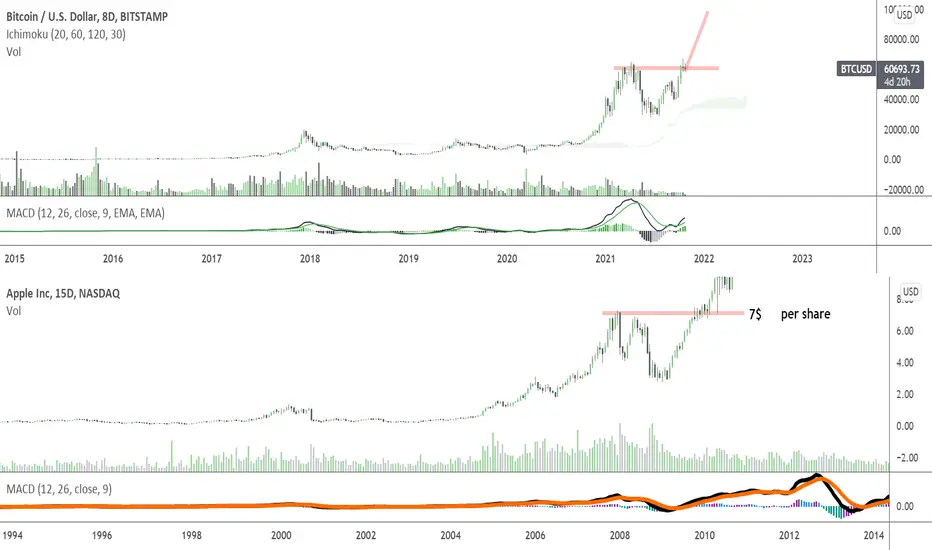
Apple computers and Bitcoin comparisonWhat's up my trading-view family!
Today I am sharing a fractal of apple when it was worth 7$ and Bitcoin today.
As you can see we have a clear corrective ABC structure on Bitcoin and Apple.
Apple recovered and went to $149 and is still pushing higher, The sky is the limit for Bitcoin.
This bull market is extremely profitable and only just getting started.
Stay profitable! (check my YT channel for a video update on this exact chart)
- Dalin
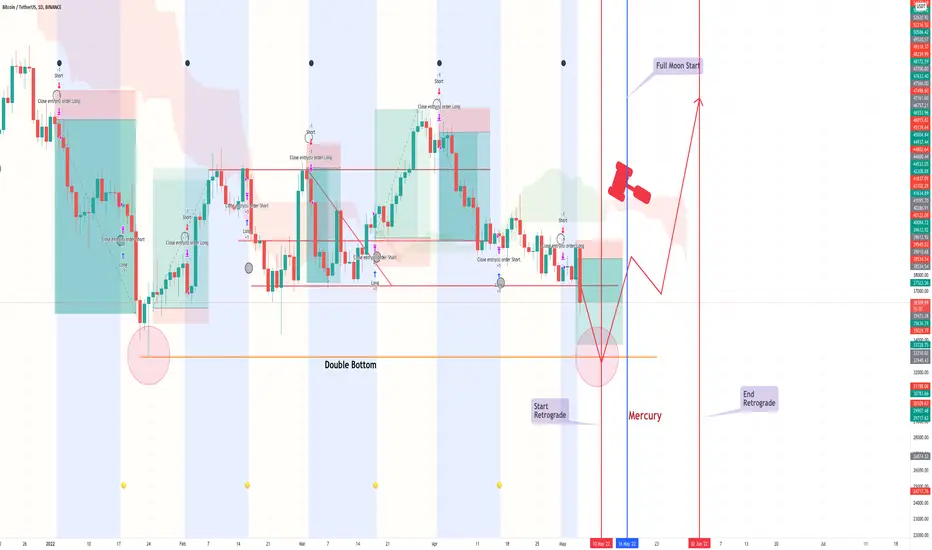
UPDATE 1 BTC New Moon ShortFollowing the sequence of new and full moon we can see that the two actually match. Now for our last new moon, the price has dropped following our theory. I'm expecting BTC to continue further down somewhere around 33k to a double bottom, which lines up perfectly with the next full moon, and the beginning of the Mercury retrograde.
I'm using the Mercury retrograde as another point of analysis, as the last one we had last year matched perfectly with bull-run that started in September. Let's see how this will play-out.
TNX in Cup & Handle - Breaking out - BullishThe TNX looks like it's been in a huge cup and handle pattern since early 2020. It also looks like the handle is breaking out and if the pattern plays out, we could see the TNX all the way up to 3%. That could put pressure on the precious metals, real estate, and the stock market. I think the Fed would have to intervene if we saw rates go that high.

ARE. YOU. READY ?!!Piñata day is soon.
In the end we will depict true enthusiasts and believers.
My beliefs strongly stay the same.
Follow my other posts to see my expectations and beliefs.
I knew this was coming.. just not so soon.
MAKE SURE YOU ARE ONE WITH THE PURPLE RING!!
D. R. S.
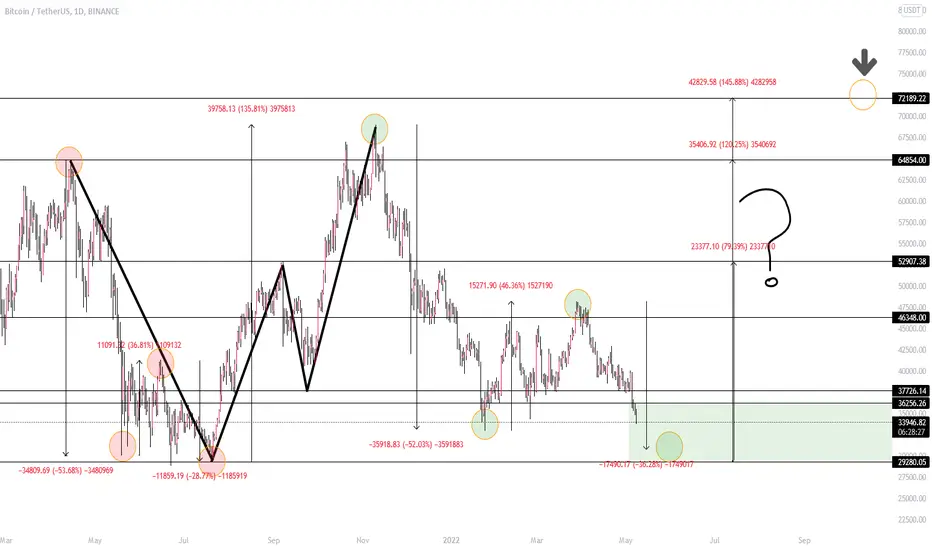
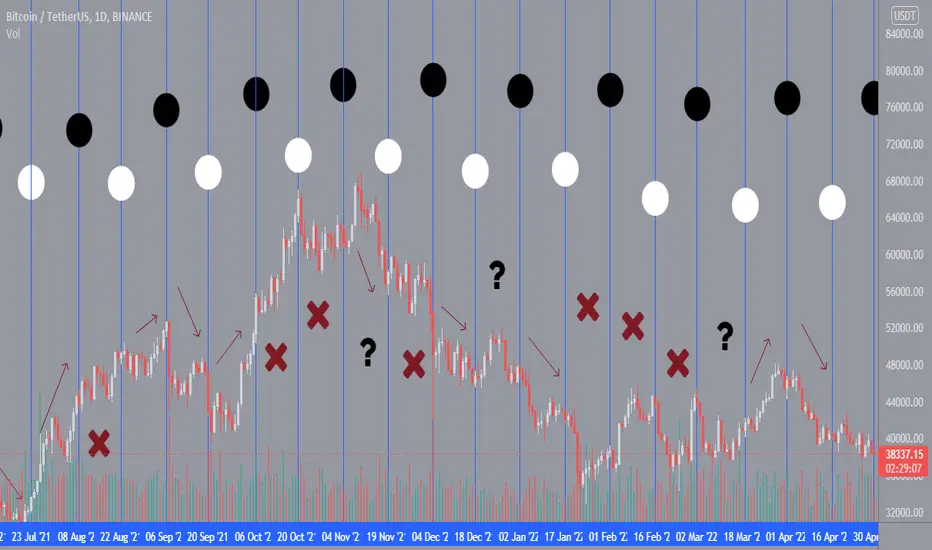
Moon cycles do not work.So according to some people, The moons are supposed to predict whether we go up or down, considering the phase, new moon down, full moon up.
This will illustrate the new or full moon cycles don't determine where Bitcoin will go.
Red X means inaccurate Call, and ? means questionable
The Case for Cardano to Drop to 50 cents Before BottomingCardano (ADA) has the potential to fall as low as $0.50. A major reason for this bearish scenario is ADA's descending channel, which the bears may try to tag again. This will be a classic break and retest price structure.
Descending Channel
A descending channel pattern has formed on ADA's daily chart, starting with the price falling from its all-time high of $3.09. The breakout to the upside has lost momentum, and now we have 3 bearish factors that align to call for more downside:
1. First, the bears have reclaimed the $1.00 psychological number after an initial failed rally.
2. Second, the RSI readings point lower as the oscillator is back below the 50 mid-level signaling bearish momentum.
3. Lastly, ADA's price is trading well below its 200-day simple moving average, which signals that we're in a bearish market.
Looking forward: The next major support to the downside comes near the current low of the year of $0.74. A daily break and close below this level will open up the door for ADA's price to test $0.50 and, subsequently, the upper slopping trendline of the descending channel.

VIX - start the rallyVIX has a hidden bearish divergence signaling a continuation in downtrend for the VIX which is a bullish signal in the SPY to back our theories!

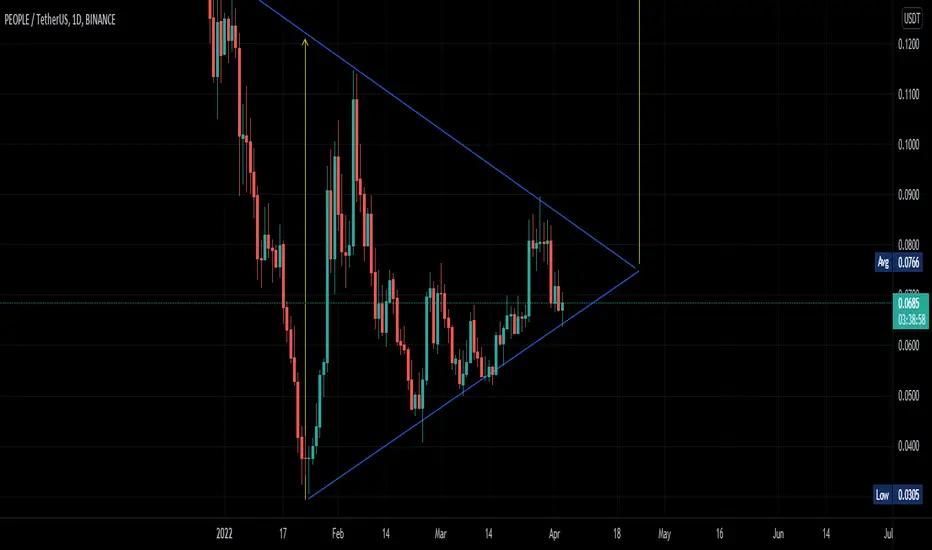
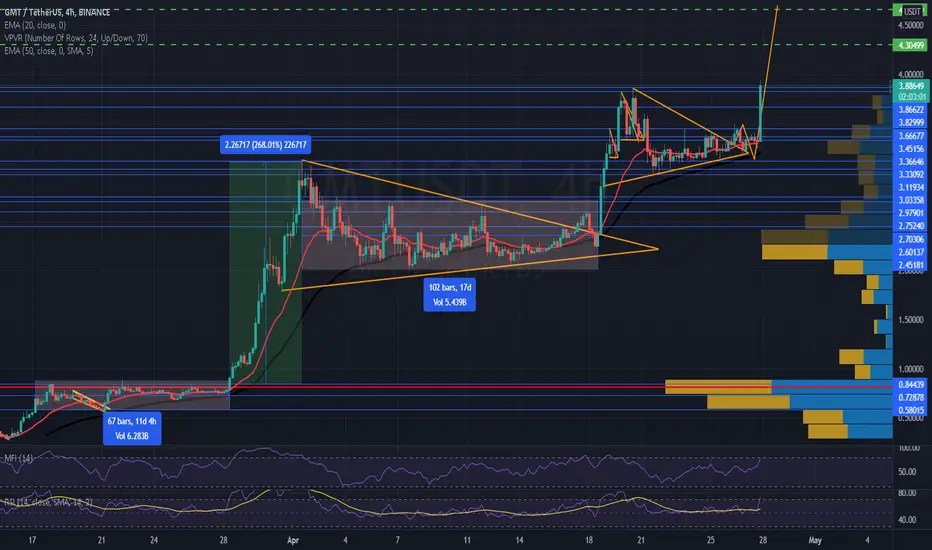
People can x3-3.6 in the next 2 weeksAfter a consolidation phase that lasted over a month, we can expect a strong upward movement in the next coming days.
Symmetrical triangle, higher lows, the chart says it all. (A couple of indicators are also bullish... MACD, bullish divergence and so on.)
It is not financial advice, only lines on a chart.
Get your bag ready (to go on vacation).
So, I could not display it on the chart but the target price would be around 0.2. This trade will take several days.
BULLISH RUN IS GOING If you miss the buy , buy it now and also in Coinbase too.
The green is screaming for the bulls and played the support very well and thanks to the meta share had been going on.
Bullish trend and big push up; watch any reversal happens.
Time to go to the moon
BTC Bulls ready?Lets see if btc can make it to 52k , I personally opened a long position. Trade safe!
Always DYOR no financial advice, watch out for scammers

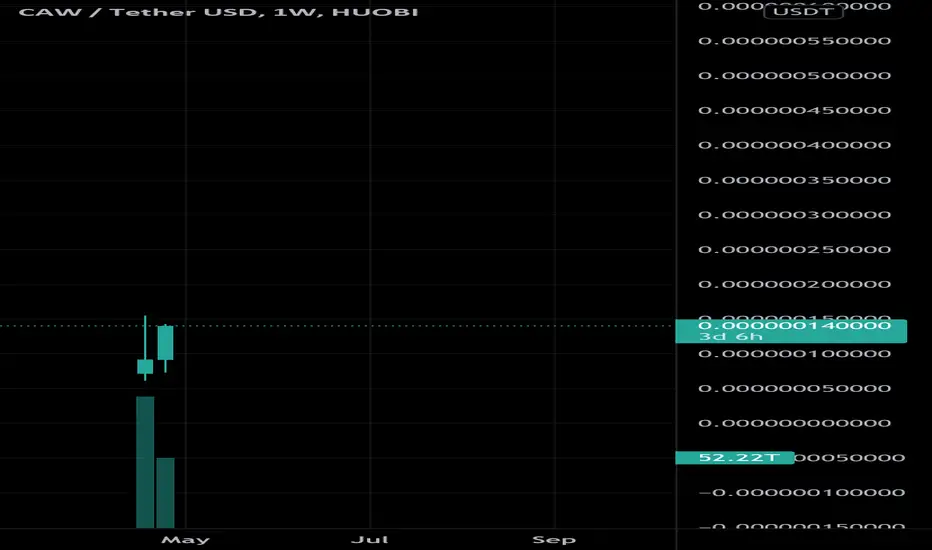
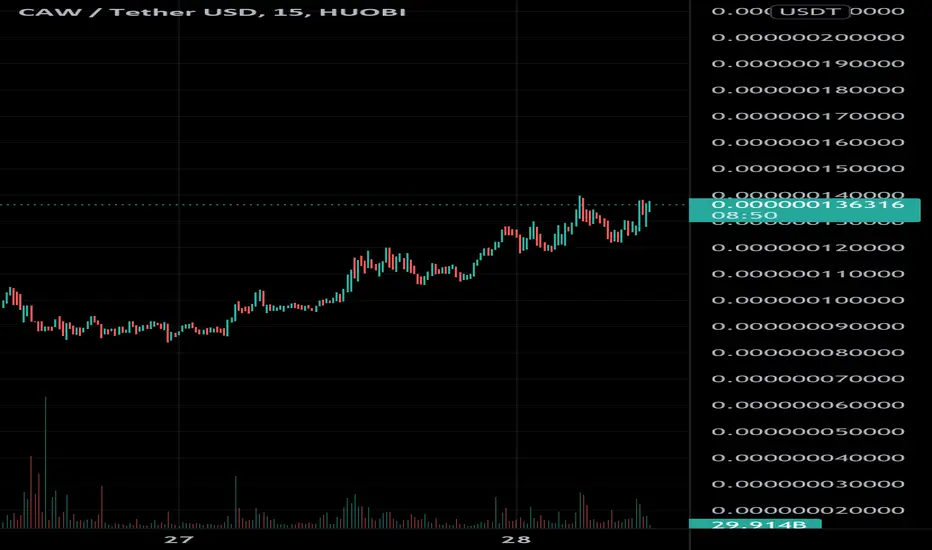
CAW/USDT Ready to moon! Backed by SHIBCaw/USDT is getting listed in a fast pace on many exchanges! Load up ur bagss before we takeoff. In my opinion this is a true moonshot. Always DYOR no financial advice
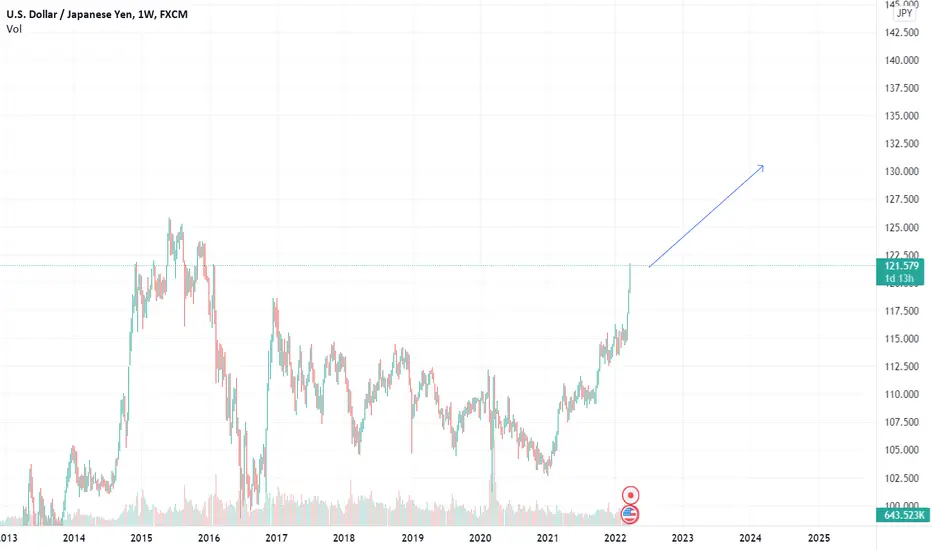
USD/JPY Long to the moonBank of Japan is continuing with very loose monetary policy to help the economy, because they are scared of recession. In the same time FED goes for tightening to fight inflation, they belief the economy is very strong and will be fine. Because of that Yen will become cheaper and USD will be more expensive in next months. USD/JPY will be 130+ by the end of the year, if BOJ and FED continue with their current monetary policies.
GMT to the moon! New ATHNews about the Listing GMT and GST on Coinbase give GMT enough Rocket fuel to fly to the moon!
-----------------------------------------------------------------------------------------------------------------
Please note that this is not a financial advice. Just my personal idea. Do your own research.
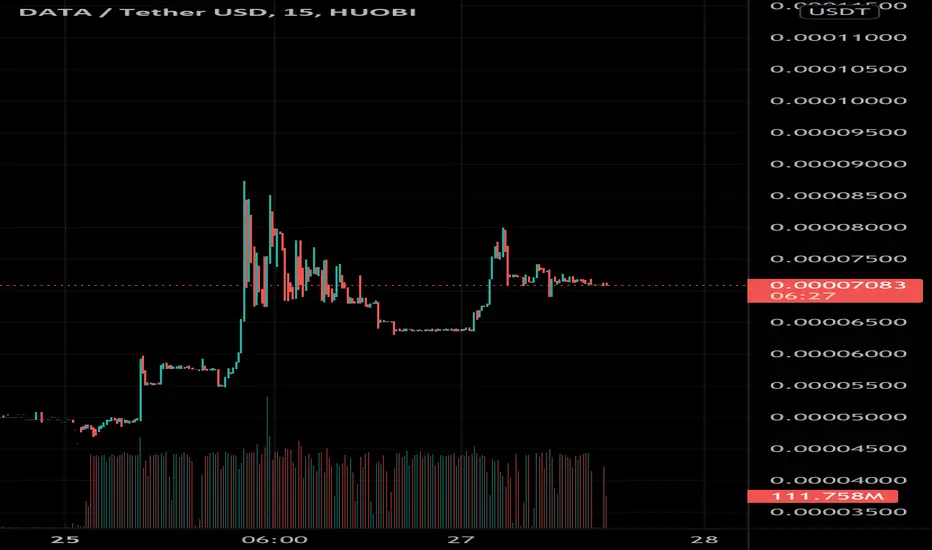
DTA/USDT ON HUOBI READY TO MOONPlease any updates on DTA are welcome. This token been in a downtrend and is 97% from its ATH. Last couple of days i see a lot of volume coming in. This could be a moonshot and am already invested
None of this is financial advice DYOR
Listen to this guyNothing is certaintly, but I think too probably we are near the bottom. Listen to this guy.

Small Cap alt coins trending, Doge Doge coin is has had a major pump from the positive announcement of Elon Musk acquiring Twitter. Elon Musk/Twitter has also told the press that implementation and integration of Doge into Twitter is a future possibility which therefore drives the price upwards.
Doge also has to take into account for the Bitcoin price changes which may cause the market to crash or may cause the cryptomarket to go into an alt-season.
To support this analysis and a bullish momentum of Doge does the MACD seeem bullish, as well as an opening of the KC. The RSI may be overbought as the red candle formed but the positive trend is still overarching.

2019 BTC vs 2022 BTC movementcompared both 2019 to 2022 with same time side by side. if its true then bull market should be coming very soon

AXS - The way to a breakoutHello trading friends,
Most markets are still into a downtrend - and there needs more time so that the most coins could get again green - but at the same time it's crypto and things could happen in the short term - one thing is sure - there is no guarantee for any price action.
Crypto markets did learn us, that today can be green and tomorrow red, and the same for another side.
So that's why it's important to trade only with a plan, and yes sometimes it's hard, but the try should be there at last.
Back to AXS - Why this chart
This chart view is purely dependent on price action including some TA trends.
We have seen before AXS did go with BTC, as 90% of coins do when there is a breakdown trend - but there is some things that make AXS very interesting, and I think some of the traders as you could see this also, or knowing already the effects of breakout in patterns as this.
is there a guarantee that AXS will show a huge breakout? sure no - it's crypto and all is possible, but in the world, like crypto, we depend on more chance. let's say what the markets show now depending on my expectations I see AXS increasing and having a breakout coming time - it's purely a view from different study trends.
There is in most time not always a reason to buy a coin directly - some known hedge funds use the way of % view. it means when a coin increases some % depending on their counting, the coin gets interested, and of course, there are more trading ways.
For me personally also interesting to see where AXS will go - and will follow to see the effects of it, and or it will prove that the trading study and the signals that it shows are real for a breakout.
Have a good time.
@ this is not trading advice - trade only depending on your setups.
