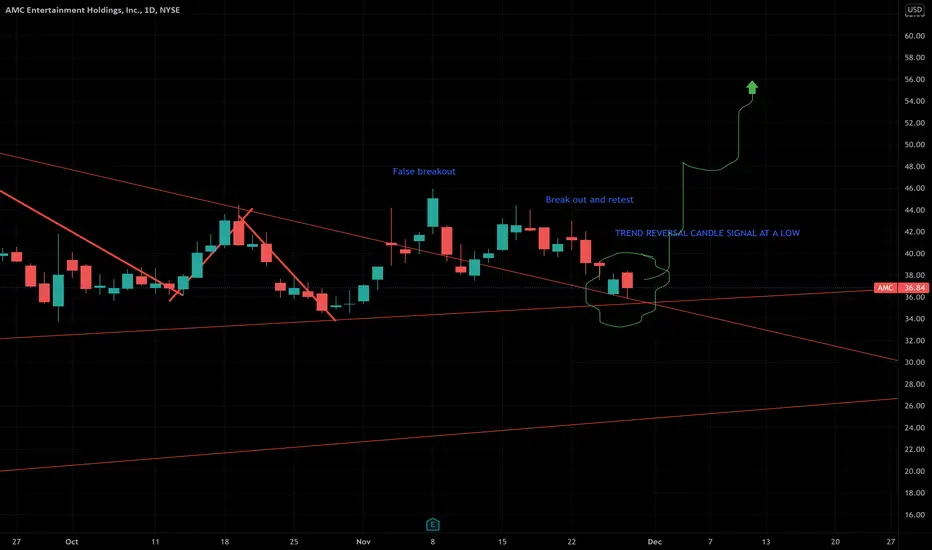
Amc chart analysis trending up soon?(A prediction)So i see a false breakout then a clear breakout and retest of the trend line on the daily chart of amc. It bounced on retest green Friday and printed a what i like to call a flip flop candle pair today. The flip flop is when the proceeding candle is either very very similar just different color or is its polar opposite but opened and close in the same range roughly as the candle previously. You’ll see what i mean in the picture. There used as trend continuation or trend reversal indicators. I am sure there’s a more accepted term for this setup. Besides that the daily rsi is showing a hidden bullish divergence. This is when the lows of the rsi are moving higher but the price action in the lows of the candles is moving down. This is a pretty decent indicator of a potential trend reversal. This divergence started to show itself last week so i would expect solid movement up but (potential down). If we do break upwards i would then be looking for volume to come in and match the movement of the stock price. If it doesn’t, i would expect another cycle and down trend after current uptrend and new analysis needed. With all the nft and crypto hype coming in and box office numbers returning the amount of preorder tickets for the movies coming out in December is crazy high with a crazy high amount of releases coming out in December i am very bullish on amc just from a technical view. NYSE:AMC
I am still learning so input would be nice. ur thoughts an opinions of my analysis are welcome. Sometimes you dont know you suck until someone tells you.
Moon
XTZ perfect Inverse Head & Shoulder breakout VERY IMMINENT! XTZ perfect Inverse Head & Shoulder breakout VERY IMMINENT! .. I got a strong buy signal and this is definitely something you don't want to miss out on. My measured move is the depth of this volume "reservoir". I expect nothing less than a 3x.

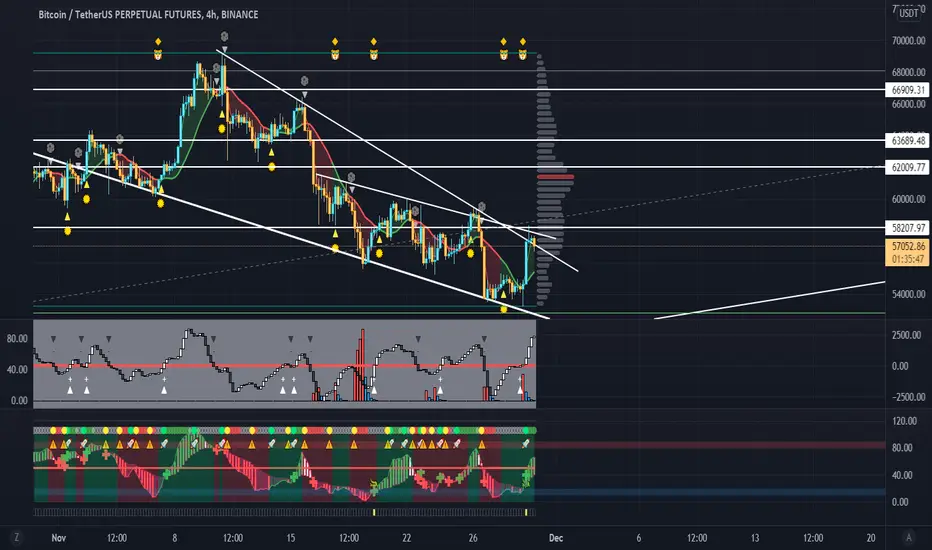
Bitcoin Bullish WedgeBINANCE:BTCUSDT
Leo Indicators 🦁
As mentioned in previous article, my indicators are signaling the whales are buying what retailers are selling, and the price did a rally on today. Now, BTC are has formed a bullish wedge, however it is struggling to breakout from it, a failed breakout will lead to a retest at level 53k-54k.
Try to re-enter your position there, or enter long position when we break recent high.
Congrats to whom has entered the position as soon as we shared!
NFT/USDT triangle Hello dear traders ! Apenft is fundamentally a huge project with exiting roadmap ! For technical analysis we can see how we bounced out of resistance and ready to finally break out and go the moon !

MANA/USDTbuy zone at after break out stop loss will be below 4.1$
sell target = 6.3 almost 28% profit
target # 2 = 6.9 almost 38% profit
target #3 = 7.7 almost 60% profit
plz like my idea becoz
May very happy when you like my idea.

ETH Still bullish on 1 week candle.ETH consolidated in this range its very bullish for him !
Give me like if you agree (-:


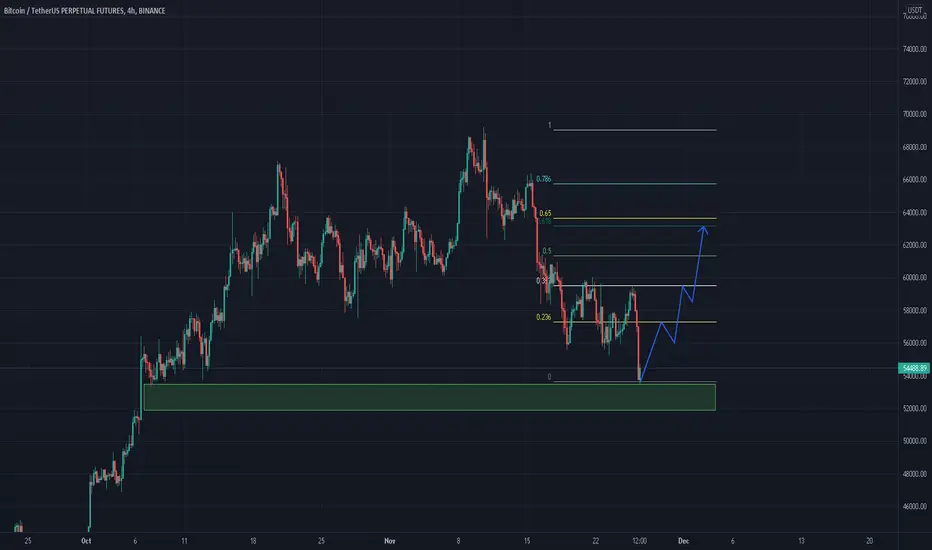
BTC Long Hello my friends, we hitted strongest support on 53k , now we see little pull back ! I believe it will continue to 60 000 + !
Give me like agree if you agree (-:
Shibusdt, long short long, quick channel playShibusdt, long short long, quick channel play for accumulation before it has to pump or dump. Within next couple days as chart trend lines indicate.
Rough-ish idea thrown together for your likes 😎😜

Ada to the moon !So we hitted strongest support and golden fib zone soo i think we will see big pump back !
Like if you agree (-:

You can double your money "Bella Protocol" BEL/USDTGreen support areas
Red resistance zones
Previously, an analysis of the "Sandbox" coin was published.
I made more than 200% profit
This deal is built on the same foundation

Seize the Metaverse Coins Renaissance Opportunity "Illuvium" ILVGreen support areas
Red resistance zones
Yellow zone area
Uptrend on big time frames
The number of coins displayed is limited and few
Currently the renaissance of Cryptocurrency that support metaverses
take the chance

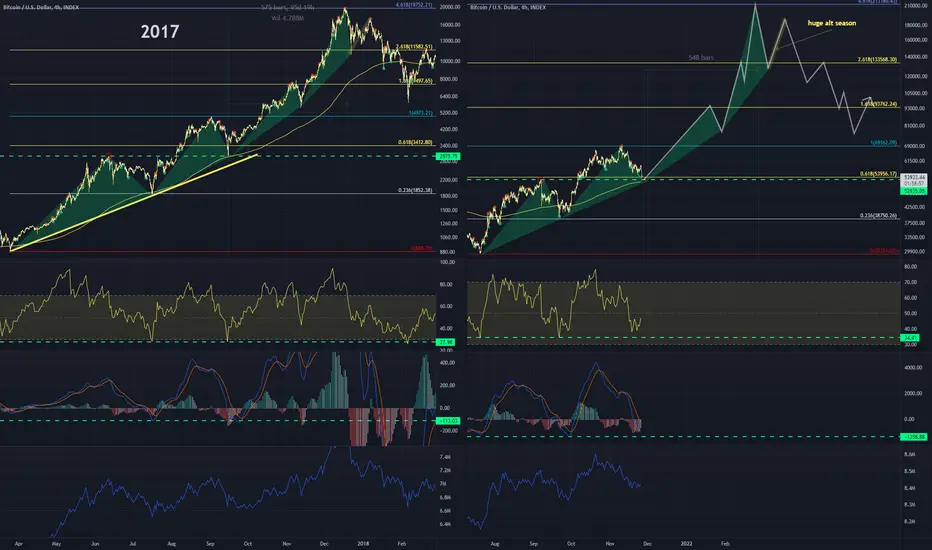
Recycled 2017 Run2017's price action bounced off its June peak. Are we going to bounce off the August peak? We're sitting on five similar characteristics :(1) diagonal trendline, (2) 0.618 fib level, & (3) 53k massive support level, (4) August peak, & (5) 150D EMA.
Timing was looking similar as well until November didn't perform as anticipated even those establishing a new high.
So, if history is any indication, we're looking at a lengthened cycle that'd extend into Feb-April of next year (so far).
I'm still bullish on reaching 200k+, but if we break 50k as a low here, using 2017's price action to predict our current cycle top may dissolve. Thus, I doubt we'll see below 50k at the moment... but as always, NO ONE KNOWS. So gamble responsibly :)
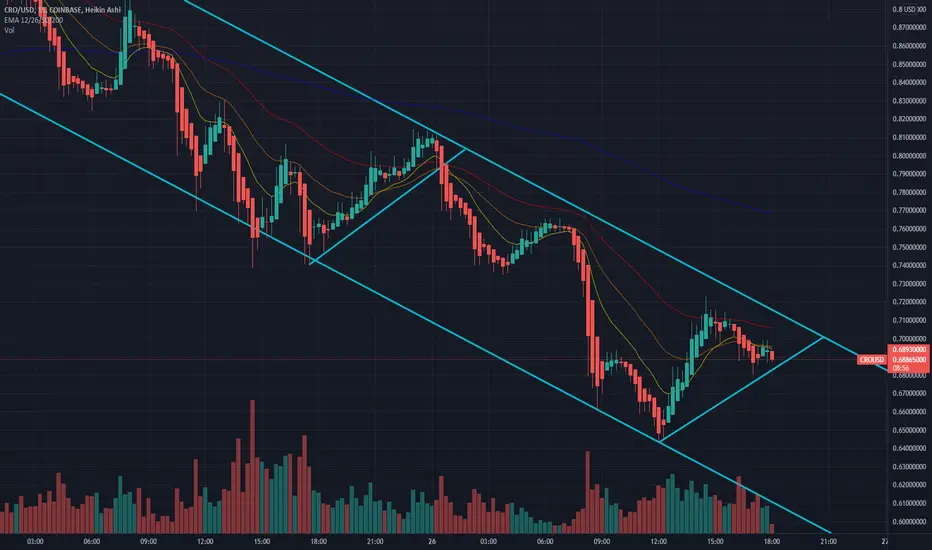
could see cro start to move againbeen in a downward tunnel for a bit but if i draw more lines the price goes up
we'll see
XRP TO MELT FACES 🚀 ZOOM OUT - YOUR PATIENCE WILL BE REWARDED!!We are just waiting for this week or next week. Might test the $0.92 levels but overall its bullish.
Need to break $1.13-$1.14, then 1.40 and then we begin climb to the moon $13.
Wait for the catalyst for moon launch (SEC, relisting in exchanges etc.)
"Let's just see what happens..."
"Patience is key...."

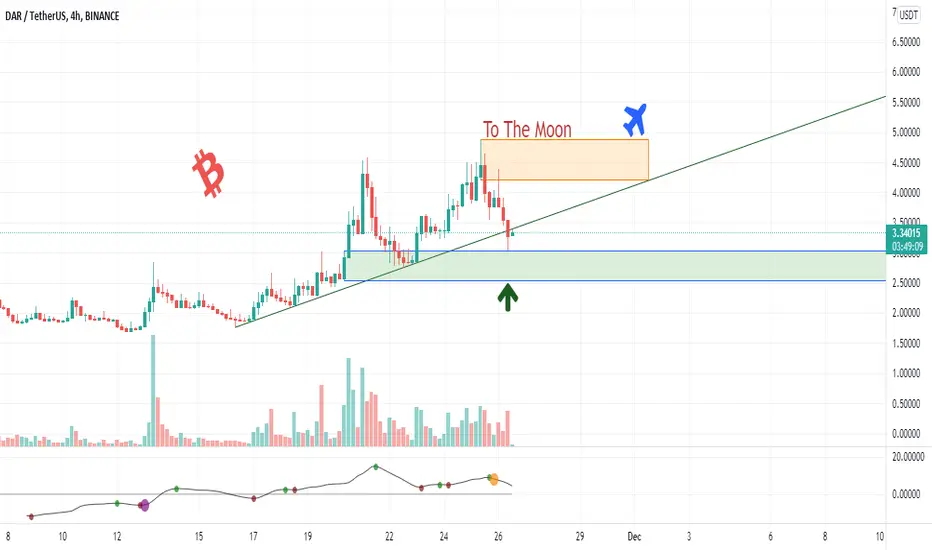
A good chance may go to The Moon "Mines of Dalarnia" DAR/USDTExcellent purchasing area within the blue zone
Stop loss below the blue area
If we break through the orange area and stabilize above it, we will go to the moon
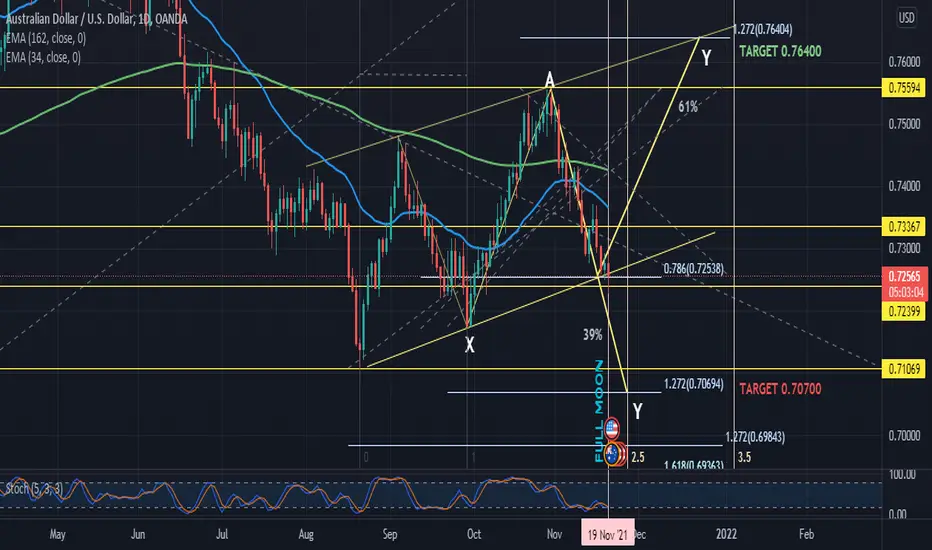
AUDUSD Alternative Scenario : Double DirectionToday is Full Moon >>> High Probability for AUDUSD to make turning point between November 19th untill 21th
61% AUDUSD will Bullish to reach the next target 0.76400
39% AUDUSD will Bearish to reach the next target 0.70700
Wait for Price Action to make a decision, market now likely wants to end it's flag pattern and perform a strong bearish trend if the flag pattern has been broken out with an impulsive red candle
Market can also make a false break on the lower trend line in the flag pattern, can develop a huge bullish movement until next New Moon
Strong Classic Support and Resistance had placed in the chart using a yellow horizontal line, where the market mostly respect to those level
Fibonacci Leve l has been plotted to the chart to make it easier to understand
0.786 is the most important level and will be our moment of truth what is the next price direction
1.272 External retracement is our next target for either bullish or bearish scenario
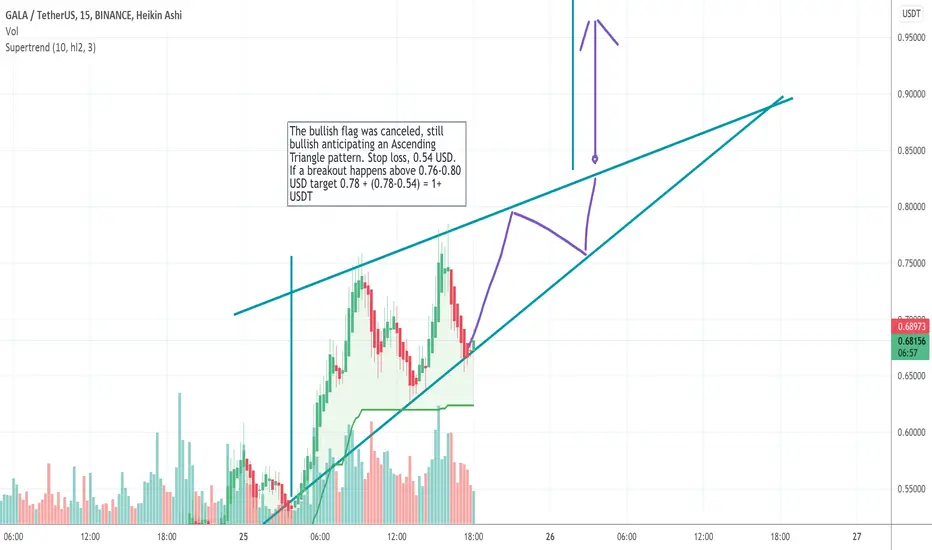
Gala - relook, a canceled Bullish flag what next, still hoddleGuys #Gala still looks good, I see an ascending pattern, a flat resistance around 0.76 to 0.78 USDT, if we see a breakout above that we can see 1 USDT soon. Gala can do a multifold rise, brace yourselves.
Time to go back up 🙌🙌🙌SHIB is now at its previous ath, being the previous resistance if it holds at this area it will make it the current support so now we wait for the the breakout confirmation and we goin positive
Lets goooooo to the moon 🌙

$LOVELYINY$LOVELYINU a shitcoin aka meme coin looking for massive upside 100-1000x ..Its just a shitcoin so dont invest money which you cant afford to lose

LIME (iMe) - moon shot, a project unknown to almost everyone!iMe (LIME) is a native messaging smart platform powered by Telegram with Crypto Wallet.
The current CoinMarketCap ranking is #2937, with a live market cap of not available.
20k Followers on Twitter (followed by some crypto influencers like: CryptoBirb, Zach Boychuk, Brad Laurie etc.)
22/6/2021 listed on CMC --> very young project.
Website: imem.app
It isn't something special but it is good start point. They should upgrade it with more information and plans.
What get my attention is sign "Powered by Telegram". We all know what is Telegram and how big it is.
Next, app is very good, similar to telegram but I like it more (it is based on Telegram + crypto modifications).
Partnerships announcements are made almost daily (check official telegram channel for more details, some of them: Binance Pay, NEO, CARTESI, TomoChain, Elrond, etc.).
Token is listed on few exchanges: Gate.io, Uniswap, PancakeSwap, ApeSwap, DODO BSC. As you can notice by now it is available on BSC so you don't need to pay big transaction fee if you are not able to buy larger positions.
Price pumped recently but M.Cap is still just around 15 million (telegram channel information). Another 10x for Telegram powered project is very possible if you ask me.
Little hype, some new listing, some crypto influencers traction and 100+ million M.Cap is very reachable.
I managed to buy it when it was around 0.018$, and I sold some to cover my investment at 0.20-0.26 region (obvious resistance level - first day trading close price).
I'm planning to load up even more again just under 0.618 fib. retracement level. If LIME close over 0.26$ I will increase my position (if wee don't see retracement to 0.618).
As next resistance and some profit taking I'm targeting 0.55$ area (430% from 0.618 and aprox. 2800% from early entry).
Zoom in for a better view of the breakout and accumulation region!
Keep in mind that this is very risky investment and manage your risk!
Good luck all!

GALA To the moon !Next round ! We go to the moon again ! Gala is very bullish bcs we broke resistance

XRP bullish (golden zone)We are on golden zone on FIB so i think we will see now beautiful pull back.
Give me like if you agree (-: Good luck my friends
