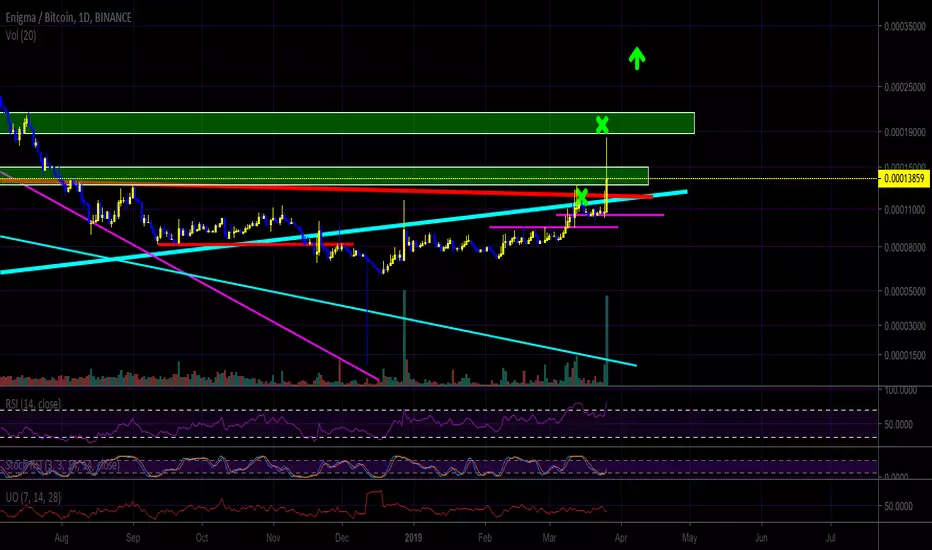
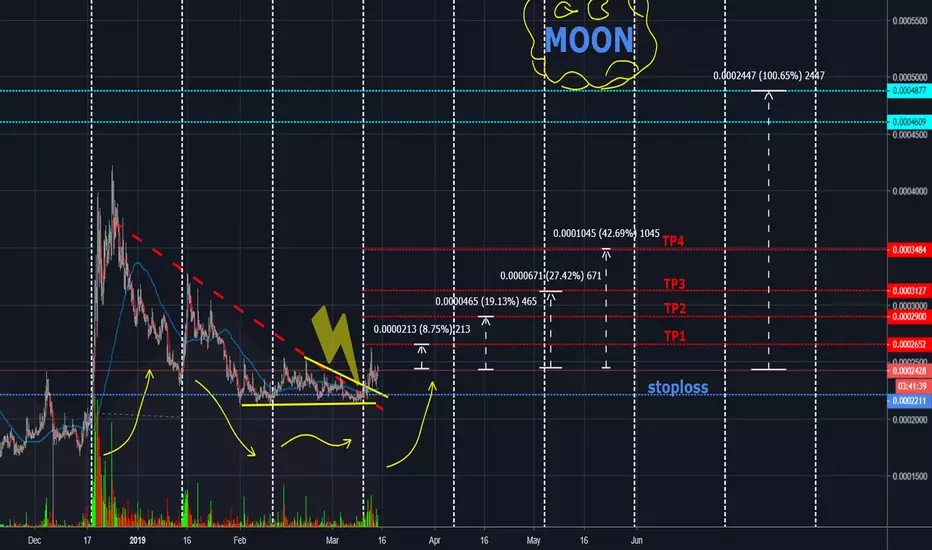
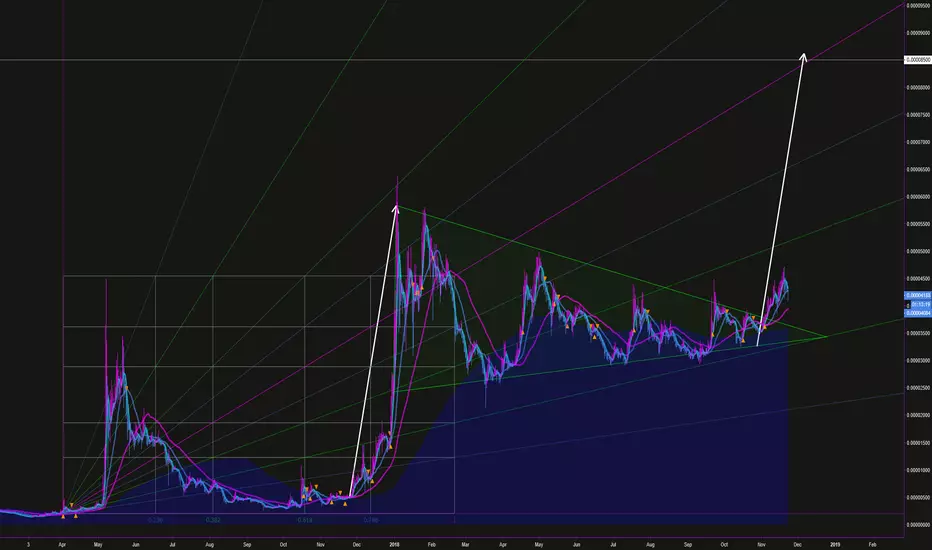
The Moonshot Was Staring At Me In The Face! (ENG)Well well well. After a bunch of flip-flopping, I somehow lucked out and managed to finally get back into ENG before today's rise. In my previous ENG analysis, I speculated that ENG could break back above its long term linear uptrend, and in doing so, produce a very powerful breakout towards the green zone. We hit my first target right on the money and have pulled back considerably. I'm much less of a short-term trader, and I tend to look at the mid-long term. Sometimes I swing trade, but that's about it. This breakout should be taken seriously. As long as ENG stays above the high 12000/low 13000 area today on increasing volume, it should be good to continue higher.
One of the reasons I got back into ENG was because I noticed how long it was consolidating, relatively flatly, on its ETH ratio. This signaled to me that once it broke out on the ratio, it would begin a bit of a bull cycle.
ENG/ETH chart shows clear attempt to break the range. We'll see if it can go higher:
As for what could happen next, we may need to first retest the broken resistance level, so one could try to buy between 12600 and 13600, aiming for another push higher. I guess we'll see. It might not get that low, or it could retrace the whole pump, but I'm betting on moving higher. My goal with this trade is to ride out a potential bull cycle for ENG, which could indeed put it much higher than it is now.
It doesn't have to play out in my favor, so caution is needed. This is not financial advice.
Previous ENG analysis:
-Victor Cobra
Moonshot
Down trend break TRX ( Possible 100%+) This is only my opinion about Tron. Please do your own research.
( Look at the flags)
We can expect the same as before. Maybe a big breakout.
The first big target is the last top : 0.00000820
possibly a nice breakout, Goodluck! :)

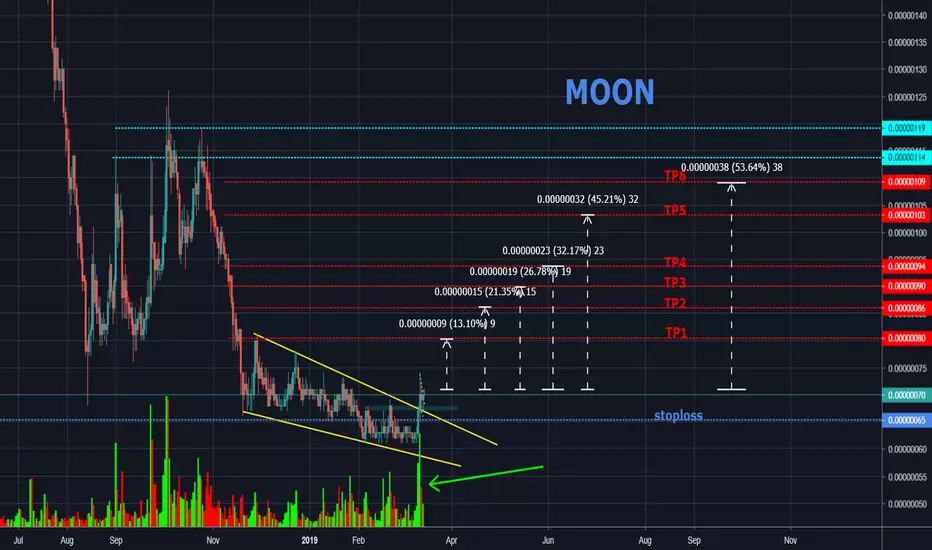
The Moonshot Quest Continues! (DGD)This is purely for fun. Sometimes I take myself too seriously when I'm trying to navigate my portfolio, but I really should stop doing that. No matter what you do, there will ALWAYS be a better trade. That said, I'm looking at a coin that is close to its all-time-low against Bitcoin. DGD was once worth over $500, I believe. RSI, ultimate oscillator, and stoch all look good, as well as the recent buying volume. The RSI does need to break this resistance area though, to confirm a breakout.
Right now, DGD has sneakily begun to break out of an inverse head and shoulders pattern (retesting the neckline as support), and if this has any merit, I expect a rather large pump. We could even go 100% up from here rather quickly. Another reason I put a small amount into DGD is that I think there is a possibility Bitcoin could drop here, and DGD has a history of having an inverse correlation with the rest of the market. Additionally, since a bunch of people are fearing a stock market recession again, people might bring back the "digitally backed gold" meme. So this is a small hedge, as well as a potential moonshot.
My previous moonshot attempt was DENT, but I failed to look deeper into the community, and found a very toxic environment. Even if that one rises, I just felt bad about it...so I got out at a small loss. That idea is linked at bottom, if you're curious.
Anyway, this does NOT have to play out. Just posting this for future reference. I may get out if the pattern fails to complete. I'll be watching for a potential break back down below the inverse head and shoulders neckline. This is for fun, and definitely not financial advice.
-Victor Cobra

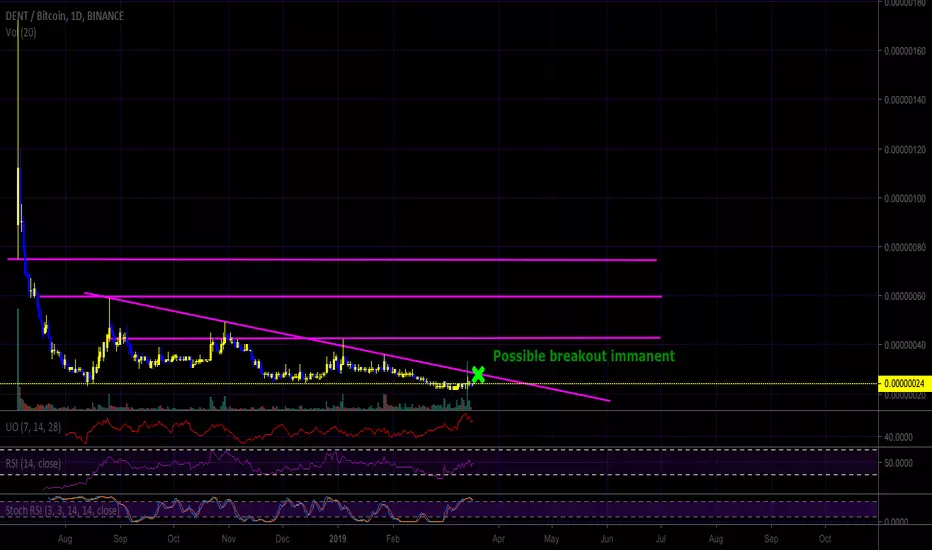
The Quest For a Moonshot - DENT Nearly 99% Down!Posting this quick chart for future reference in case it goes up. Taking a bit of a break during the week. Didn't know much about this coin until recently, but disrupting the telecom industry sounds like a pretty strong case for being bullish on DENT. Now, this is a risky play since we could still fall to the 18...or even 6 sat area. These low sat coins are hard to move because there aren't that many possible prices to choose from. This is a blessing and a curse. It's a blessing because they tend to gain in value quickly, since people see them as "cheap." The small numbers do play a psychological role in our perception. It's a curse though because you can get stuck in these for a while (think HOT, BTT, NPXS). It's hard to get your order filled.
Anyway, I'm fairly convinced we've seen the bottom on DENT because of the volume on our recent rise. A similar pump and then retrace happened when XLM reached its recent bottom. I decided to get out of ENG and put my "moonshot" money on DENT for now. Yes, ENG could indeed go parabolic soon, but I'm betting on DENT yielding higher returns overall. It's also the only promising crypto I've looked at that is THIS far down from its ATH, both in Bitcoin value and in USD value. Just look at coinmarketcap: coinmarketcap.com
I bought at 24 sats, but confirmation would be a move beyond 30, breaking the descending resistance. All potential resistances are in pink on this chart. Perhaps a retest of 22 is also in the cards. This is one of the few alts that has only recently hit a lower low, so I see this as a good opportunity.
This is not financial advice. Totally speculative, and as I said, there is some risk involved. As I said earlier today, I probably won't be posting much this week. I need a break, and this was a coin I felt comfortable putting some funds into. Regardless of whether or not we've seen bottom (my bias is that we have), I feel like I've done a very good job analyzing the market of late, at least day to day. Not that I need to quit while I'm ahead, but I think I want to step back for a bit. Good luck guys!
-Victor Cobra
SC out of the long falling wedge!Sia was forming the falling wedge for 110 days! Currently is SC out of the pattern. Price Action re-tested broken trendline and strong support and it´s ready on interesting pump.
BUY NOW: 71 sats.
STOP: 65 sats.
Targets are on the chart.
Good luck to everybody.
STRATIS pump is around the corner!!Get some stratis on binance.
Buy now: around current price
Stoploss and targets are on the chart.
Good luck to everybody.
TRX BTC Momentum AnalysisUsing fibonacci fans to indicate support and resistance. i expect to see some very bullish momentum in mid january 2019 to mid february, but i expect the price will bounce around in the 340 - 380 satoshi level untill mid december 2018. If the price were to break below the support currently located around the 300 satoshi level then this would decrease the likeliness of a bullish rally in the new year.
Not financial advise.
Biffy
ADABTC GOLDEN CROSS SOON ADABTC now is situated into a fwedge which will break upward soon,We have a very good 3D MA support,stochastic is going upward ,RSI is bullish because we are above 50 and also the BUY momentum still coming
Target of this wedge is at 1360 sats
Many news will come like:-Cardano 1.5 Mainnet,Ourboros hardfork,Shelley testnet-Shelley mainnet and ledger integration.The price will go up hard.After we will pass 1360 sats we will going to 1930-1988 .Good luck

AION/BTC (Bought a bag) LONG/SWINGSimple Crypto Strategy: Find Accumulation...Buy the All Time Low...Sell the Top.

FLO BTC Momentum AnalysisFLO BTC is showing a shift in momentum, as it broke out of the final leg of the decending fibonacci fan, signalling bearish exhaustion in December 2018. We also saw a double bottom formation in this area, flowed by a bullish reversal. As the momentum has now shifted i expect the bullish trend to continue, though we may see a correction on the smaller timeframes subject to the volitility swings of bitcoin and the crypto market as a whole.
My perspective on this is that, if FLO BTC can break above the 2000 satoshi level, then the chances of it reaching the higher fibonacci levels would greatly increase. However, entering a long position at the current price, 1850 satoshis, could be risky due to this area being a resistance zone, with the support levels located below at 1400, 1100 and 1000 satoshis. It is at these levels, I would look for a bullish candle, on the local timeframe, to enter a long position.
Not an expert, not financial advice.
Biffy.
STRATBTC Momentum AnalysisI beleive that the bearish momentum has now been exhausted, and a bullish reversal is likely because the macro level analysis of STRAT BTC shows a clear parabolic, bullish move, followed by a consolidation trend, down to the 0.0002 satoshi level. The 0.0002 satoshi level would be my ideal entry point, however on the smaller time resolutions there are also some local support zones which could be used. A close below 0.0002 satoshis could also indicate that the bearish trend is not yet over, i would be very cautious entering a long below that zone.
Not an expert, not financial advice.
Biffy

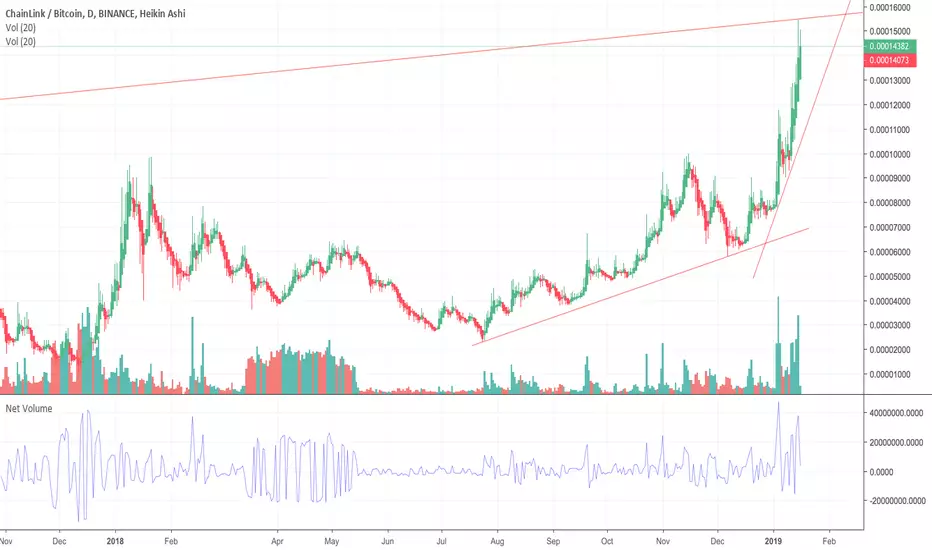
Bull runs on Chain Link!0.000157BTC: if touched, massive bull run and possible hit on 1BTC!!
Order book of selling position on OKEX are unbelievable!! Watch close this crypto. Fucking moonshot
Went to 0.003 BTC and is goin to BTC. WATCH CLOSSEEEEEEEEEEEEEEEEEEEEEER
WAVES Breakout PlanHigh rish high reward setup in play for WAVES at the moment. Having recently had an 80% rally we can see that a correction is ongoing, i'm looking for entry zones where I would enter a long position, if I see a reversal sign in the zone. The stop line on the chart could be raised to the ascending 0.236 fibonacci line (in blue) if WAVES breaks above the resistance line at 0.00045 satoshis.
Not an expert, not financial advise, just recording my ideas for my own development.
Feedback and corroboration welcome.
Biffy

XLM Huge Pennant UpdateXLM doing very well so far after it's breakout of the pennant formation, i expect the bullish momentum to continue, the fibonacci fan can be used for selling targets if we see a huge rally as a consequence of the breakout.
In the short term, the 4000 satoshi level should act as a good support for accumulation, but it is possible that we may see a correction down to the 3500 levels if the market conditions worsen.
The target is pretty speculative, i dont expect the price to head straight there but I beleive it is very possible.
Biffy
Check out my open scripts here: tradingview.sweetlogin.com
Feedback and collaoration is welcome!
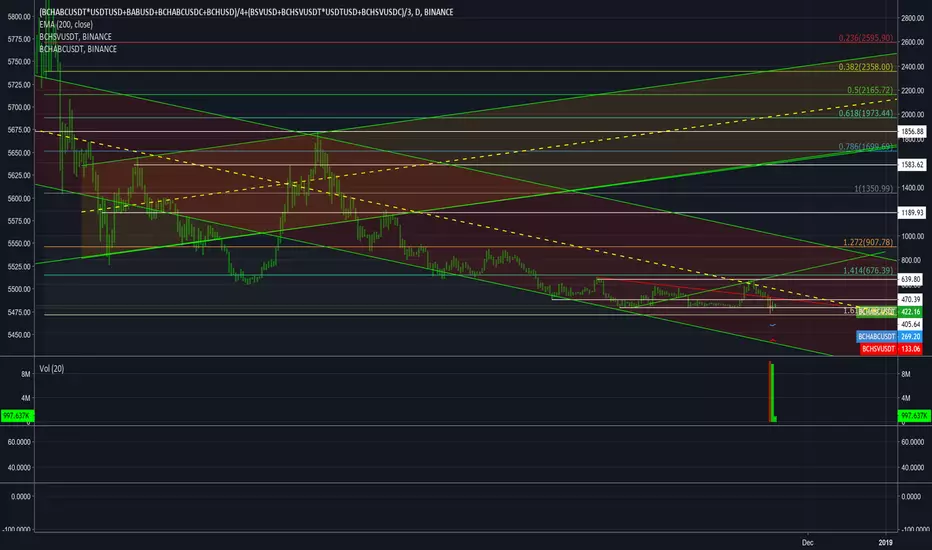
BCH fork action appended to pre-fork dataThe price action for this chart is defined by the average of BCHABC across 4 exchanges(Poloniex, Bitfinex, Binance, and Bitstamp) added to the average of BCHSV across 3 exchanges(Bitfinex, Binance, and Poloniex). I copied the pre-fork price action from BCHUSD @ bithumb(where BCHABC is currently trading at about a $150 premium), appended it to this chart and meticulously lined up several key swing highs and swing lows so I could do some somewhat accurate analysis on the chart. In hindsight, I should have used a vertical line to make sure I didn't mess up the horizontal scale as I was adjusting the pre-fork data to fit correctly.
Personally, I'm bullish on BCHABC and bearish on BCHSV. If one considers the possibility of BCH technically being the original chain of bitcoin as NIST claims, in my opinion it's easy to understand why this fork was so important and why it seemed to have had such an impact on the crypto market as a whole. My bullishness on BTC in the short-term is currently somewhat dependent on BCHABC continuing to win the battle. To make the chart a lot more interesting, I've overlaid the individual prices of BCHABC and BCHSV. It will be quite interesting(to me) to see BCHABC at binance react to the TA from this chart...
Bitcoin's latest bear trap hit the downtrend line on my falling wedge perfectly, currently bouncing right off(see the related "personalized bitcoin index" chart and press play)...
Note: As with my related chart I just mentioned, in this version, I sacrifice accuracy of the volume indicator to get a slightly more accurate price reading, correcting the average price against any movement of USDT/USD at Kraken. In a couple weeks or so after Coinbase finally stops holding the coins hostage and the dust settles, I'll follow it up with another one with a more accurate volume indicator that will either disregard USDT pairs altogether or otherwise not worry about what happens with USDT.
Current formula: (BINANCE:BCHABCUSDT*KRAKEN:USDTUSD+BITFINEX:BABUSD+POLONIEX:BCHABCUSDC+BITSTAMP:BCHUSD)/4+(BITFINEX:BSVUSD+BINANCE:BCHSVUSDT*KRAKEN:USDTUSD+POLONIEX:BCHSVUSDC)/3
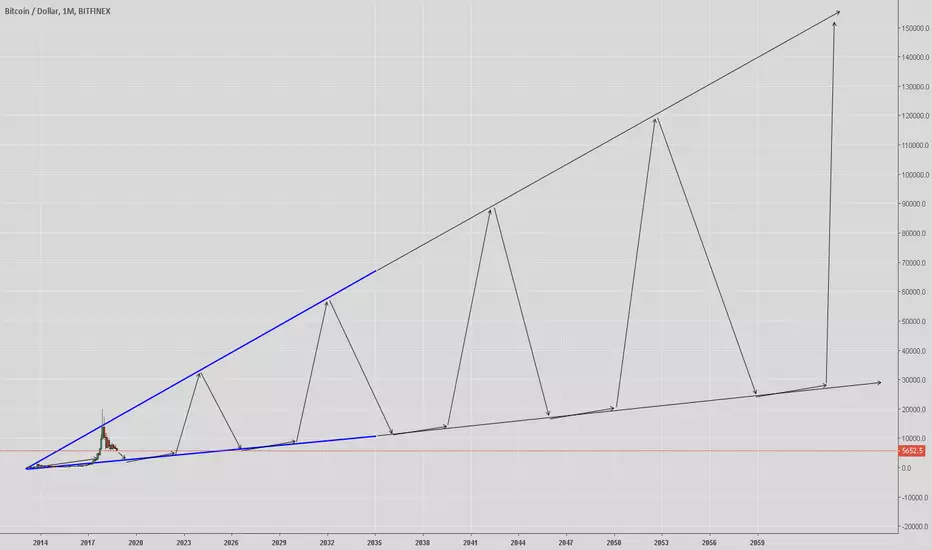
Long Term Bitcoin Prediction.$BTCUSDJust for fun, will Bitcoin be the longest and biggest pump and dump in history? Or will it shoot to the moon and go to 10million per coin? Leave your comments below!
My personalized bitcoin index (factoring in USDT fluctuations)It averages the price across 9 exchanges, while calculating the actual USD value of bitcoin in USDT markets by multiplying the respective exchange rates by the value of USDT according to Kraken.
Here's the formula for the chart in case anyone wants to use it themselves: (COINBASE:BTCUSD+BITSTAMP:BTCUSD+GEMINI:BTCUSD+POLONIEX:BTCUSDT*KRAKEN:USDTUSD+BITFINEX:BTCUSD*KRAKEN:USDTUSD+BINANCE:BTCUSDT*KRAKEN:USDTUSD+BITTREX:BTCUSDT*KRAKEN:USDTUSD+OKCOIN:BTCUSD+HITBTC:BTCUSD)/9
See related ideas(or find me on twitter/facebook/steemit) for more reasons why I'm so bullish.
The chart should pretty much speak for itself, breakout of a falling wedge...

Two 4 two?Two days in a row we could see a higher move from an inverse H&S pattern. Combine inverse H&S with a cup and handle and I'm just waiting for the whales because I'm sure they saw it first.

Ready, Steady, Go!Broke out the golden trend line and retested the resistance at convergence of fib 0.5 level and has painted a confirmed reversal candle as the next move builds. Early formation is similar to the previous small set of waves before the large thrust upward. Get on board before take off!

BINANCE:XVGBTC bottom of a 3 month cycle long positionthis is not trading advise do your own research BINANCE:XVGBTC what i have found on this chart is a simple look at market cycles. this can potentially be a good buying opportunity. the verge community is strong multiple 51% attacks and just all around bad news does not seam to affect this like many other coins i got into xvg before it last took off know when to take your profits this is key from a beginner gotten burned many a times. on the daily price is back to the last low before we pumped if the bulls can take the market back i feel we will see a good jump here as for the oscillators the RSI is showing oversold witch can mean we are in for more down side movement our Macd levels are looking prime for a break out in either direction as well as very tight bollinger bands forming on the daily also looks like momentum is picking up wait for conformation of break out above red resistance line for a buy if your in allready might think about selling if green support line is broken all things considered trade at you own risk hope i could help happy to see comments on the chart any good criticism is welcomed im here to learn and make money right

Bitcoin reversal 8900 and down to 7200 HODL IF LOSESee Sp500 index, indentic history
Trading HARD VERY

Sleeping GiantBancor is a network that lets users convert between two tokens like an exchange. The network lets you convert between two tokens of your choice without any counterparty. You can do this while taking advantage of an automatically calculated price. The system also incorporates built-in liquidity for added convenience. I don't think many have realized the potential of this project, they have a currently working product and have been rolling out a lot of partnerships. I have marked my entry, sorry I didn't tell you all sooner. I'll be holding this one for a while and will look to add on dips.
Those big wicks up really scream accumulation to me!

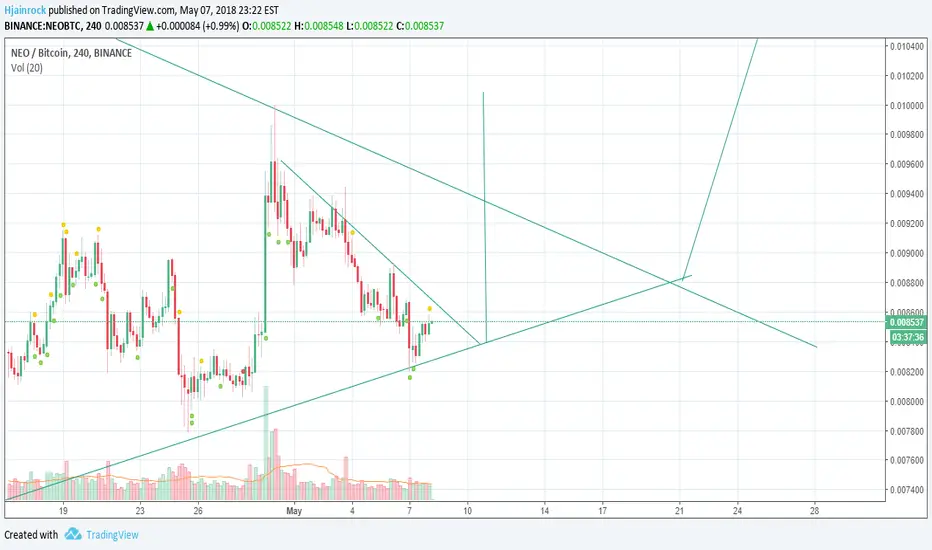
Neo boom soon!!! (2X POTENTIAL)#NEO
BUY - 0.008-0.0083
SELL- 0.0089*0.0095-0.01-0.018-0.02
(2X POTENTIAL FOR MID/LONG TERM)