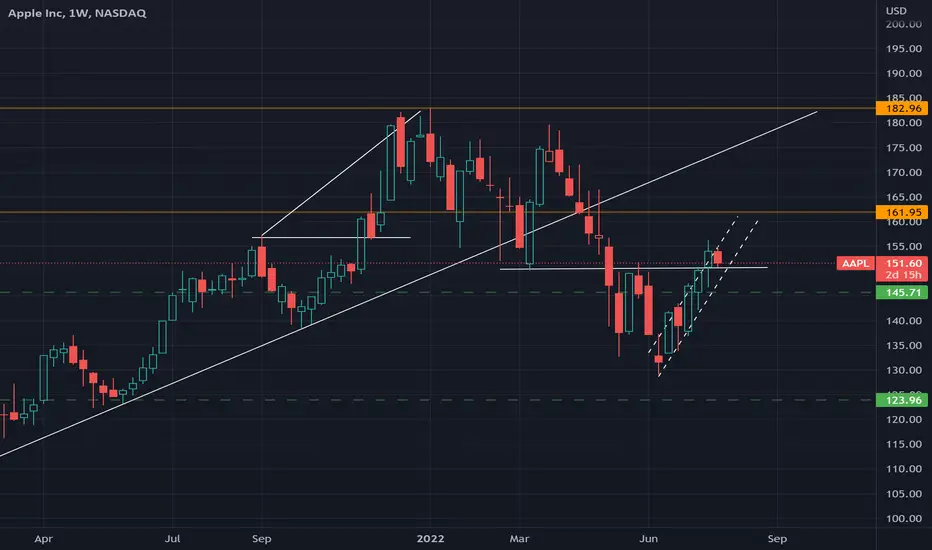
$APPl MORNING STAR PATTERN Appl weekly chart is showing a morning star pattern. However, I expect a minor pull back as the daily chart shows an inverse head and shoulder, of which will lead a rally towards 52ath. jus an idea
Morning Star
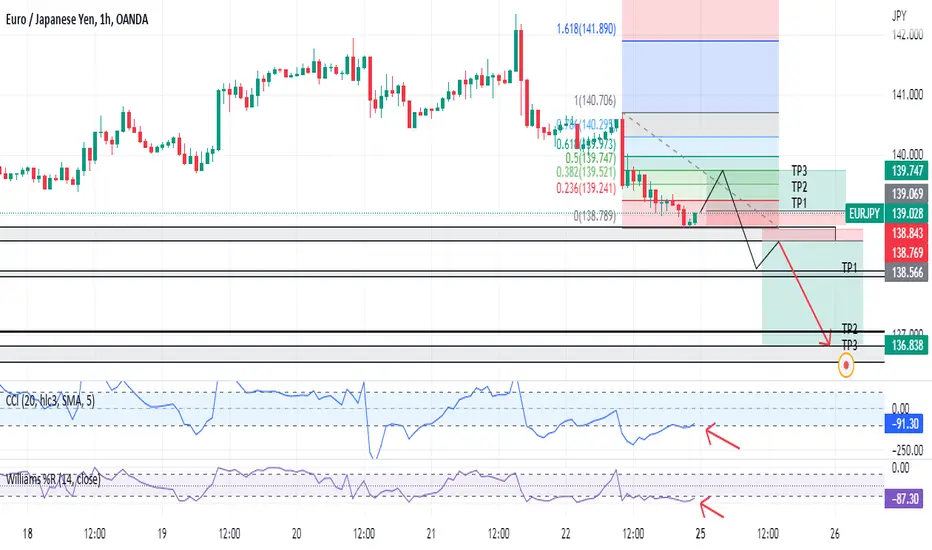
EURJPY CASE STUDY: FIBONACCI RETRACEMENT+SUPPORT/RESISTANCE ZONEThe scenario for EURJPY on H1 timeframe could be as following:
1- Retracing from a support after a morning star pattern (bullish pattern) and CCI / %R being oversold suggesting a return to the normal zone, with a buy order being put after the new candle making a wick down and breaking the high of the current one. Targets are set according to Fibonacci lvevls;
2- If the price respects the down trend, we should expect a break of the support after the retracement;
3- Now the perfect scenario would be to wait until a retest of the support to take our sell order, with targets beimg put at major levels.
Put your stop losses according to your risk management plan.
If you have any questions I will be more than happy to answer them in the comments...
Morning star with 40 % gain in short period Morning star formed on monthly chart
Graph looking to give upside move of 40 % in this bear market also , with high volume and large buying pressure buy stock

PETRONET has retested , and showing BULLISH movement hey guys ,
PETRONET stock has shown signs of bullish movement
this stock was moving in a fixed downtrend ,
and first also ,
this stock has crossed it's resistance ,
but was not able to stand there for a long time ,
and it lead to BULL TRAP for traders ,
and after that ,
this stock has again crossed it's resistance,
and now retested.
There are several reasons to buy this stock ;
1. A LONG GREEN CANDLE IS MADE
2. THIS STOCK HAS RETESTED AND TAKEN SUPPORT ON IT'S RESISTANCE
3. MORNING STAR HAS BEEN MADE BY THIS STOCK
due to these reasons ,
i suggest you to buy this stock and earn high returns ,
I have marked the TARGET and STOP LOSS for y'all,
the RISKREWARD RATIO is 1:3
BUT PLS CONSIDER THE GLOBAL MARKET SITUATIONS;
1. INFLATION
2. WAR
3. RISING BANK RATES
4. INCREASED EXPORT DUTY ON CRUDE OIL
AFTER CONSIDERING THESE SITUATIONS
YOU CAN BUY THIS STOCK
PETRONET
😀😀

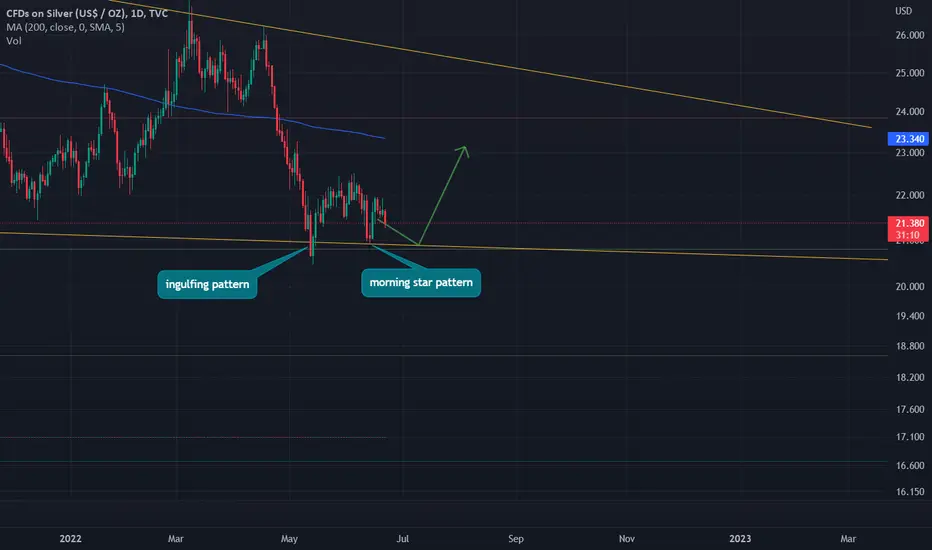
Silver CFD Analyzehello everyone
i think we reach to 38.2% fibo level and also a trendline.
we see two candlestick patterns too.
one bullish engulfing pattern
and one morning star pattern.
so maybe we could grow to 200MA and then correct again.
if you open a position dont forget too set your SL under this trendline
and early bottom u see in chart.
(!!!NOTE!!!
my posts are just my own opinion and you must trade and invest in your own strategy.
be careful and protect your capital first.)
thank you all for your supports
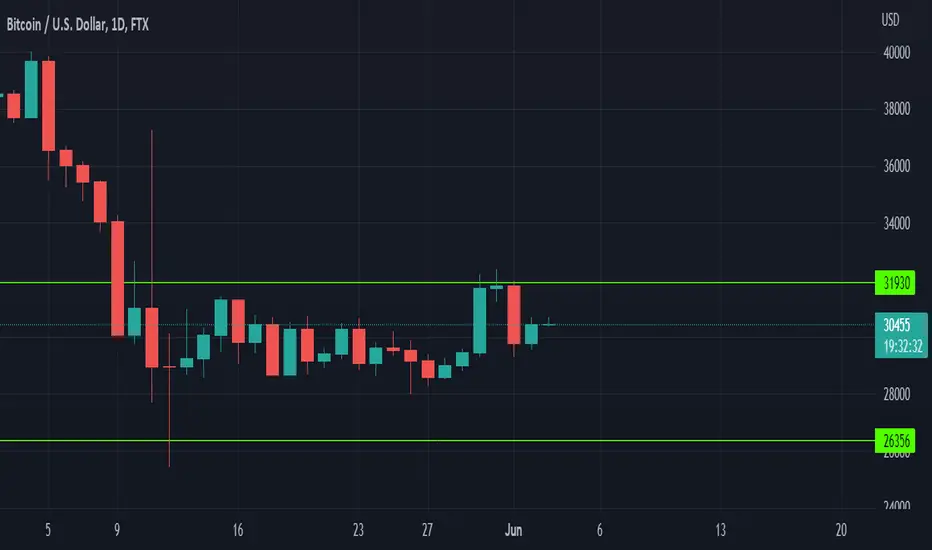
Long BTCUSDTThe whales are tempting you to short bitcoin so that they can push the prices up by doing this sideways movements.
The shorts of liquidation map is piling up, guys you all should go long because they will rekt the shorters.
It shows a strong bullish sign on daily candle on btc , it formed a support on daily and it will reverse from here and clean candle up to 31700. it is trapping elliott wave traders to short here, this will bottom here.
Long btc . Sick of this sideway obvious manipulation by whales.
A lot of people had lost money buying LUNC and investing in scam coins and wanted to recover their losses,
Whales had been defending this 29k-30k level multiple times. Everytime, it hits this level, it will bounce back.
Everytime, it drops below 29k , it will rebounce back, this shows a sign of strength where whales are accumulating.
This might be your last chance to buy bitcoin at the dip before going to 100k.
Bitcoin created a support with a green candle and it had formed a morning star daily candle closed with bullish candle with a clean candle to 31800 USD, this should push the price up to 31700 as clean candle. The whales will trap wave traders thinking it will go down but it will go up.
Do not short this but long instead, the manipulation is too easy to be spotted.
This is very bullish, long bitcoin and take profit at 100k. To the moon.
This should be the macro bottom. Simple whales with their obvious manipulation.
Hence, btc should moon from here and target 38k .
First target should be 33k .
This is not a signal and do not follow but a trade idea.
Disclaimer - This analysis alone DOES NOT warrant a buy or sell trade immediately. Before you enter any trade in the financial market, it is very important that you have a proper trading plan and risk management approach
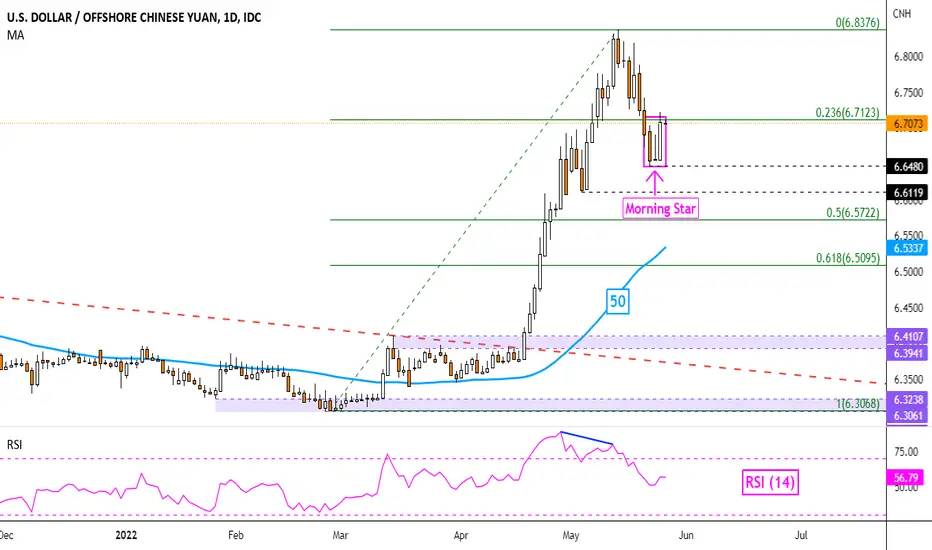
USD/CNH May Resume Broader Uptrend as China Faces Growth WoesThe US Dollar may regain its footing against the Chinese Yuan amid favorable fundamental headwinds.
China's zero-Covid policy has been weighing on local economic output. Meanwhile, rising fears of a recession in the US are slowly weakening global growth expectations. This leaves China in a tricky spot, even if conditions open up locally. A slowing global economy could sap the demand for Chinese goods. Diverging monetary policy is also favoring the US Dollar against the Chinese currency.
On the daily chart, USD/CNH has left behind a bullish Morning Star candlestick pattern. Further upside follow-through could open the door to further gains. That would place the focus on the May high at 6.8376.
Otherwise, clearing immediate support at 6.6480 exposes the Mat low at 6.6119 as the 50-day Simple Moving Average nears.
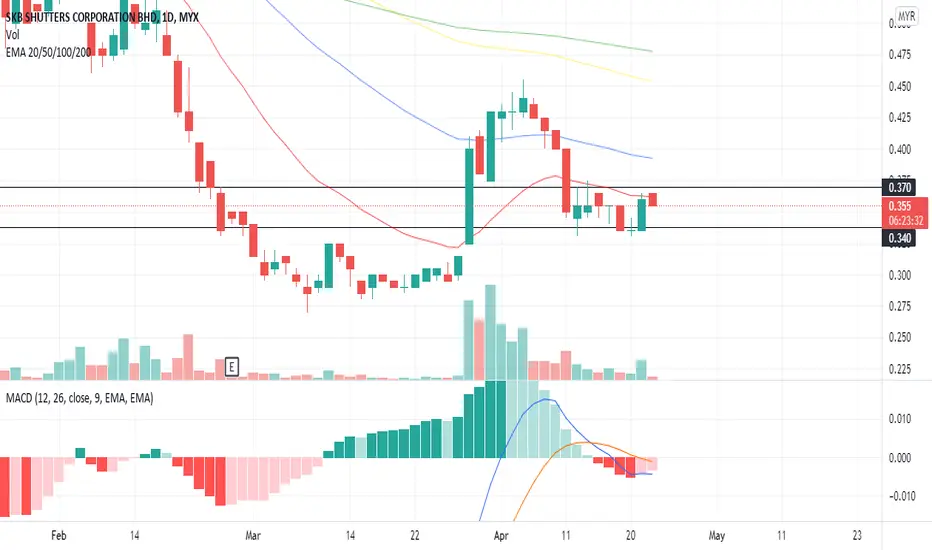
SKBSHUT form a morning star patternGann Support: 0.34/0.31 | Resistance 0.37|0.40
Current price near the resistance. MACD almost overlap.
Technically, a morning star has form yesterday but price might drop today due to Friday effect.
Hopefully can break the first resistance and become bullish next week
Analysis based on my hope only. No need to trust this analysis.
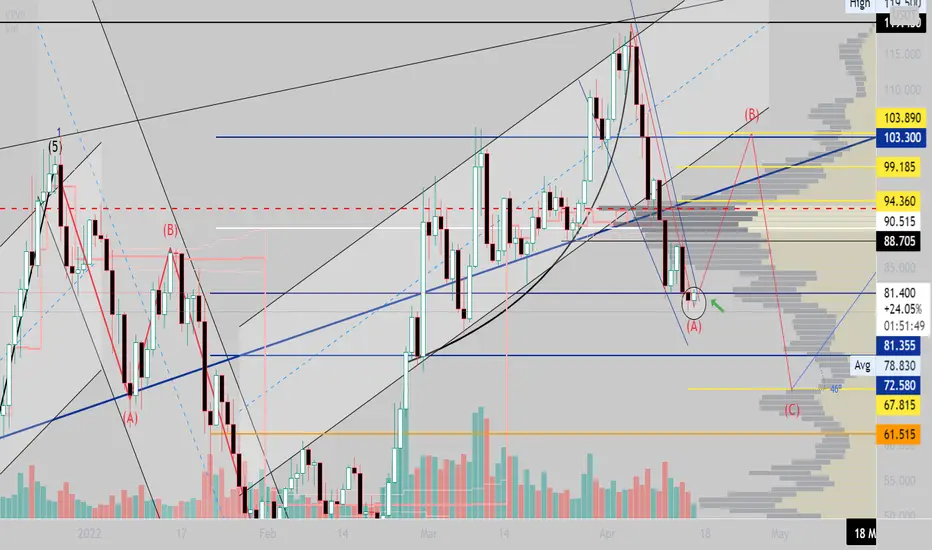
Morning Star is confirming a recovery trend on Terra Luna!
The morning star formed a bullish engulfing candle set as expected. We have to confirm today's daily chart candle, of course.
We exit the descending wege that`s left us with a higher degree of certainty for Luna's rebound at least to a 1 target at $97.00
Bitcoin appears to have hit bottom also. We could have a decisive bull week to resume BullRun.
It is to be very attentive with the possibilities of this week in Kripto.

Morning Starin daily Luna Grafic.
3 morning stars:
the logic is to have 2 small-bodies candles isolated and a third engulfing candle, which is what I expect in this next daily candle.
In this case they appeared at the Fibo 50% of the last leg up increasing the confidence of a reversal.
Be careful because at the moment we are waiting for the engulfing sail.
Note that this last volume candle is small and gives us the idea that sellers are losing their strength to push the price down.
Targets upward in golden ratio in yellow.
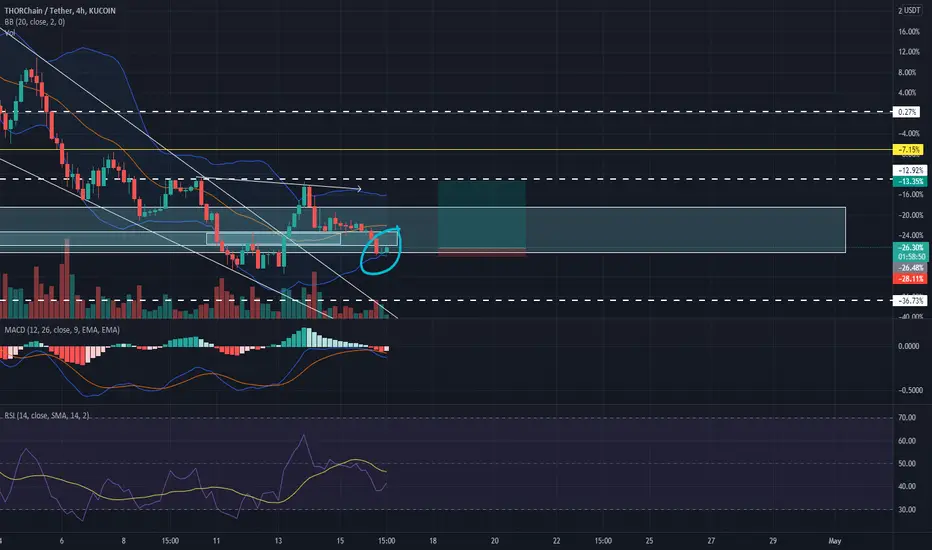
big move coming?potential morning star at the bottom of a zone. tell me what you guys think we are also at the bottom of the Bollinger band.
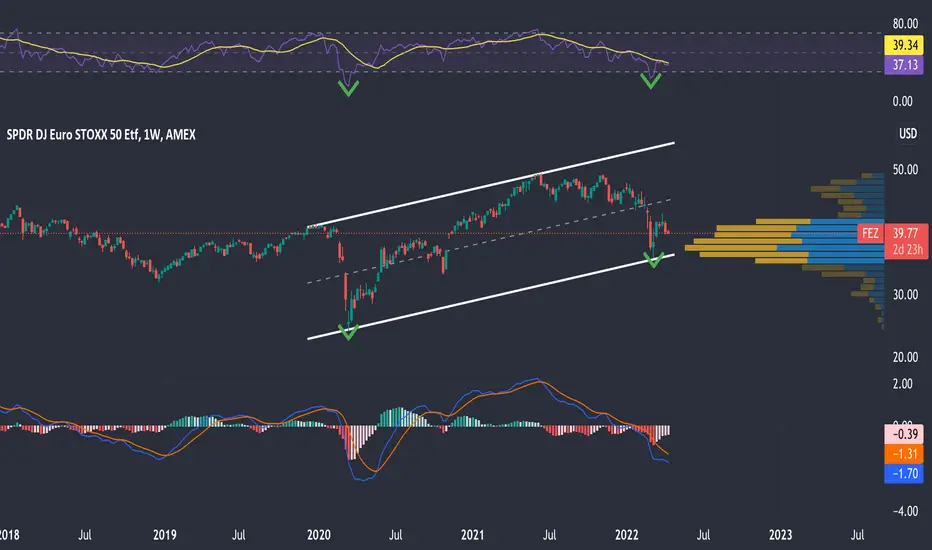
play $FEZ for a bounceFEZ bounced right off the volume shelf where the POC is as well. It looks like it's going to have another V-shaped recovery after selling off heavily. Its RSI is oversold, and MACD looks like it could be beginning to turn around.
Overall the weekly chart looks good. It may be smart to wait for FEZ to crack $40.50 or $41 on high volume for extra confirmation.
One could argue that there was a morning star reversal pattern if you look at the candles of the most recent potential V-shaped bottom.
Morning Star on NPHA morning star pattern has formed on JSE:NPH over the last few days. If triggered, this could mean a move to the upsode.

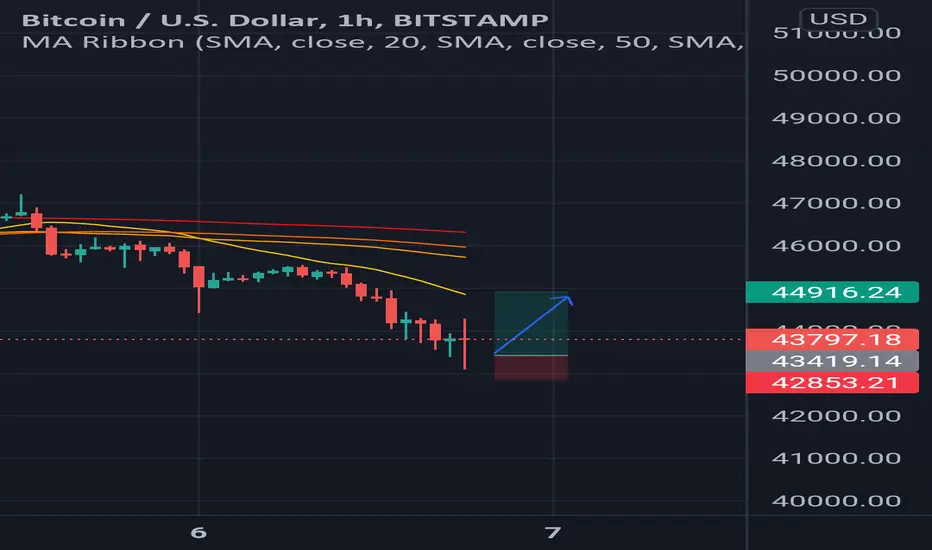
Bitcoin - Small bull trade idealonged 43,500, targeting 44,800, taking profits at 44,600, stop-loss at 42,800
bull hammer, followed by morning star on 1hr timeframe
morning stars are bearish > bullish trend reversals however I expect it to hit the band at around 44,800 and either come back down or go sideways for abit
this is a small risk trade for me, where If I get stopped out I don't care and if it plays out, I make a near 30% gain
sorry for low detail, I'm on my phone right now and struggling with the new update
the market is risky right now, don't take this as advice, this is just my idea :)
comment your ideas down below :)
LONG ON GBP/CAD Downward channel falling into a major support zone on this pair.
small morning start candle stick pattern on the 2hr timeframe.
it would be a safer trade to get in after the breakout then a retest, Im just trying to catch it early.
Here is the play I will be taking on this pair:
OT = MARKET BUY NOW
P = 1.63255
SL = 1.62865 - 42 PIPS
TP = 1.64541 - 125 PIPS

Bags $4M FundItheum announced investments from Elrond, Mechanism Capital, and other crucial investors; raising their funds from $11.5M to $14M. The initial $11.5M came from an earlier round funded by Morningstar Ventures, incubating Itheum via their Elrond Dubai Incubator.
The additional investments included Elrond Foundation, Mechanism Capital, Woodstock, Ascensive Assets, Skynet EGLD Capital, MHC Digital Finance, ZBS Capital, and Spark Digital Finance.
Itheum’s Founder Mark Paul commented on the recent eventful months of Itheum.
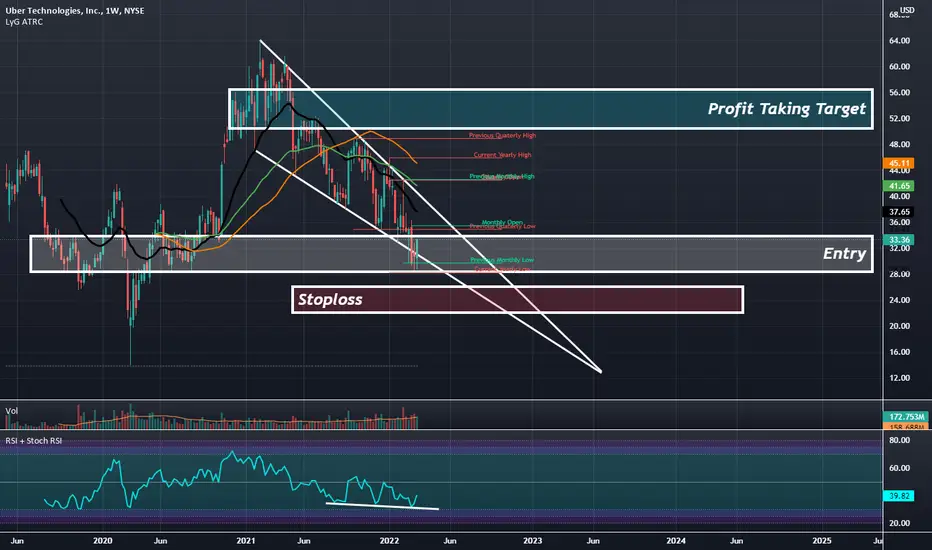
UBER: Weekly Morning Star Doji Within a Falling WedgeUber right now is at the bottom half of a Falling Wedge and has printed a Weekly Bullish Engulfing Candle against a Morning Star Doji at a Horizontal Support and at RSI Support and looks like it's preparing to begin a new major move back up from here.
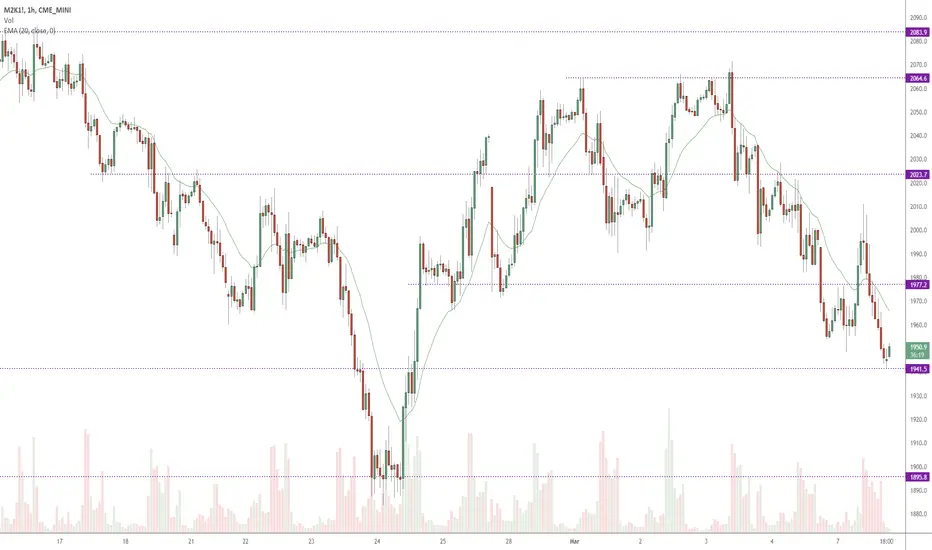
Russell Long Off Hourly SupportNice risk reward here long on hourly chart with morning star pattern on support and price extended from 20 ema.
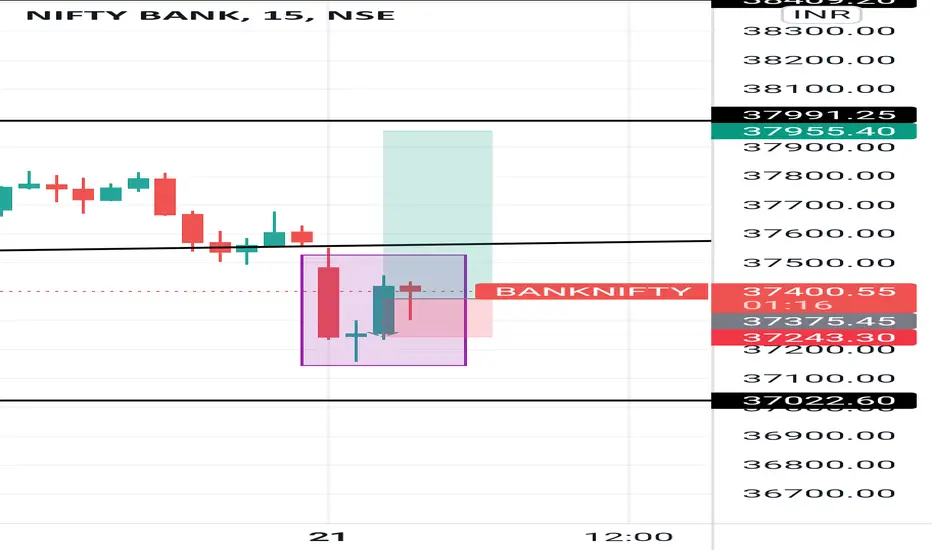
#banknifty #intraday #morning starBanknifty formed morning star pattern in 15min time frame long for given target
Thank you
Morning Star at PCZ of Bullish Gartley Visible on WeeklyCorsair for it's entire life has shown nothing but Negative Momentum on the Weekly MACD but now only after hitting the PCZ of a Bullish Gartley has it decided to print a Bullish Candle Stick Pattern and show a Curling up in MACD Momentum; this may signal seller weakness and if this continues we will see the first bar of Positive MACD Momentum in the asset's Entire Lifetime, that may lead to a Climatic Rising in Price, perhaps all the way up to the $50s in the coming weeks.

DATAPRP Morning Star Formation or Continue DowntrendPossibility to form morning star, or forming same pattern as first circle or worst continue downtrend.
Entry 0.460, TP1 0.490, TP2 0.530 and cutloss 0.430. If break downtrend line, possiblity of uptrend movement. Trade at you own risk. Comment if you have different idea. Thank you for your time.

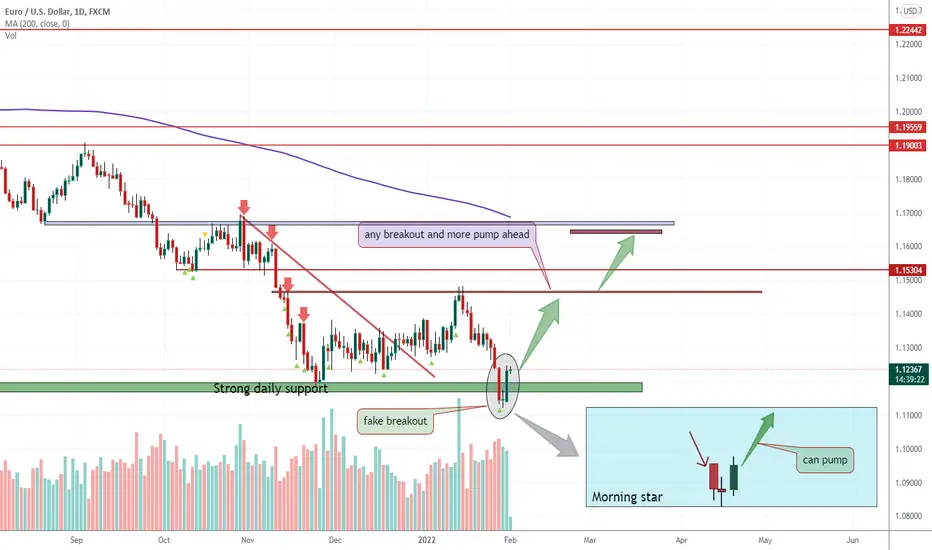
EURUSD the Morning Star candlestick pattern And soon can pumpBased on our educational post:
Now we can expect local pump here for EURUSD based on two factors:
1. reversal and bullish candlestick pattern named Morning star.
2. so many stop losses hit when the price broke the daily support and it is a good sign too. (fake breakouts are a good reversal sign too)
DISCLAIMER: ((trade based on your own decision )) This post is actually a review of candlestick patterns that we had by example and is not financial advice on EURUSD so do your own research for your trades.
<>
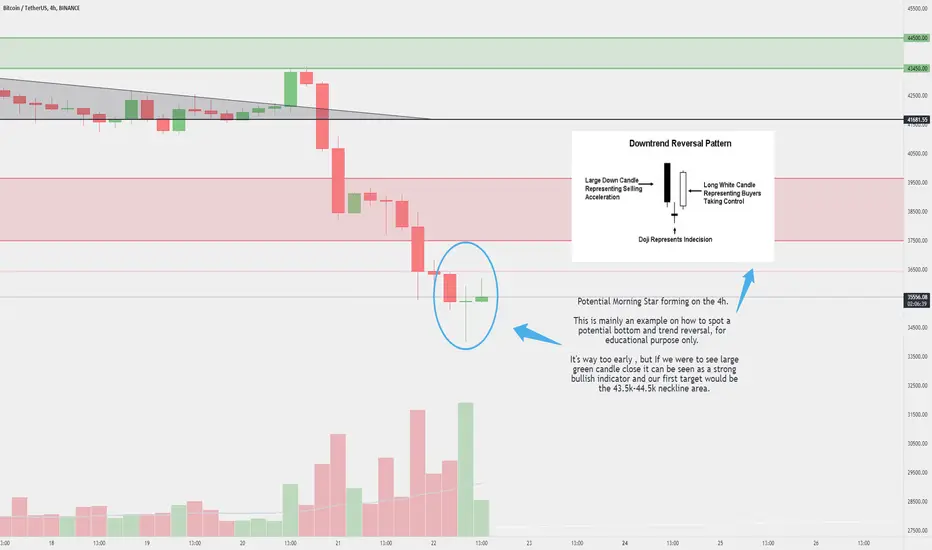
BITCOIN Morning Star Forming!?Hi Everyone! 😃
Nothing to add here, it's all in the chart 😉📈
Thanks for stopping by, I hope you enjoyed my post, and if you did, please drop a like or comment, it helps to improve and puts a smile on my face! 😃🙏
Happy Trading ✌❤📈