Let's talk about Candlestick Chart PatternsThe candlestick chart patterns are used by traders to set up their trades, and predicting the future direction of the price movements. There are many candlestick chart patterns. I will be discussing a few of those.
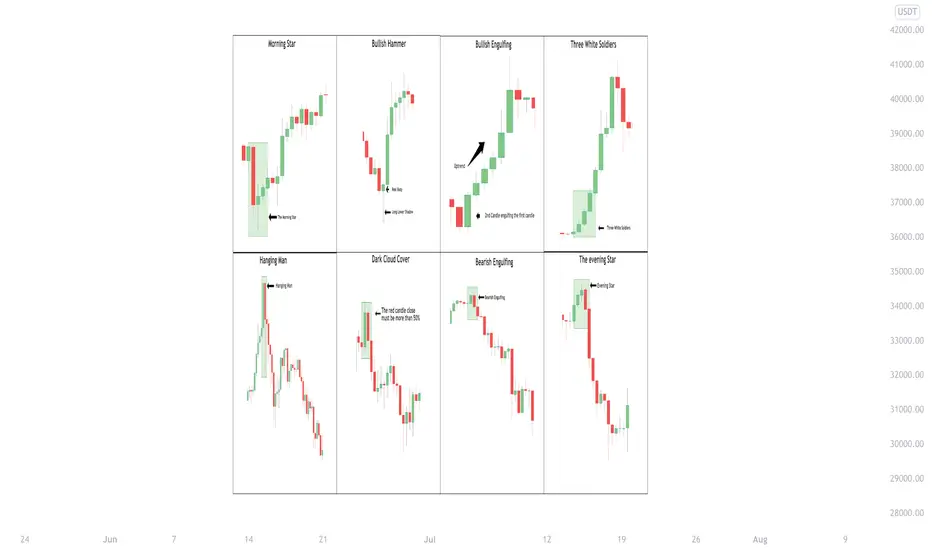
✅ Morning Star is formed after a downtrend indicating a bullish reversal. Generally made of 3 candlesticks, first being a bearish candle, second a Doji, and third being a bullish candle. The first candle shows the continuation of the downtrend, the second being a Doji shows indecision in the market and the third bullish candle shows that bulls are back in action.
✅ Bullish Hammer is a single candlestick pattern, which is formed at the end of the downtrend and shows bullish reversal. The real body of this candle is small with a long lower wick which should be more than twice the real body. This candle is formed when the seller pushes the price downwards but at the same time buyers arrive and push the prices up.
✅ Bullish Engulfing is formed after a downtrend, indicating a bullish reversal. It is formed when a bearish candle is fully engulfed by a bullish candle which shows that the bulls are back in the market.
✅ Three White Soldiers is a multiple candlestick pattern that is formed after a downtrend indicating a bullish reversal. It is formed when three consecutive bullish candles appear one after the other. These three candles show a strong bullish trend.
✅ Hanging Man is generally formed at the end of an uptrend and signals bearish reversal. The real body of this candle is small and is located at the top with a lower shadow which should be more than twice the real body. This candlestick pattern has no or little upper shadow.
✅ Dark Cloud Cover is formed by two candles, the first candle being a bullish candle which indicates the continuation of the uptrend. The second candle is a bearish candle that opens the gap up but closes more than 50% of the real body of the previous candle which shows that the bears are back in the market and a bearish reversal is going to take place.
✅ Bearish Engulfing is formed by two candles, after an uptrend indicating a bearish reversal. It is formed by two candles, the second candlestick engulfing the first candlestick. The first candle being a bullish candle indicates the continuation of the uptrend. The second candlestick chart is a long bearish candle that completely engulfs the first candle and shows that the bears are back in the market.
✅ Evening Star is made of 3 candlesticks, first being a bullish candle, second a Doji, and third being a bearish candle. The first candle shows the continuation of the uptrend, the second candle being a doji indicates indecision in the market, and the third bearish candle shows that the bears are back in the market and reversal is going to take place.
Thanks for reading and hope you like it.
Please comment and let us know your thoughts on it.
Happy Trading
Morning Star
How to use Candlestick Patterns ..Hello Traders , Have a nice weekend.
it's good to learn something even if you knew it before,Seriously some of you know all these patterns but don't know how to use them.
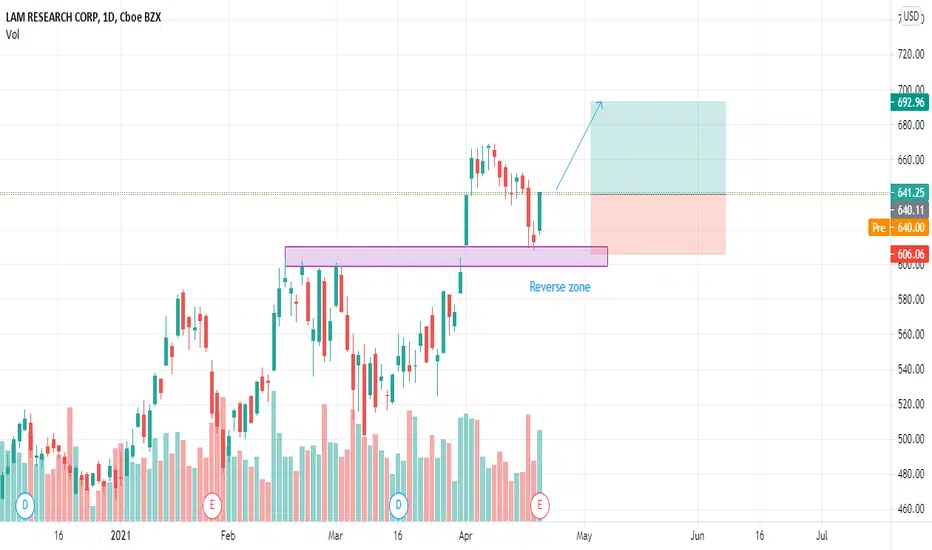
First we have to draw our support and resistance area in higher time frames , then we switch to lower time frames to see a candlestick pattern and now you can enter the trade after a little price rest to have a better RR ratio guys.
Good Luck on that , As easy as you see
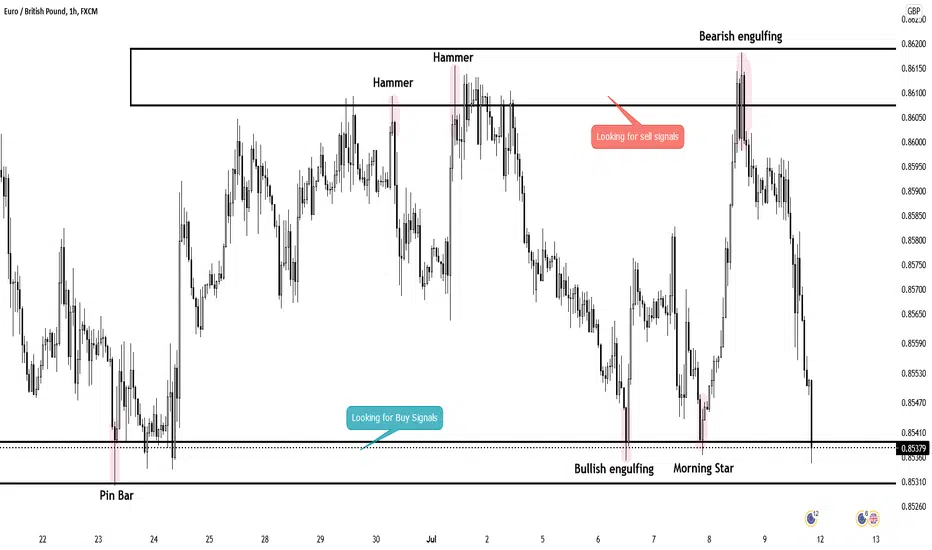
symetrical trinagle breakout it has retested after the breakout and formed a morning star at the retest zone , can expect a good upmove .
Im a beginnner, just sharing my views .

EURUSD Pin Back weekly 3.414Hello everyone there's my look for EURUSD for next week!
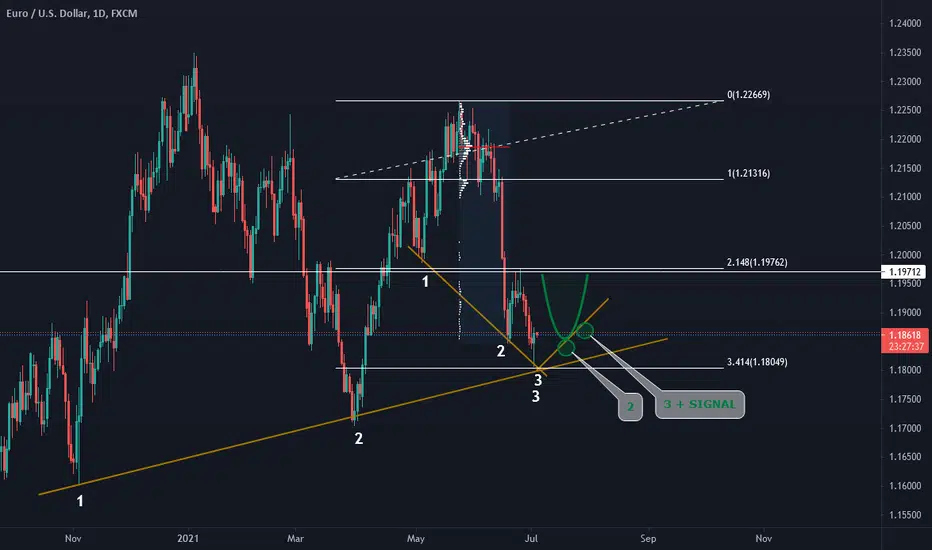
On the high of swing there's a pin bar so i'm checking sitiuation and reactions on levlel 3.414.
There's a 3rd touch from two symmetries as i drew and up from 1:18465 is a big space where will price go in my oppinion.
I would like to see H&S pattern down there and also third touch on symmetry on the right shoulder.
Up from 1.18465 there's no accumulated value which can stop the price, POC is 1.21870.
So i wish u lot of succsess into new trading week and remember, be disciplined, wait for a signal!
If you don't have a signal, you can't call anyone, so why do you want to trade without it?
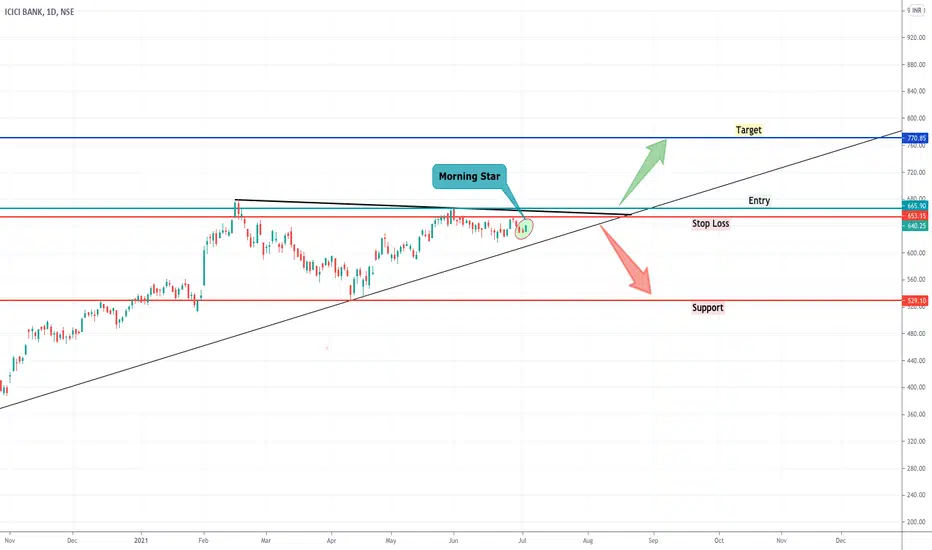
ICICI Bank Triangle Break Out - Long- RSI Bullish
- Stochastic Cross over
- Morning Star (Bullish pattern)
- Wait for Triangle Break Out
Entry = 665
Stop Loss = 653
Target = 770
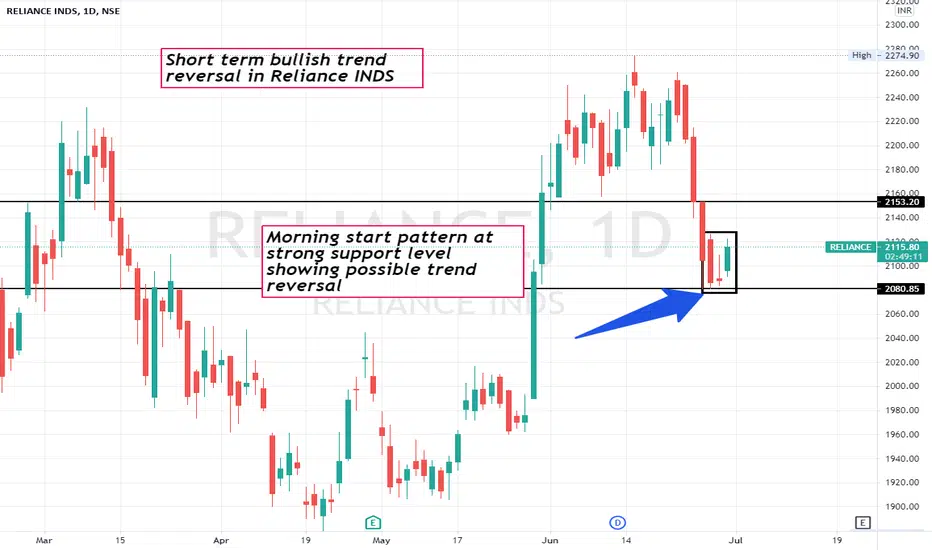
RIL. Short term bullish trend changeShort term bullish reversal in Reliance India limited.
This post is for educational purpose only.
Bitcoin Analyze (Candlestick Analysis)!!!hi, I hope that you took profits from my previous posts😊 (If Yes, please comment).
Today, I want to talk about some Candlesticks Patterns that we saw these days( Around one Month🌙).
Bitcoin Analyze ( BTCUSDT ) Timeframe Daily ⏰
Location: Still, Bitcoin is running on our Descending Triangle , and It close to the lower line of the Triangle (Support zone: 31620$ until 30960$ (Support + Cluster of Fibs+ the lower line of Descending Triangle ) == Heavy & important Support).
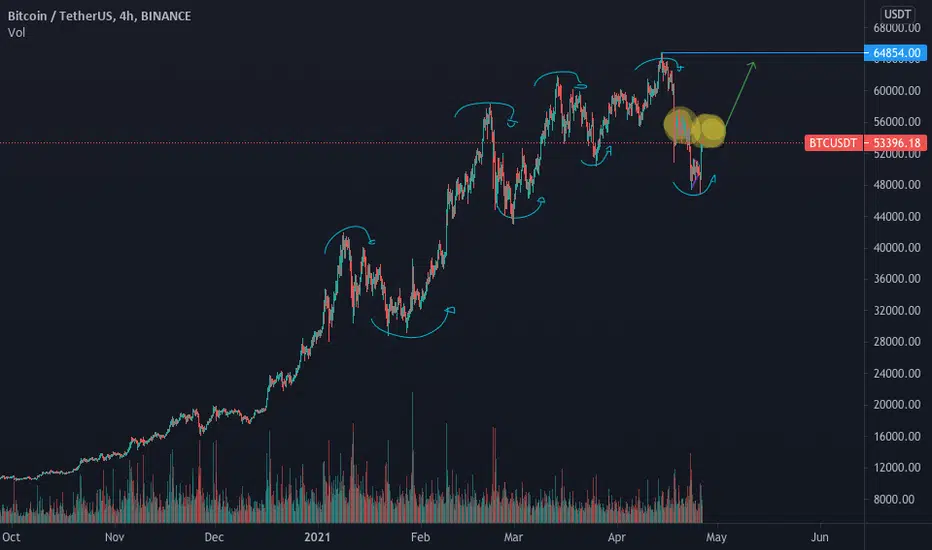
About Candlestick analysis : I was able to find Bearish Engulfing Pattern on the upper line of Triangle (Point C) + Morning Star Pattern on the Lower line of Triangle (Point D) + Evening Star Pattern at Point D (Fake Break) == All of these patterns were REVERSAL Pattern, but, now I can see Falling Three Method Pattern ( CONTINUATION Pattern) on the Lower line of Triangle (Point F), so I am expecting that Next Daily Candle will have RED Body.
RSI Analyze: RSI is running at Descending Channel, even we can see two fake breaks on this way, also I found Head and Shoulder Pattern on the upper line of our channel, if RSI breaks necking line, probably RSI will close to our Support Zone.👉https://tradingview.sweetlogin.com/x/5F3N99fl/
MACD Analyze: we can see Bearish Confirmation Signal 🐻 👉
ADX = 38.6 >25 == Still we are on Downtrend.
Moving Averages MA200 & MA50 Passed from each other a few days ago.
I am deciding to share Bitcoin Long-term Analyze ( Monthly Time frame )📆 on each post that I will publish about Bitcoin: Please read this post carefully ( I ❤️LOVE ❤️THIS POST😀)👉https://tradingview.sweetlogin.com/chart/BTCUSDT/PTviG7sS-Bitcoin-Long-term-Analyze-Monthly-Time-frame/
If you want to have more information about counting waves supports and resistances.....check this post 👉https://tradingview.sweetlogin.com/chart/BTCUSDT/Ie6NTjBA-Bitcoin-Analyze-Playing-with-Harmonic-Patterns/
My Suggestion: please do NOT buy Coins for Midterm and Long-term investment until the market finds a way. At least you can wait for breaking our Descending Triangle (to UP).
Do not forget to put Stop loss for your positions (For every position you want to open).
Please follow your strategy , this is just my idea, and I will be glad to see your ideas in this post.
Please do not forget the ✅ 'like' ✅ button 🙏😊 & Share it with your friends, Thanks, and Trade safe.

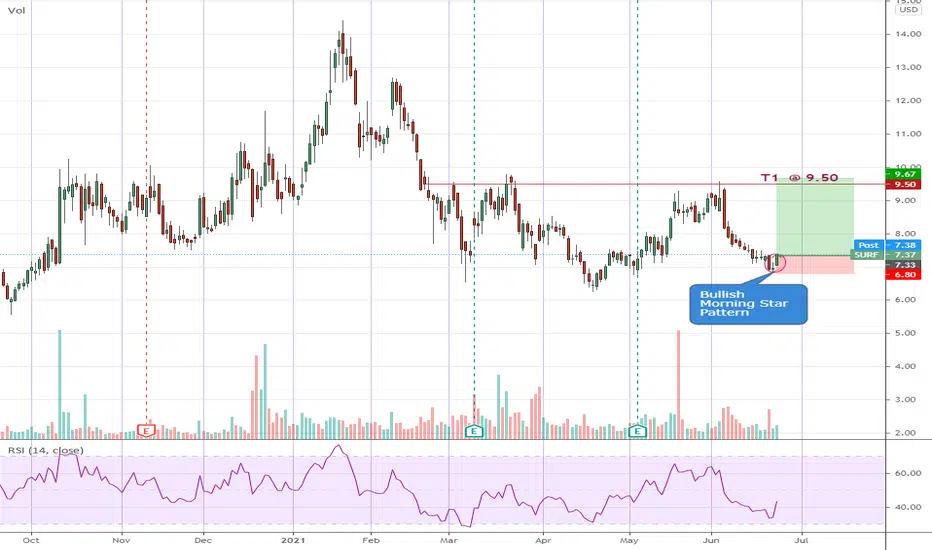
SURF - Bullish Morning Star Pattern!After a downward streak for the past 2.5 weeks, SURF finally presented a bullish "Morning Star" candlestick pattern. If you are not sure what this pattern entail, just google it and you will find plenty of info.
Go Long as soon as price makes a new high from today's candle (7.39) with an initial stop several ticks below the pattern's low @ 6.84. I will be attempting to ride it to an intial target of 9.50 (trail protective stops upwards) where we could have some serious resistence there. Risk:Reward of 1:3 for this trade.
Disclaimer: TA is about improving our odds of a successful trade (not a guarantee). This is just my own analysis and opinion for discussion and is not a trade advice. Kindly do your own due diligence and trade according to your own risk tolerance and don't forget that money management is important! Thank you. Do give me a thumbs up if you agree. Feel free to let me know what you think! :)
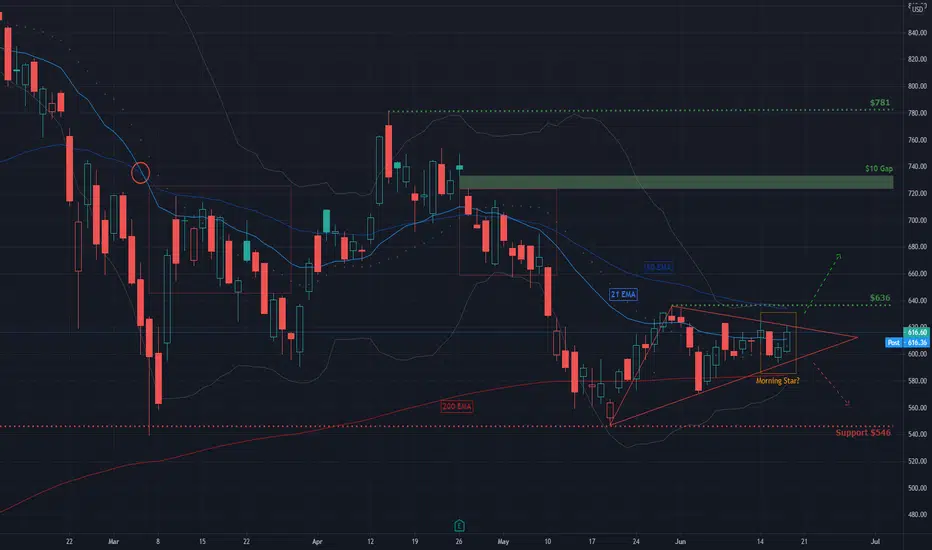
TSLA : Possible Breakout Or Another False Break?Hello Everyone!
NASDAQ:TSLA has been struggling to break above 21 day EMA since it became bearish (in short term) in March when the 21 day EMA fell below the 50 day EMA. One exception happened in April due to sales reports, analyst price targets and earning expectation (?) when it succeeded to go above the 21 day EMA but that move did not sustain as we can see. In May it even went below the 200 day EMA to retest the strong support around $546.
Since then it has formed a wedge structure testing the 21 day EMA multiple times. It is expected that at some point NASDAQ:TSLA will break out of that structure. Price actions in last 3 days have formed a "variation" of the Morning Star pattern which is signaling towards a bullish move tomorrow or early next week (Friday, June 18 onwards). Whether this move will follow through and the wedge structure will be broken in the upward direction can only be verified by the price actions in coming days. Which will also depend on the economic news and overall performance of NASDAQ:NDX given the index has hit all time high today.
Assuming that NASDAQ:TSLA will sustain above 21 day EMA with this move, we can expect it to test recent highs such as price level $635, the $10 Gap fall between price levels $723 & $733 and price level $780.
If in case the upward movement doesn't sustain and the wedge is broken in bearish direction, NASDAQ:TSLA will again test the support level $546. For now I am leaning towards the bullish position more but the possibility of a false break cannot be overruled given the stock's recent performance.
Hope you will find this analysis useful. Please feel free to post your opinion and support my posts if you find them useful.
Thanks!
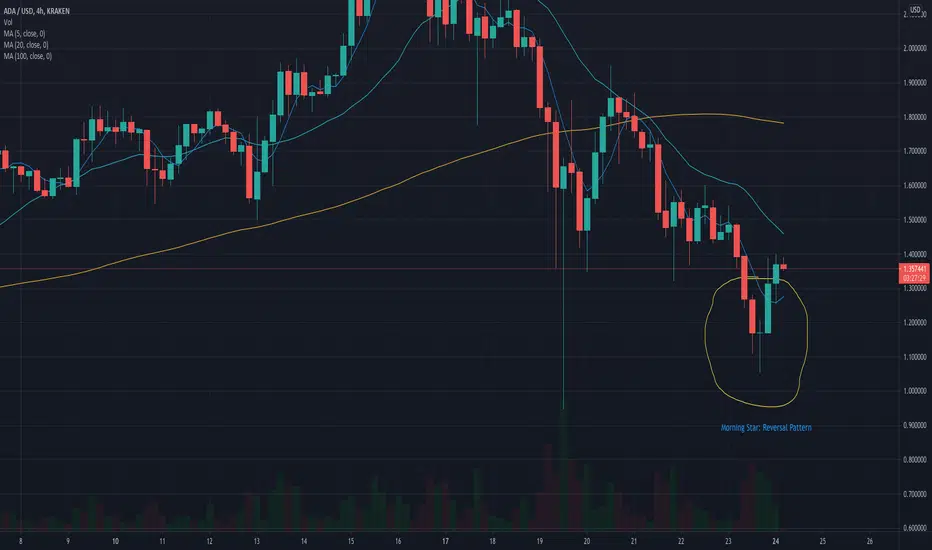
ADA Back on TrackADA 4H chart recently presented a Morning Star pattern, which indicates a reverse on this short Bearish Cycle we've been experiencing. The most certain thing is that the Bull market is back on track and the price is going up from now on.
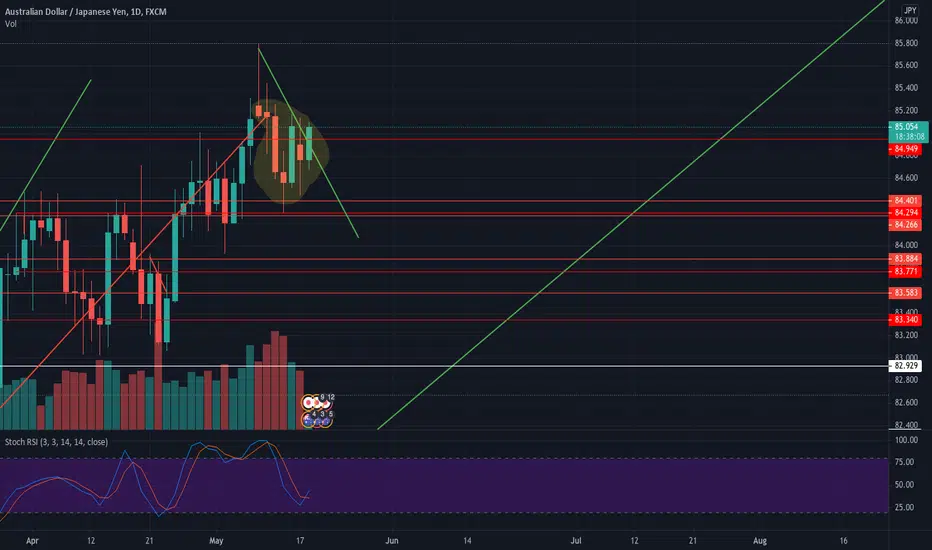
AJ Bullish Intraday SwingAj appears to have broken trend and formed a Morning Star? Does this mean that the bullish trend continues? Lets see if theres any meaning to this Morning Star Pattern !
BATAINDIA - Weekly - Swing TradeThe above analysis is done purely based on Price action and Popular chart analysis.
The analysis is done on weekly time frame and hence it may take price a couple of weeks to few months to reach the target.
Analysis and trade setup has been shared in the image itself. The analysis of BATA has been done couple of weeks ago as well. One can check that out in the "linked ideas".
BATA being the leader in its sector, one can also use this analysis for short to medium term investment.
Don't run after the price, and always trade based on your study.
Maintain proper risk management.
Also check out my other ideas based on morning star pattern linked below.
Feel free to comment or message me for any kind of queries.

WHIRLPOOL - Weekly - Retest & Reversal (Morning Star) - SwingThe above analysis is done purely based on Price action and Popular chart analysis.
The analysis is done on weekly time frame and hence it may take price a couple of weeks to few months to reach the target.
Analysis and trade setup has been shared in the image itself.
Don't run after the price, and always trade based on your study.
Maintain proper risk management.
Also check out my other ideas based on morning star pattern linked below.
Feel free to comment or message me for any kind of queries.

BATA - Weekly - Morning star formation at support level - SwingThe above analysis is done purely based on Price action and Popular chart analysis.
The analysis is done on weekly time frame and hence it may take price a couple of weeks to few months to reach the target.
Analysis and trade setup has been shared in the image itself.
BATA being the leader in its sector, one can also use this analysis for short to medium term investment.
Don't run after the price, and always trade based on your study.
Maintain proper risk management.
Also check out my other ideas based on morning star pattern linked below.
Feel free to comment or message me for any kind of queries.

ABNB - Bullish Mornng StarSince peaking on 11 Feb this year, ABNB has been establishing a support zone between 162-170. Today it formed a mornng star pattern right in this support zone.
Expect an upswing next. Should trade goes our way, I would consider to scale out partially between 192-195 and ride the rest with trailing stops.
Disclaimer: This is just my own analysis and opinion for discussion and is not a trade advice. Kindly do your own due diligence and trade according to your own risk tolerance. Thank you. Feel free to give me your thoughts ! :)

TSLA People's Champ - Part 2I like what I'm seeing here. Great candle printed today. Starter position order filled at 700, though seems to be battleground level. Tomorrow's candle should confirm the morning star pattern. Local highs and lows all higher. Major trendline validated confirming overall bullish bias. And... it's no secret the upgrades!! :)
Pitfalls:
-Recent news piece not good.
-Bitcoin exposure (sorry, I'm short term bearish on Bitcoin. But long term bullish).
-Of course, inflation.
-800 level looks like a tough cookie to crack.

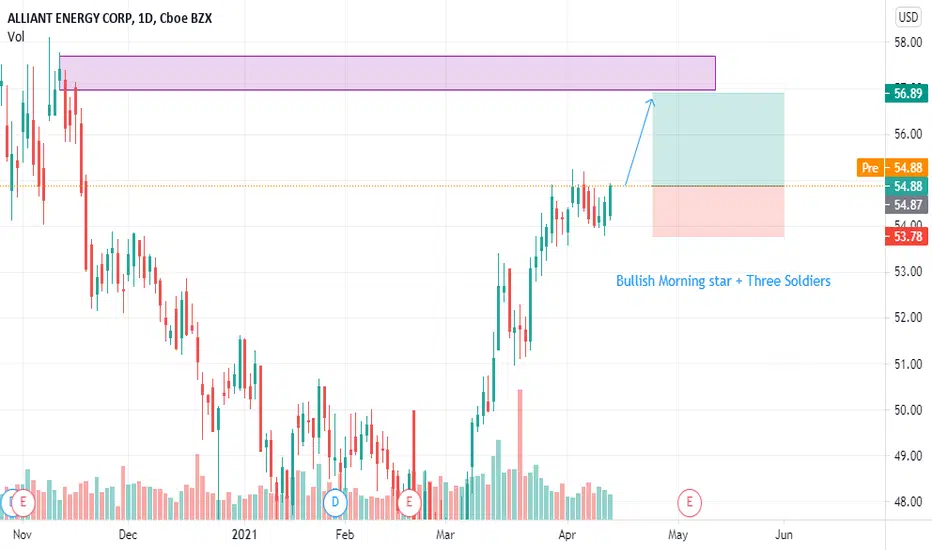
LNT - Bullish Morning star + Three Soldiers candle formationLNT - Bullish Morning star + Three Soldiers candle formation