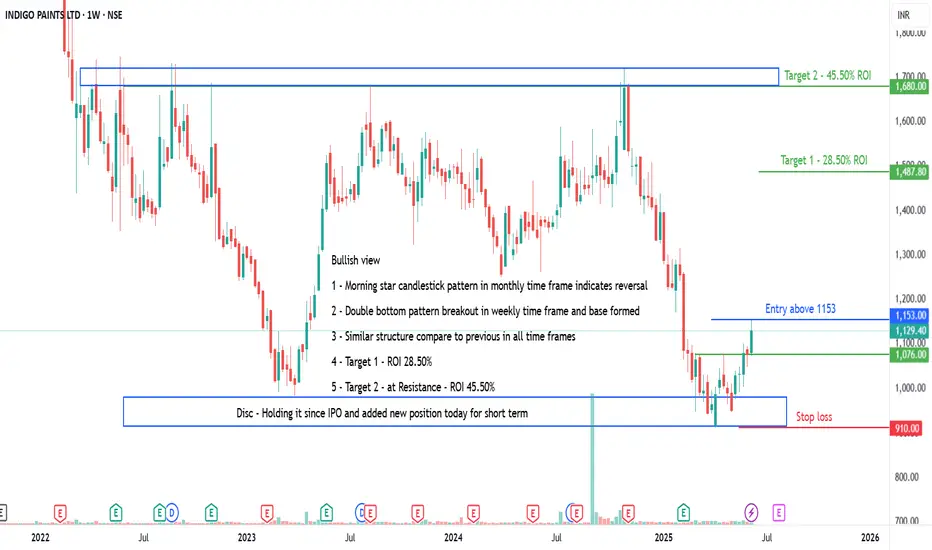
INDIGOPNTS - Bullish view potential of 28 to 45% ROIAll details are given on chart for educational purpose only. If you like the analyses please do share it with your friends, like and follow me for more such interesting charts.
Disc - Am not a SEBI registered analyst. Please do your own analyses before taking position. Details provided on chart is only for educational purposes and not a trading recommendation
Morningstarpattern
What Is a Morning Star Pattern & How Can You Use It in Trading?What Is a Morning Star Pattern, and How Can You Use It in Trading?
The morning star candlestick is a popular price action pattern that technical analysts and traders use to identify potential trading opportunities. It indicates a reversal from a bearish to a bullish trend and is a valuable addition to any trader's toolkit. In this article, we will cover all the technical aspects of the morning star candlestick pattern.
What Is the Morning Star Candlestick Pattern?
The morning star in technical analysis is a reversal formation that appears at the end of a downtrend and signals a trend reversal. It consists of three candles.
To identify it on the chart, you should look for the following:
1. Downtrend: The market should be in a downtrend, and the first candle should be long and bearish.
2. Indecision: The second candle is usually expected to have a gap down, but gaps are uncommon in forex. Therefore, a small-bodied candle is considered sufficient. It's worth noting it can be either bullish or bearish, but if it’s bullish, the signal is stronger.
3. Significant increase: The third candle should be strong and bullish and close above the midpoint of the first bearish one. If it forms with a gap up, the buy signal is considered stronger.
When Morning Star Candlestick Patterns Occur
Traders can identify the morning star candlestick pattern in stocks, forex pairs, commodities, and cryptocurrencies*. It may also be observed across various timeframes, from minutes to weeks.
Generally speaking, a morning star pattern can be considered more reliable when it appears on a higher timeframe. For instance, a morning star candlestick pattern has more significance when it occurs over three days vs three minutes, given the increased amount of price action and market participation reflected over longer periods.
Psychology Behind the Pattern
The morning star reversal pattern reflects a shift in market sentiment from bearish to bullish. Initially, a strong bearish candle indicates prevailing selling pressure. The second candle, with its small body, suggests indecision as the market stabilises and neither bulls nor bears dominate. This pause indicates that sellers are losing momentum. The third morning star candle, a strong bullish one, confirms the shift as buyers take control, driving prices higher. This pattern signals that the downtrend is likely exhausted, and a potential reversal is underway due to increasing buyer confidence.
Trading with the Morning Star
Traders can use the following steps to trade this setup:
1. Identify the setup: Look for a setup on the chart formed after a solid downtrend.
2. Confirmation: After identifying the formation, traders should confirm it before entering a long position.
3. Enter a long position: Consider entering a long position once the formation is confirmed.
4. Determine a take-profit target: Although candlesticks don’t provide specific entry and exit points, traders may consider the closest resistance level to take potential profit.
5. Monitor the trade: Continuously monitor the trade and adjust the stop-loss and take-profit levels as needed based on market conditions.
What Is the Morning Star Candlestick Strategy?
The morning star trading strategy leverages the formation's ability to signal a bullish reversal after a downtrend. The formation's reliability increases when it occurs at a support level and is confirmed by a momentum indicator like the RSI or MACD.
Entry:
- Traders look for the full morning star to form at a support level.
- They then look for a confirmatory bullish signal from a momentum indicator, such as RSI showing oversold conditions, a bullish MACD crossover, or a bullish divergence in either.
- Traders may wait for additional confirmation, like RSI moving back above 30, or enter on the close of the third candle in the pattern.
Stop Loss:
- A stop loss might be set below the swing low of the setup.
- Alternatively, traders may place the stop loss beyond the lower boundary of the established support level.
Take Profit:
- Profits might be taken at a predetermined risk-reward ratio, like 2:1 or 3:1.
- Traders also often aim for an opposing resistance level where a further reversal might occur.
Morning Star and Other Formations
Traders should not confuse the morning star candle formation with other formations, such as the evening star, which is the complete opposite.
Doji Morning Star
In a traditional morning star reversal pattern, the candle that appears in the middle of the formation has a small real body, meaning there is a clear difference between the opening and closing prices.
In a morning doji star formation, the second candlestick has characteristics of a doji, where the opening and closing prices are very close to each other, resulting in a very small real body. This reflects the indecision as neither bulls nor bears can take control of the market.
The doji setup is less common than the traditional formation, but it still signals a potential upward movement after a prolonged downtrend.
Evening Star
In contrast to a morning setup, an evening star is a bearish setup occurring after an uptrend. It also consists of three candles – a long bullish one, a small-body one (it can also be a doji), and a long bearish one that closes below the midpoint of the first bullish candle. This suggests that the market is about to turn down.
Benefits and Limitations of the Morning Star Candle
The morning star is a useful tool for traders seeking to identify potential market reversals, but it does come with some benefits and limitations.
Benefits
- Strong Reversal Signal: Indicates a bullish reversal after a downtrend, helping traders anticipate upward moves.
- Broad Applicability: Effective across various financial instruments such as forex, stocks, commodities, and cryptocurrencies*.
- Timeframe Flexibility: It can be observed on different timeframes, from intraday to weekly charts.
Limitations
- False Signals: Like all patterns, it can produce false signals, especially in volatile markets.
- Confirmation Needed: A morning star pattern entry requires confirmation from additional indicators or formations to improve accuracy.
- Experience Required: Identifying the formation correctly and interpreting its signals requires experience and a good understanding of price action.
Final Thoughts
While candlestick formations such as the morning star can be useful for traders to identify potential trading opportunities, it is crucial to remember that they are not foolproof and should not be the sole choice of market participants when making their trading decisions. Traders should also incorporate technical indicators and develop risk management techniques to potentially minimise losses.
FAQ
What Is a Morning Star in Trading?
The meaning of a morning star in trading refers to a bullish reversal formation consisting of three candles. It appears at the end of a downtrend, indicating a potential shift to an uptrend. The setup includes a long bearish candle, a small-bodied candle, and a long bullish candle.
Is the Morning Star Bullish or Bearish?
It is a bullish candlestick pattern that indicates a potential reversal from a downtrend to an uptrend in the market. It suggests that the selling pressure is subsiding, and buying pressure is beginning to take over.
What Does the Morning Star Pattern Indicate?
It is a three-candle price action, often indicating a bullish reversal in the market. It suggests that selling pressure has been exhausted, and buyers are starting to gain control of the market.
How Do You Read the Morning Star Pattern?
To read the morning star formation, traders should look for the following characteristics: a long bearish candle formed in a solid downtrend and followed by a bullish or bearish candle with a small real body, which in turn is followed by a long bullish candle closing above the midpoint of the first one.
What Is the Opposite of Morning Star?
The opposite of a morning star is the evening star, a bearish reversal pattern. It appears at the end of an uptrend, signalling a potential shift to a downtrend. The morning and evening stars are similar, except the latter mirrors the former, consisting of a long bullish candle, a small-bodied candle, and a long bearish candle.
*Important: At FXOpen UK, Cryptocurrency trading via CFDs is only available to our Professional clients. They are not available for trading by Retail clients. To find out more information about how this may affect you, please get in touch with our team.
This article represents the opinion of the Companies operating under the FXOpen brand only. It is not to be construed as an offer, solicitation, or recommendation with respect to products and services provided by the Companies operating under the FXOpen brand, nor is it to be considered financial advice.
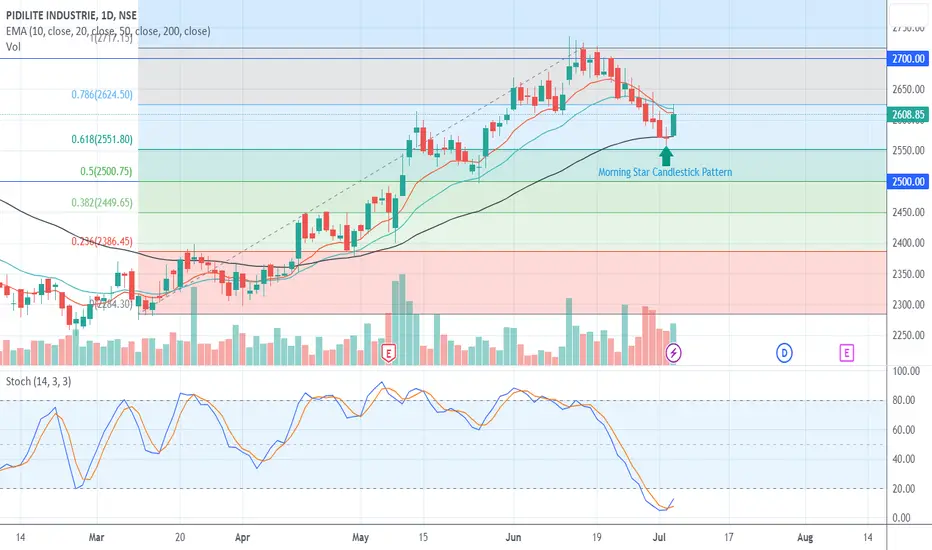
Morning Star on PIDILITE INDPIDILITE Industries' daily chart shows a Morning Star candlestick pattern, finding support at the 50 EMA and the Fibonacci 61.8% level. The 14-period stochastic oscillator indicates an oversold condition and recent reversal, confirming a potential uptrend ahead. Bullish signals suggest positive price movement.
Buy at Market, Target at 2700, Stop Loss at 2550
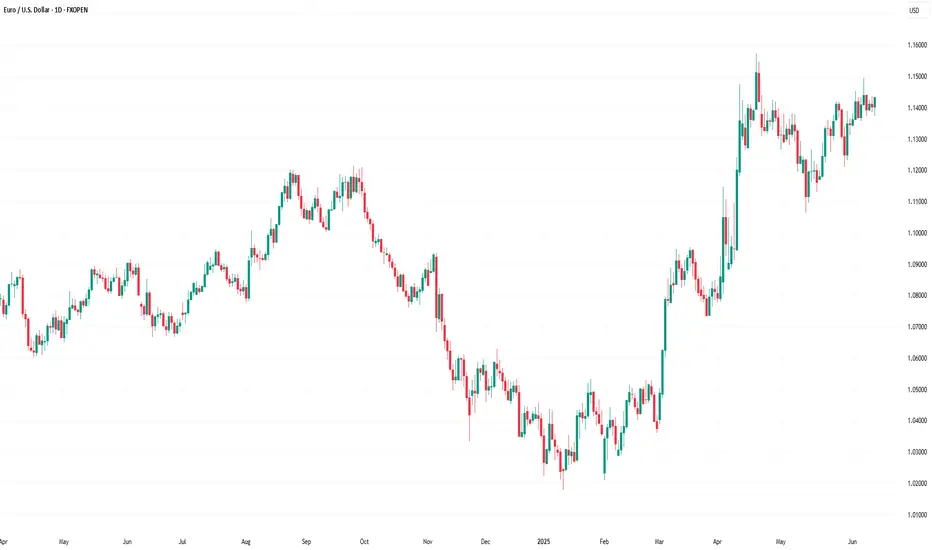
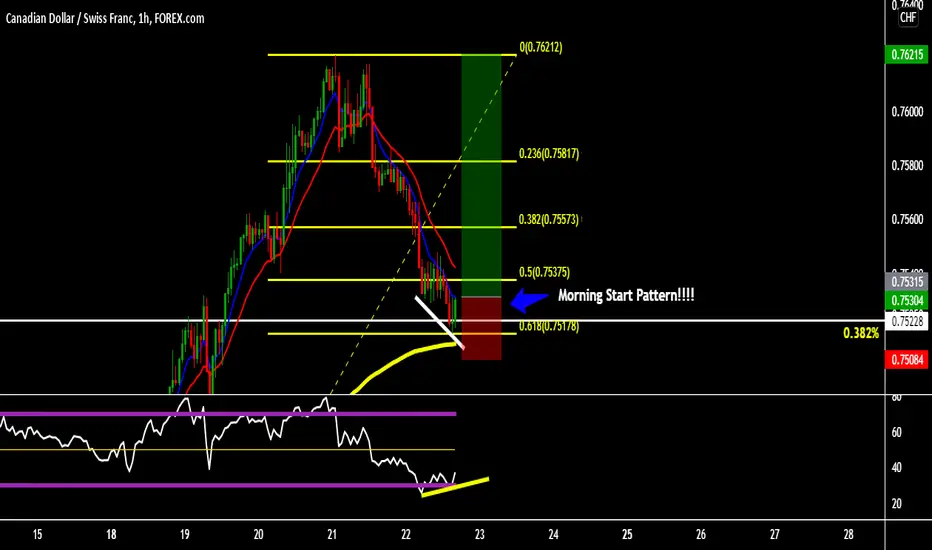
CAD/CHF: Morning Star CandlestickCanadian Dollar/Swiss Franc forming a morning Star Candlestick Pattern in the price action in H1 timeframe.
I zoom up to watch very good the candlestick pattern in this it's a bullish signal to buy CAD.
Also for reference, you can to look in 30 minutes timeframe (scalping) that we forming a good zone to buy right now and also this bullish divergence that we see in this timeframe 30 minutes and also in H1 we could to appreciate some in the RSI in H1. You will need to learnd how to read the price action in the trading chart, and more in Forex market when this market it's very manipulative.
Now, to enter in the deep analysis, in H4 timeframe I draw the fibonacci level and CAD touch the 0.382% and make support as we see in H1 timeframe in the price action what happen now. Also for reference, I have a plan to update my previously par EUR/JPY what I made an analsyis that this could to happen when reach the 0.382% to take in note in Euro/Yen Japanese to predict their future to know what will happen with precision.
Also, this it's the Daily timeframe and I draw too a fibonacci and we have that CAD reached the 0.382% with chance to buy in that zone to watch in H1 timeframe.
Good luck in this posiiton, I will open when the market making the open the doors to put a buy market in the price and SL to $0.7508 CHF (23 pips) and potential target to hit $0.7621 CHF (90 pips) what I look a chance of Fibonacci confluence to entry in the best and perfect zone to buy
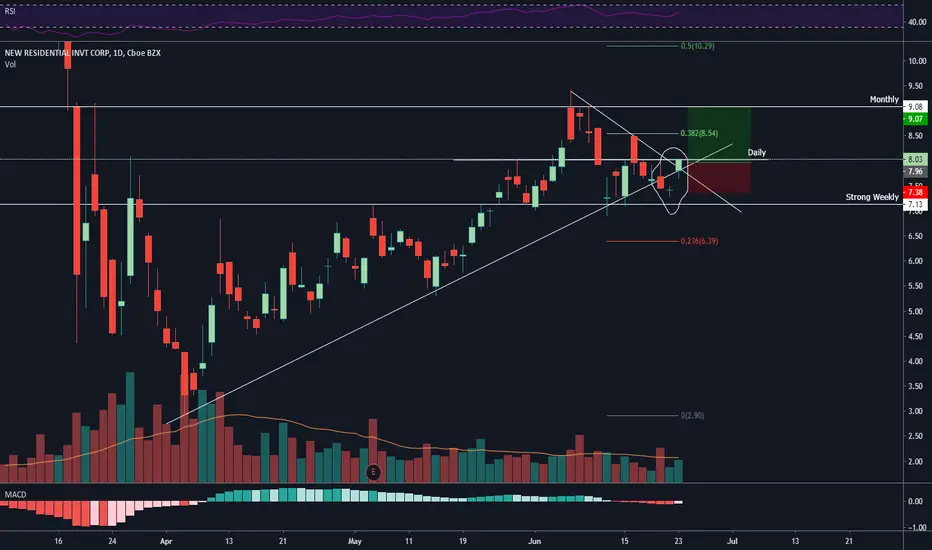
NRZ Morning star1. Morning star pattern is formed in daily chart. You can also see increasing volume.
2. Broke triangle upwards.
3. RSI has room and MACD started turning bullish.
Im only risking 1% since NRZ didn't break the daily level yet.
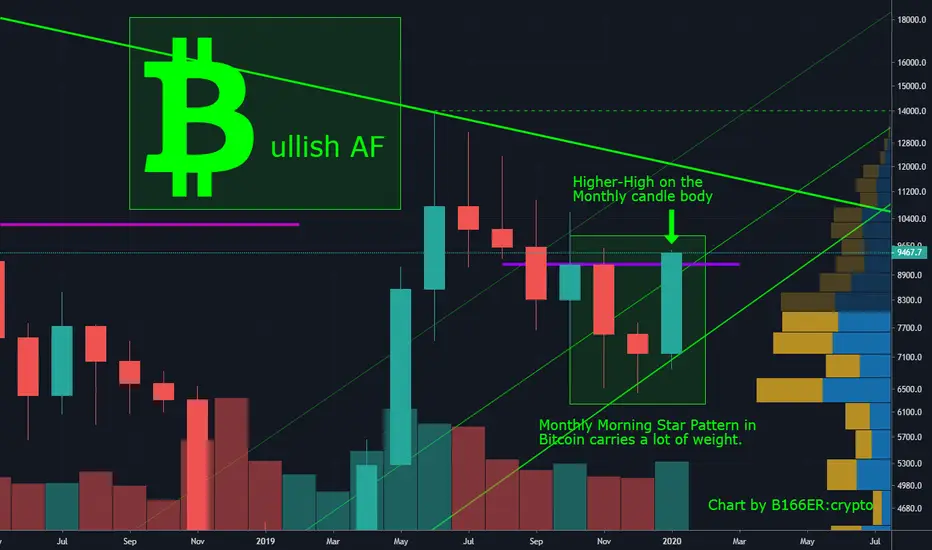
Bitcoin Morning Star Pattern + HH on Monthly Candle Body CloseI saw an article on the total crypto market cap that mentioned these. I agree so I'm adding them to all of the bullish evidence I see in the Bitcoin chart. This is all pointing to the fact that Bitcoin has reversed trends from bearish to bullish. The monthly morning star in conjunction with a hammer candle is quite bullish.
January's candle looks to be engulfing the two previous month's candles. If you don't think that's bullish AF then you're just being obstinate. We're about to leave the 8K region and NEVER return. Due to the parabolic adoption curve it's already extremely probable that you will never see a sub-7K Bitcoin and it's starting to look like you probably won't see sub-8K Bitcoin ever again as well.
The article mentions 10 factors confirming that the bulls are back in charge. Bitcoin's Monthly chart is EXTREMELY POWERFUL. It makes clear that which is obfuscated in the noise of the shorter time frames.
www.newsbtc.com
I have identified DOZENS of pieces of evidence that show without a doubt that having a bullish bias right now is the way to profitability.
Not financial advice. I hope these ideas help support your own analysis.
Peace, Love, & Crypto,
B166ER