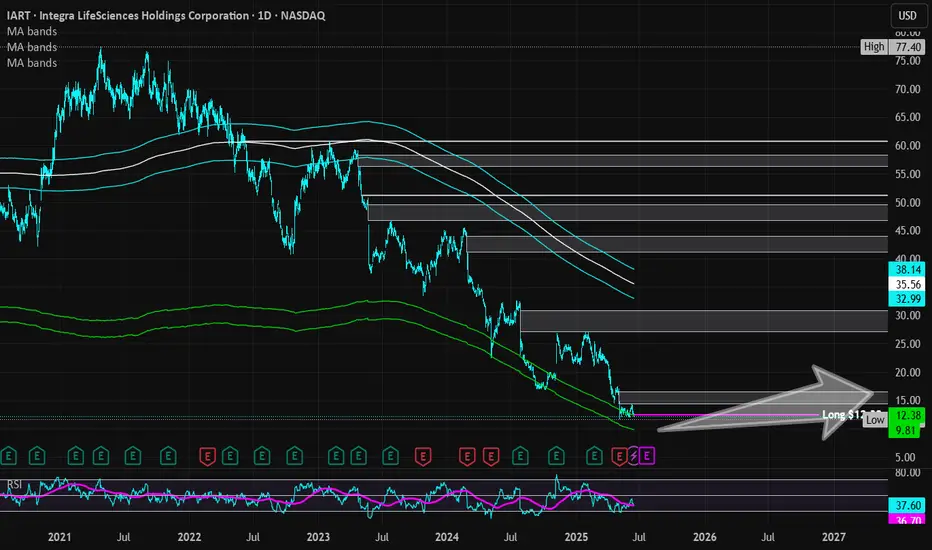
Integra LifeSciences Holdings | IART | Long at $12.39Integra LifeSciences Holdings Corp NASDAQ:IART manufactures and sells surgical instruments, neurosurgical products, and wound care solutions for neurosurgery, neurocritical care, otolaryngology, orthopedics, and general surgery. The stock has fallen over the past few years due to earnings misses / lowered earnings per share guidance, slow revenue growth, and operational challenges / recalls. But the company has been around since 1989 (endured many ups and downs during that time), has over 4,000 employees, a book value near $20 (undervalued), a forward price-to-earnings between 6x-9x (depending on the source), and revenue growth beyond 2025 and into 2028. Debt is slightly high with a debt-to-equity ratio of 1.2x and a quick ratio near 0.8x (company may have difficulty meeting its short-term obligations with its most liquid assets), it is thus a risky play. But the valuation and potential turnaround should get some attention.
From a technical analysis perspective, the stock price has entered and exited my "crash" simple moving average area 3 times now (see green lines). While I think $10 is likely in the near-term, it appears the stock *may* be forming a bottom - especially given the book value is more than 60% from the current price. But, as always, medical device stocks are always a major investment risk, so due diligence is needed.
Thus, at $12.39, NASDAQ:IART is in a buy zone with a note regarding the potential for a dip near $10 before a move up. Targets will be kept low for a swing trade.
Targets:
$15.00 (+21.0%)
$16.50 (+33.2%)
Moving Averages
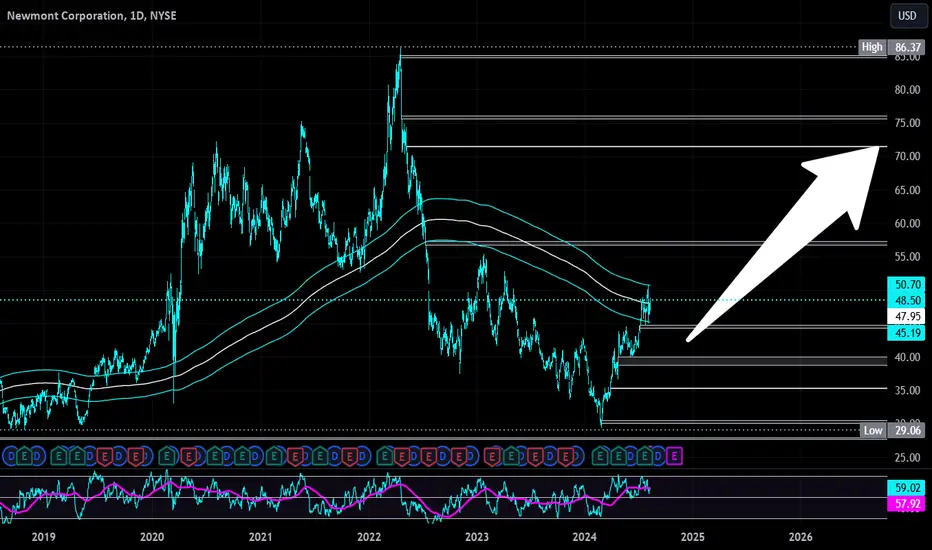
Newmont Corp | NEM | Long at $48.00While gold prices have soared recently, gold mining stocks have lagged. Newmont Corp NYSE:NEM , the world's largest gold mining corporation, may be undervalued if the miners take off to catch up to the gold demand/price. Currently sitting near $48.00 and at a historical moving average that it will need to break to show a true trend reversal, NYSE:NEM is in a personal buy zone. Now, the price may break down at the simple moving average and test the patience of shareholders, but the long game may benefit those who can tolerate the volatility.
Target #1 = $57.00
Target #2 = $71.00
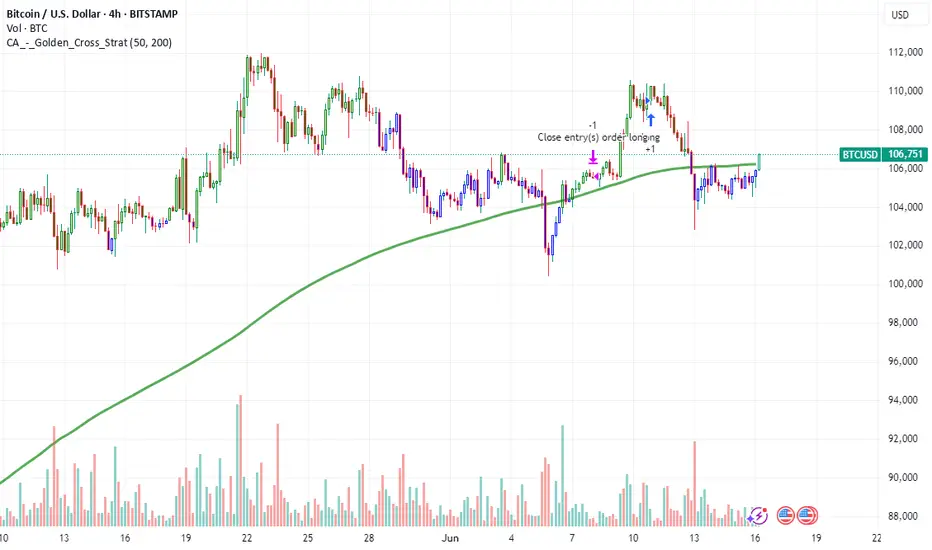
BTC “Golden Cross” Looms, but Geopolitics Could Delay ItBitcoin’s “Golden Cross” Looms, but Geopolitical Shocks Could Delay the Breakout
Deep dive into price action, derivatives, on-chain data, and the tug-of-war between Middle-East risk and crypto bull-run momentum
________________________________________
Table of Contents
1. Executive Summary
2. Scene-Setter: BTC at $105 K in a World on Edge
3. Technical Spark: What a Golden Cross Really Means
4. Price Action: From $103 K Dip to $106.8 K Hurdle
5. Options Market: A Sudden Lurch Toward Puts
6. Macro Overhang: Why Israel–Iran Turmoil Matters to Bitcoin
7. On-Chain Pulse: 656 % Cycle Gain, Yet Supply Is Tighter Than 2021
8. Mining Fundamentals: Difficulty Eases, Margins Improve
9. Corporate Treasuries: The Quiet, Sticky Bid
10. Targets & Scenarios: $97 K Downside vs. $229 K Upside
11. Strategy Playbook for Traders & Investors
12. Conclusion: Delayed, Not Derailed
13. Disclaimers
________________________________________
1. Executive Summary
• Bitcoin (BTC) is trading in a tight $103 K–$108 K band, unable to confirm a breakout as Middle-East tensions push investors into hedging mode.
• A Golden Cross—the 50-day SMA crossing above the 200-day—could flash within 10 trading sessions, historically adding +37 % median upside over the subsequent 90 days.
• Options flow has flipped decisively toward puts, with the 25-delta skew hitting –10 %, its most bearish since the FTX collapse, signaling short-term anxiety even as long-term bets remain bullish.
• On-chain metrics (exchange balances at six-year lows, HODLer supply at all-time highs) reveal structural demand; Glassnode notes a 656 % cycle advance despite a trillion-dollar market cap.
• Analysts’ upside targets range from $140 K (Q3) to $270 K (October) and even $229 K based on the Golden Cross fractal. Yet a clean break of $104 K support opens room to $97 K first.
________________________________________
2. Scene-Setter: BTC at $105 K in a World on Edge
Bitcoin entered 2025 with a blistering rally—spot ETFs hoovered nearly 200 K coins in four months, miners sold aggressively into strength, and macro tailwinds (Fed easing, USD weakness) fueled risk appetite. Then two macro curveballs hit:
1. Sticky U.S. core inflation revived “higher-for-longer” rate fears.
2. Israel–Iran hostilities spooked global markets, sending Brent crude to $76 and sparking a dash for USD liquidity.
BTC, once heralded as “digital gold,” behaved like a high-beta tech stock: it slipped 7 % in 48 hours, tagging $103,200 before bargain hunters stepped in. As of this writing, price sits near $105,800—right on the 100-hour SMA. Whether we escape the range depends on which force proves stronger: geopolitical dread or the long-term structural bid.
________________________________________
3. Technical Spark: What a Golden Cross Really Means
A Golden Cross occurs when the 50-day simple moving average (SMA-50) crosses above the 200-day (SMA-200). In Bitcoin’s 14-year history, we have logged nine such events:
Year Days to Cross 90-Day Return 180-Day Return
2013 51 +88 % +202 %
2015 73 +34 % +67 %
2019 46 +193 % +262 %
2020 38 +77 % +112 %
2023 59 +29 % +48 %
Median 90-day gain: +37 %
Median drawdown post-cross: –12 %
We are ~$700 shy of triggering the cross (SMA-50 at $97.9 K, SMA-200 at $98.1 K and rising). Assuming volatility stays muted, the lines converge within two weeks, potentially firing a widely watched buy signal. But remember: the cross is lagging; smart traders anticipate, not react.
________________________________________
4. Price Action: From $103 K Dip to $106.8 K Hurdle
Key intraday levels (Kraken feed):
• Support 1: $104,000 – prior weekly low + bullish order-block
• Support 2: $101,200 – 0.786 Fib retrace of the Feb–Mar impulse
• Bear Pivot: $97,000 – 200-day EMA + high-confluence volume node
• Resistance 1: $106,800 – last week’s swing high; three failed probes
• Resistance 2: $108,500 – May monthly open
• Bull Pivot: $113,000 – neckline of the March distribution range
Monday’s bounce broke a declining trend-line from $110 K, printing a higher low—constructive, yet bulls require a daily close >$106.8 K to invalidate the short-term bearish structure.
________________________________________
5. Options Market: A Sudden Lurch Toward Puts
Deribit data (largest BTC options venue):
• Put/Call Ratio: 0.62 last Friday → 0.91 today
• 25-Delta Skew (1-month): –10 %, lowest since Nov-2022
• Max-Pain for April 26 expiry: $104 K (huge open interest)
Translation: traders rushed to buy protective puts as Iran war headlines crossed. Market-makers, short those puts, delta-hedged by shorting spot or perpetual futures, adding downward pressure—classic gamma feedback loop.
Yet term structure remains contango; June and September IVs price higher topside. Institutions appear to sell near-dated panic, accumulate long-dated calls—a bullish medium-term stance.
________________________________________
6. Macro Overhang: Why Israel–Iran Turmoil Matters to Bitcoin
1. Risk-Off Correlation: Despite “digital gold” narratives, BTC’s 30-day correlation with the Nasdaq-100 sits at 0.64; equities slide → crypto follows.
2. USD Liquidity Drain: War premium lifts oil, stoking inflation and forcing the Fed to delay cuts; higher real yields pressure non-yielding assets.
3. Regulatory Optics: Heightened national-security chatter emboldens lawmakers keen to scrutinize crypto, a perceived sanctions-evasion channel.
4. Regional Flows: The Middle-East hosts some of the largest sovereign-wealth pools; risk aversion could pause their crypto allocations.
5.
Hence, every missile headline becomes a volatility catalyst. Still, flash-risk events fade quickly if energy supply stays intact, offering windows for BTC to re-assert its secular trend.
________________________________________
7. On-Chain Pulse: 656 % Cycle Gain, Yet Supply Is Tighter Than 2021
Glassnode frames Bitcoin’s ongoing bull as “one of the most explosive relative to market cap gravity.” Highlights:
• Cycle Return: 656 % from the $14 K November-2022 bottom—impressive given the asset is now >$2 T in free-float value, dwarfing 2017’s sub-$100 B base.
• Exchange Balances: Just 2.02 M BTC on centralized venues—13-year low.
• Realized Price (short-term holders): $92,500—suggests marginal buyers remain well in profit.
• Entity-Adjusted Dormancy Flow: At 275 K BTC/day vs. 2021’s 550 K—implying HODLers are less willing to spend.
Put simply: even after a seven-fold rally, supply scarcity persists.
________________________________________
8. Mining Fundamentals: Difficulty Eases, Margins Improve
The April 20 adjustment saw difficulty dip 1.2 %, the first contraction since January. Why it matters:
• Post-Halving Breathing Room: Block subsidy fell to 1.5625 BTC; a difficulty rollback cushions miner profit margins, lowering forced selling risk.
• Hashrate Plateau: Network hashrate hovers at 640 EH/s, only 3 % off the ATH—miners remain confident.
• Transaction Fees: Average fee per block = 0.37 BTC, still elevated by historical standards thanks to BRC-20 activity.
Miners thus appear cash-flow stable, reducing downside pressure on spot markets compared to previous post-halving eras.
________________________________________
9. Corporate Treasuries: The Quiet, Sticky Bid
Since MicroStrategy cracked the dam, 68 public companies now hold BTC on balance sheets, totaling 412,000 coins (~$43 B). Recent newcomers:
Company Purchase Date BTC Added Avg Cost
SemiconX Feb-2025 2,500 $94,800
Nordic Logistics Mar-2025 800 $98,200
Atlantech Energy Apr-2025 1,200 $101,500
Traits of corporate treasuries:
• Long-Dated Liabilities: Align with Bitcoin’s four-year halving cadence.
• Low Turnover: None of the 68 have sold core holdings despite 80 % drawdowns in 2022.
• Regulatory Transparency: SEC filings broadcast purchases, inviting copycat demand.
This sticky bid stabilizes spot markets during macro squalls.
________________________________________
10. Targets & Scenarios: $97 K Downside vs. $229 K Upside
Bearish Path (30 % probability)
• Trigger: Israel–Iran broadens, Fed signals no cuts in 2025.
• Price Action: Break $104 K, bulls capitulate at $97 K (200-day).
• Depth: Could wick to $88–90 K (0.618 retrace) if macro gloom persists.
Base Case (50 % probability)
• Trigger: Skirmishes contained; oil cools, Fed cuts twice by December.
• Price Action: Golden Cross confirms, BTC grinds to $128 K by September.
• Highs: $140 K tap as ETF inflows resume.
Bullish Path (20 % probability)
• Trigger: Middle-East cease-fire + ETF FOMO round two + dovish Fed pivot.
• Fractals: Prior Golden-Cross extensions averaged +120 % at extreme.
• Price Action: $150 K by summer, $229 K (Fib 2.618 from 2022 low) by year-end.
• Blow-Off: $270 K October spike before the next cyclical bear begins.
________________________________________
11. Strategy Playbook for Traders & Investors
Horizon Bias Instruments Risk Management
Intraday (0–48 h) Range scalp $104–$107 K Perp futures (5× max), options gamma scalping Hard stop $103 K; position <1 % equity
Swing (2–8 wks) Buy pullbacks ahead of Golden Cross Spot, dated futures roll, 1-month $110 K calls Stop $97 K daily close; size 5–10 %
Position (3–6 mo) Accumulate for $140–150 K target Spot, June/Sept call spreads ($120/150) Hedge via 25 % put collar
Long-Term (1–4 yr) Maintain core stash; ignore noise Cold storage, DCA Re-balance only when price doubles
Optional hedge: Long Gold / Short BTC ratio spread as a geopolitical shock absorber; ratio 1.3 currently, mean-reverts to 1.1 post-crises.
________________________________________
12. Conclusion: Delayed, Not Derailed
Bitcoin stands at a crossroads: a textbook Golden Cross beckons, ETF inflows smolder, miners relax, and corporate treasuries drip-feed demand. Yet war headlines and a cautious options market act as sandbags on the balloon. History says macro shocks slow, not stop secular bull cycles. Unless Middle-East conflict strangles global liquidity or the Fed slams the brakes far harder than priced, BTC’s higher-time-frame structure remains bullish. Expect turbulence, embrace risk controls—but don’t mistake a weather delay for a busted engine.
________________________________________
13. Disclaimers
This article is for educational purposes only and does not constitute financial advice. Cryptocurrency investing involves substantial risk; never invest more than you can afford to lose.
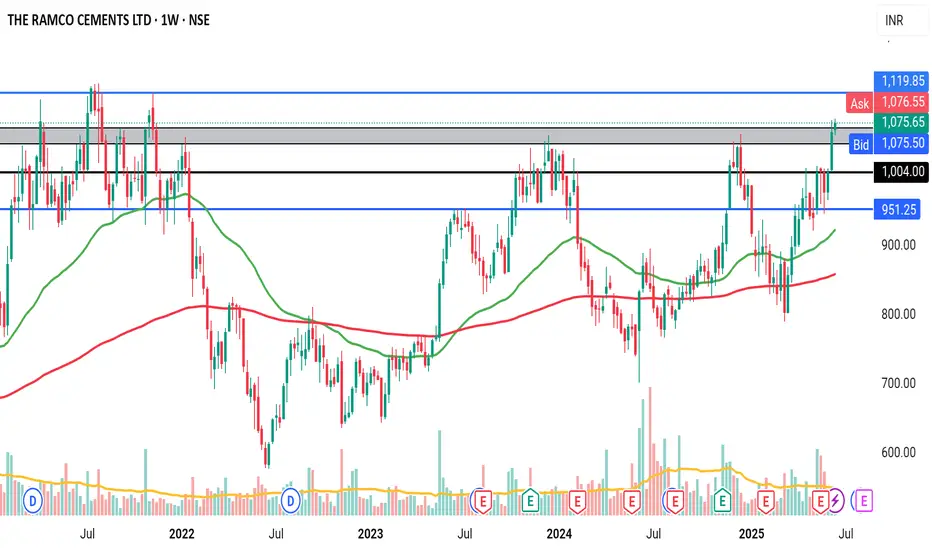
Bulls entering cementClear breakout, crossed 50EMA, crossed strong resistance with good volume and big green candle. Has potential to break ATH.
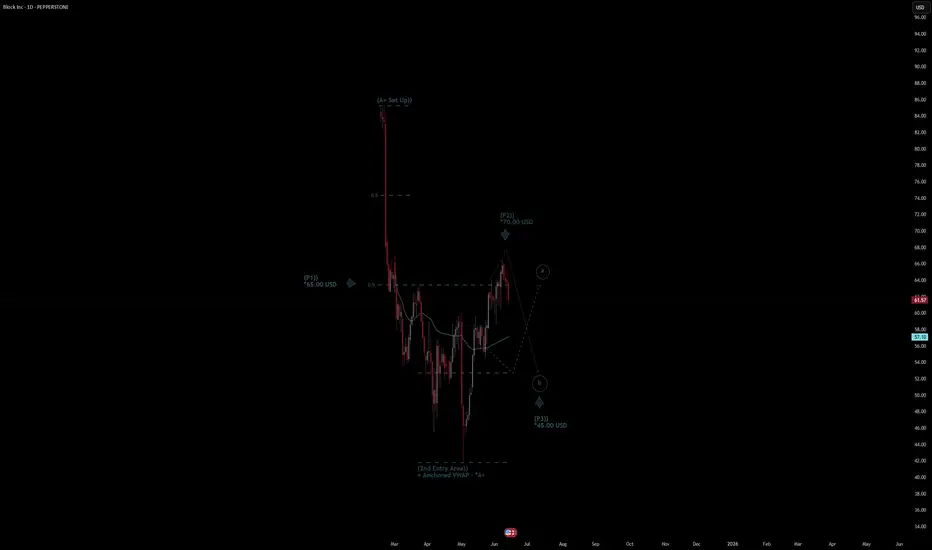
Block Inc Stock Quote | Chart & Forecast SummaryKey Indicators On Trade Set Up In General
1. Push Set Up
2. Range Set Up
3. Break & Retest Set Up
Notes On Session
# Block Inc Stock Quote
- Double Formation
* (A+ Set Up)) At 85.00 USD | Completed Survey
* (2nd Entry Area)) + Anchored VWAP - *A+ | Subdivision 1
- Triple Formation
* (P1)) / (P2)) & (P3)) | Subdivision 2
* (TP1) = a / Long Consecutive
* (TP2) = b / Short Consecutive | Subdivision 3
* Daily Time Frame | Trend Settings Condition
- (Hypothesis On Entry Bias)) | Regular Settings
- Position On A 1.5RR
* Stop Loss At 67.00 USD
* Entry At 61.00 USD
* Take Profit At 52.00 USD
* (Downtrend Argument)) & No Pattern Confirmation
* Ongoing Entry & (Neutral Area))
Active Sessions On Relevant Range & Elemented Probabilities;
European-Session(Upwards) - East Coast-Session(Downwards) - Asian-Session(Ranging)
Conclusion | Trade Plan Execution & Risk Management On Demand;
Overall Consensus | Sell
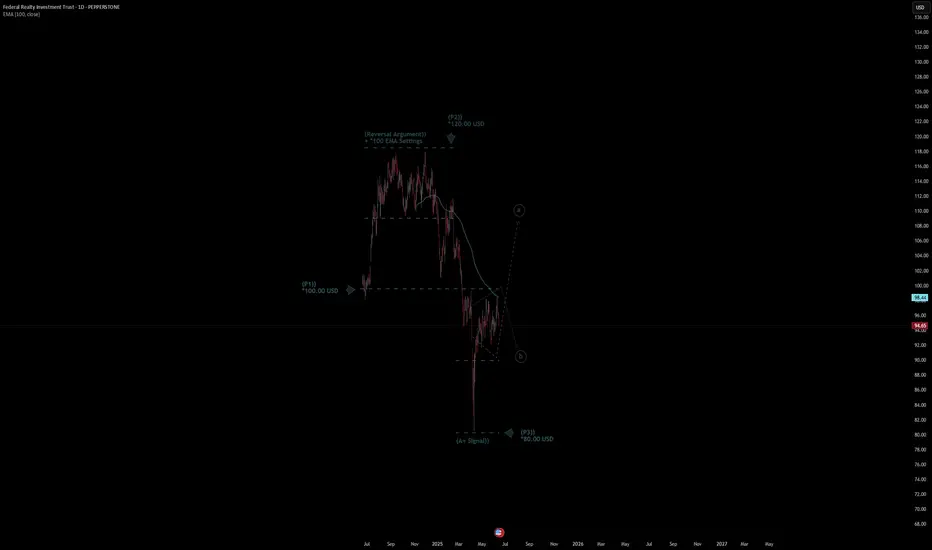
Federal Realty Trust Quote | Chart & Forecast SummaryKey Indicators On Trade Set Up In General
1. Push Set Up
2. Range Set Up
3. Break & Retest Set Up
Notes On Session
# Federal Realty Trust Quote
- Double Formation
* (Reversal Argument)) At 120.00 USD | Completed Survey
* (A+ SIgnal)) - *Swing Low | Subdivision 1
- Triple Formation
* (P1)) / (P2)) & (P3)) | Subdivision 2
* (TP1) = a / Long Consecutive
* (TP2) = b / Short Consecutive | Subdivision 3
* Daily Time Frame | Trend Settings Condition
- (Hypothesis On Entry Bias)) | Regular Settings
- Position On A 1.5RR
* Stop Loss At 87.00 USD
* Entry At 95.00 USD
* Take Profit At 105.00 USD
* (Neutral Argument)) & No Pattern Confirmation
* Ongoing Entry & (Neutral Area))
Active Sessions On Relevant Range & Elemented Probabilities;
European-Session(Upwards) - East Coast-Session(Downwards) - Asian-Session(Ranging)
Conclusion | Trade Plan Execution & Risk Management On Demand;
Overall Consensus | Neutral
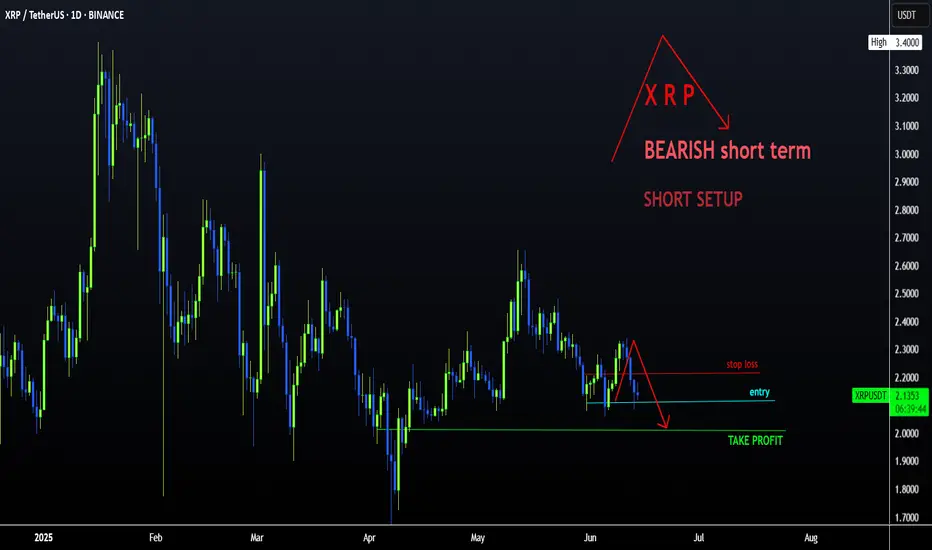
XRP | SHORT CRIPPLE to $2XRP is currently trading BEARISH, since we're seeing a trade right on top of the current support level.
The more times a support level is testes, the weaker it becomes. Therefore, the current support may break and then it's a free-fall to $2.
Additionally, with the price trading UNDER the moving averages in the 4h, we can confirm a bearish sentiment from a technical indicator perspective.
With a fairly tight SL, and a modest TP, the risk is low with this short setup:
___________________
BINANCE:XRPUSDT
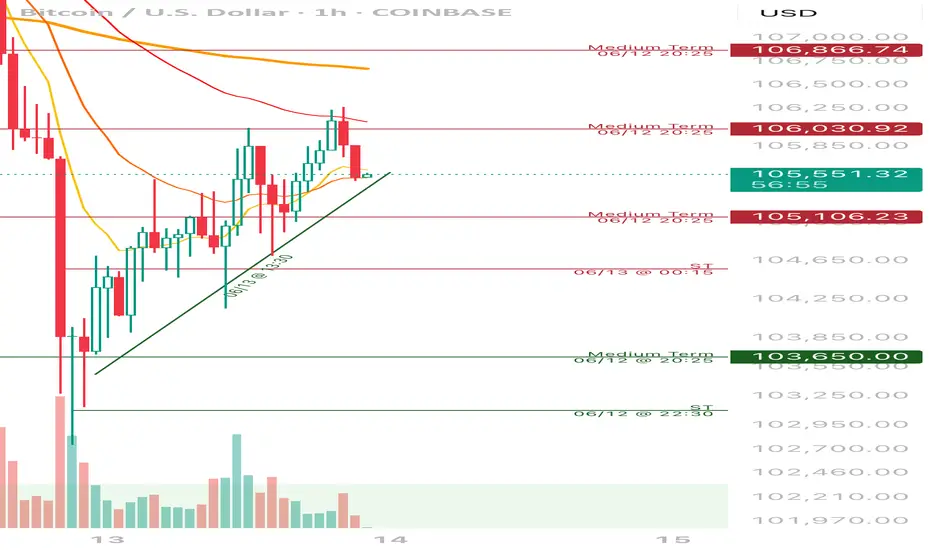
Range Bound Before BreakoutDaily: Nice hold on the reversal candle @50 EMA, 103k Support and strong FVG.
Nice volume to support this move when the drop was somewhat due to the attacks involving Israel and Iran.
-We are seeing a slightly lower high and a rejection from that 110 lvl. But as I said on the weekly, w/o a catalyst I think we’ll continue to bounce within the 100-110 range for a bit longer.
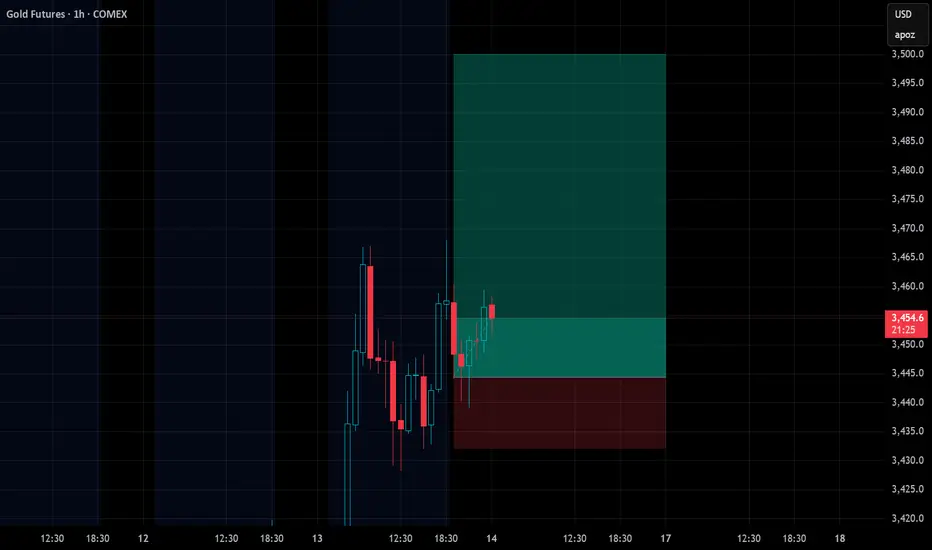
I'm Buying!Price will go above 3500 just don't know how much. I want to play safe, 1st target @3500. As our 2nd target accomplishes we'll take reverse position on the possible top.
GoPro | GPRO | Long at $1.35NASDAQ:GPRO is a strong brand name, but with a dying userbase / lack of growth. The company has no major turnaround planned, but the chart is interesting. The stock seems to be currently consolidating as the historical simple moving average (white line) is working its way down toward the price - which often leads to a jump. Another candidate for the Santa Claus rally? Or, will the "value" lead to an acquisition? Nothing is guaranteed, but something may be brewing. While not a long-term "buy and hold" candidate for me (personally, unless the business changes or growth seems relevant), it looks very intriguing from a technical analysis perspective. Thus, at $1.35, NASDAQ:GPRO is in a personal buy zone.
Target #1: $1.70
Target #2: $2.00
Target #3: $2.50
Target #4: $2.88 (if some good news emerges...)

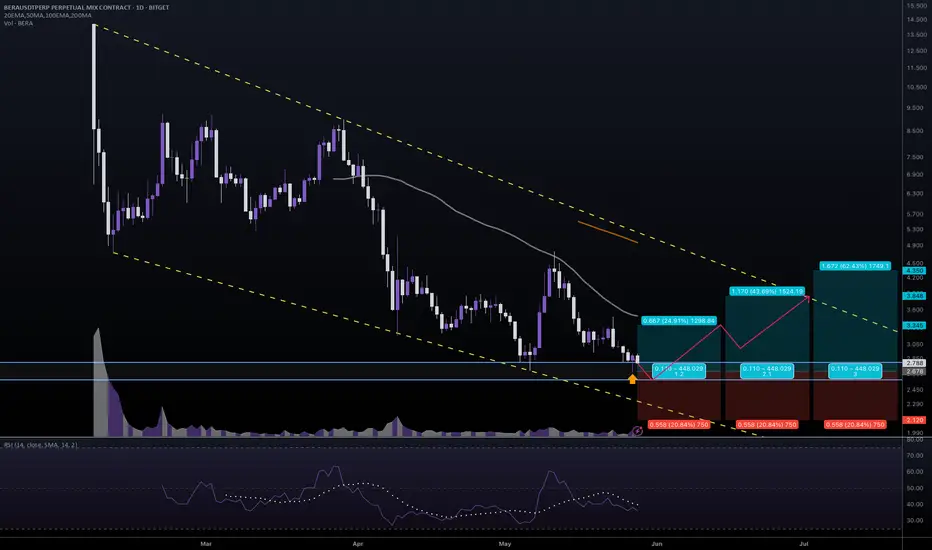
#BERAUSDT #1D (Bitget Futures) Descending wedge on supportBeraChain printed a bullish hammer that may have marked a double bottom here on daily.
Reversal seems around the corner, revisiting 50MA & 100EMA resistances would make sense.
⚡️⚡️ #BERA/USDT ⚡️⚡️
Exchanges: Bitget Futures
Signal Type: Regular (Long)
Leverage: Isolated (2.0X)
Amount: 4.8%
Entry Zone:
2.798 - 2.558
Take-Profit Targets:
1) 3.345
2) 3.848
3) 4.350
Stop Targets:
1) 2.120
Published By: @Zblaba
CRYPTOCAP:BERA BITGET:BERAUSDT.P #1D #BeraChain berachain.com
Risk/Reward= 1:1.2 | 1:2.1 | 1:3.0
Expected Profit= +49.8% | +87.4% | +124.9%
Possible Loss= -41.7%
Estimated Gaintime= 1-2 months
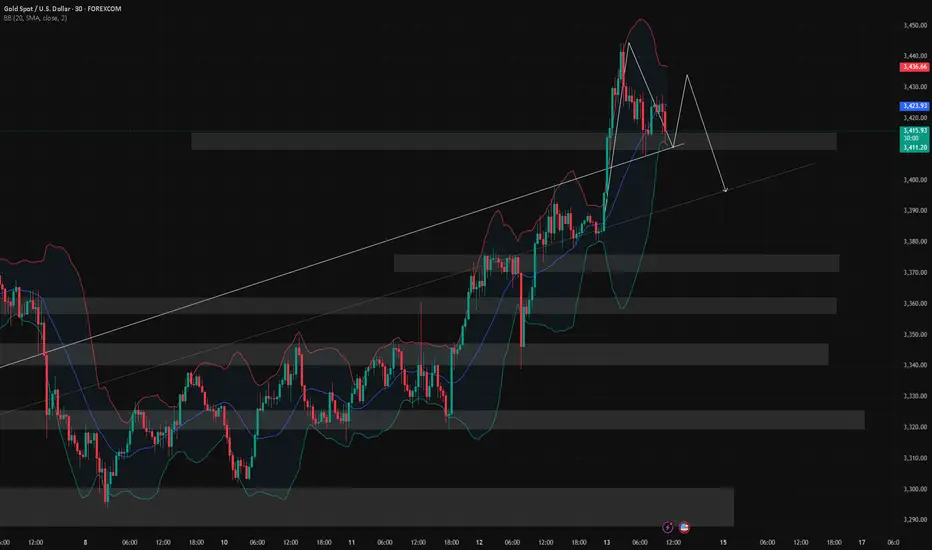
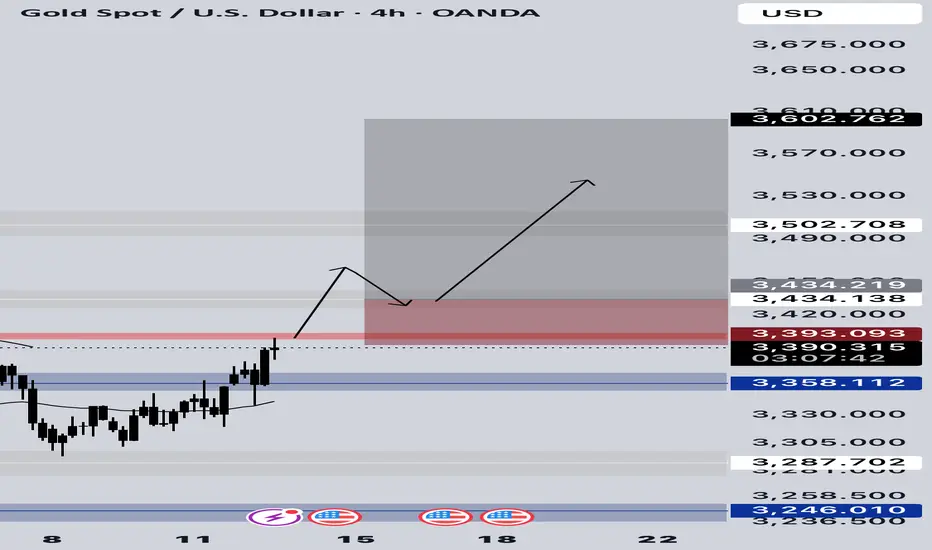
Watch Out for Weekly-Level ResistanceAs news of Israel's strike on Iran’s nuclear facility continues to spread, a surge in risk-off sentiment has driven noticeable gains across safe-haven assets. The escalation of tensions in the Middle East has clearly become a key trigger for current market sentiment. Should the conflict intensify further, oil and other safe-haven assets may see continued upside; conversely, if tensions ease, the retreat of risk aversion could lead to price corrections.
From a technical perspective, gold is currently facing downward pressure from the weekly trendline. If geopolitical tensions persist, gold may potentially rally toward the 3500–3550 range. However, without stronger fundamental support, a significant correction could follow once that level is reached.
On the intraday chart, the price has now broken below the middle Bollinger Band on the 30-minute timeframe and is near lower band support around 3413. MACD and moving average alignment suggest there may still be room to test the 3396–3388 trend support zone. The 1-hour chart remains in a consolidation phase, and while a short-term rebound is possible, selling at higher levels appears to be the safer strategy for today.
As it is Friday and given the geopolitical uncertainties, the potential for weekend risk is significantly higher. It is recommended to reduce exposure before the market closes. If you choose to hold positions over the weekend, be sure to set appropriate stop-losses to mitigate unexpected developments.
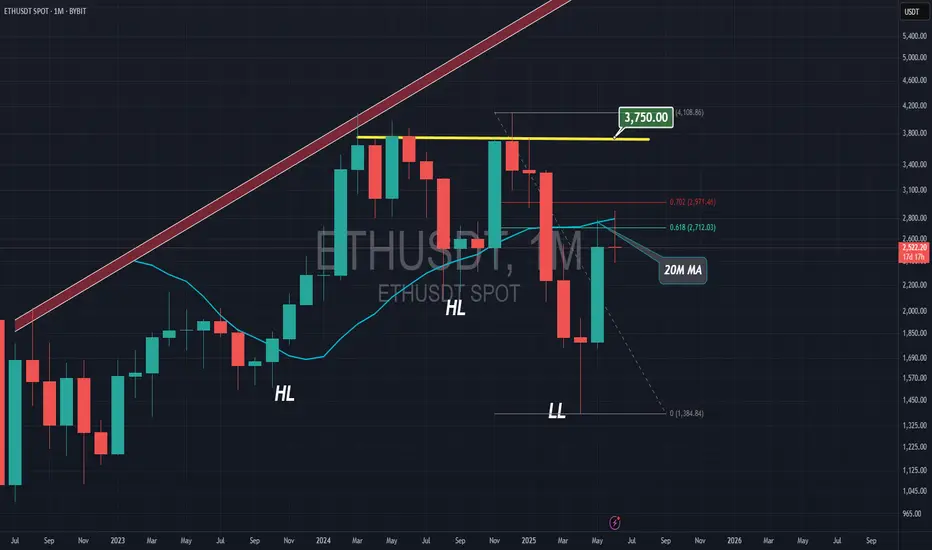
Ethereum VS $2800The 20MA on monthly timeframe for Ethereum is still working as a strong resistance, and Ethereum is running out of time to break it.
Maximum June or July..
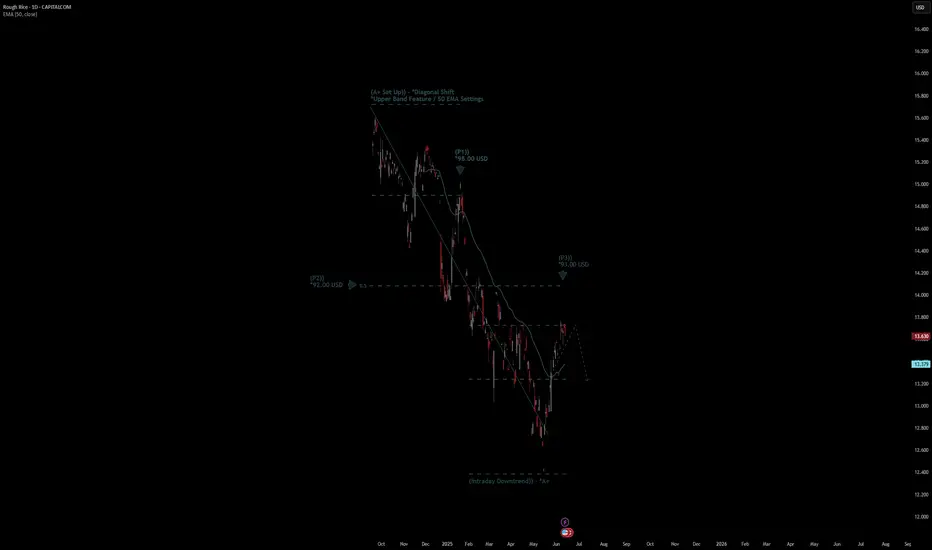
Rough Rice Commodity Quote | Chart & Forecast SummaryKey Indicators On Trade Set Up In General
1. Push Set Up
2. Range Set up
3. Break & Retest Set Up
Notes On Session
# Rough Rice Commodity Quote
- Double Formation
* (A+ Set Up)) - *Diagonal Shift | Completed Survey
* (Intraday Downtrend)) - *A+ | Subdivision 1
- Triple Formation
* (P1)) / (P2)) & (P3)) | Subdivision 2
* (TP1) | Subdivision 3
* Daily Time Frame | Trend Settings Condition
- (Hypothesis On Entry Bias)) | Indexed To 100
- Position On A 1.5RR
* Stop Loss At 90.00 USD
* Entry At 89.00 USD
* Take Profit At 86.00 USD
* (Downtrend Argument)) & No Pattern Confirmation
* Ongoing Entry & (Neutral Area))
Active Sessions On Relevant Range & Elemented Probabilities;
European-Session(Upwards) - East Coast-Session(Downwards) - Asian-Session(Ranging)
Conclusion | Trade Plan Execution & Risk Management On Demand;
Overall Consensus | Sell
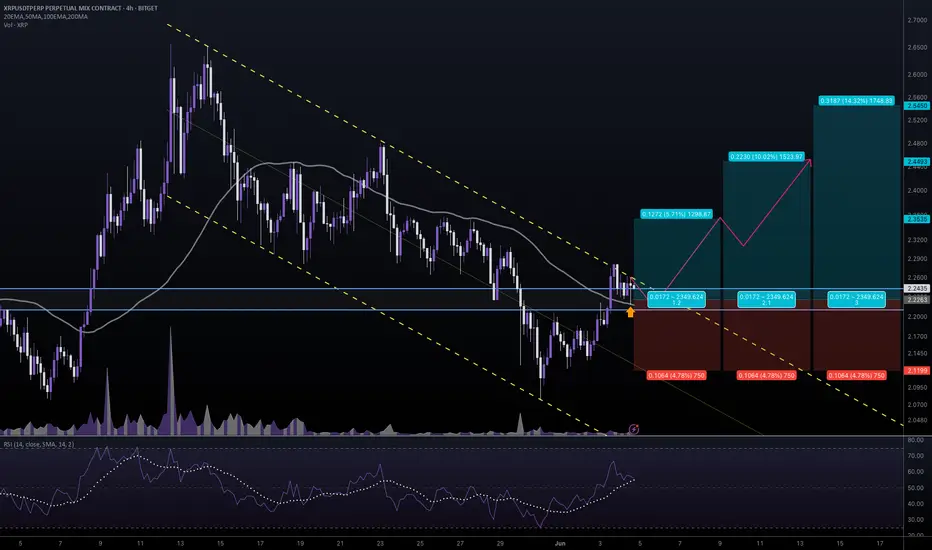
#XRPUSDT #4h (Bitget Futures) Descending channel near breakoutRipple just printed a dragonfly doji resting 50MA regained support, looks ready for short-term recovery.
⚡️⚡️ #XRP/USDT ⚡️⚡️
Exchanges: Bitget Futures
Signal Type: Regular (Long)
Leverage: Isolated (8.0X)
Amount: 5.2%
Entry Zone:
2.2438 - 2.2088
Take-Profit Targets:
1) 2.3535
2) 2.4493
3) 2.5450
Stop Targets:
1) 2.1199
Published By: @Zblaba
CRYPTOCAP:XRP BITGET:XRPUSDT.P #4h #Ripple #MadeInUsa xrpl.org
Risk/Reward= 1:1.2 | 1:2.1 | 1:3.0
Expected Profit= +45.7% | +80.1% | +114.5%
Possible Loss= -38.2%
Estimated Gaintime= 1-2 weeks
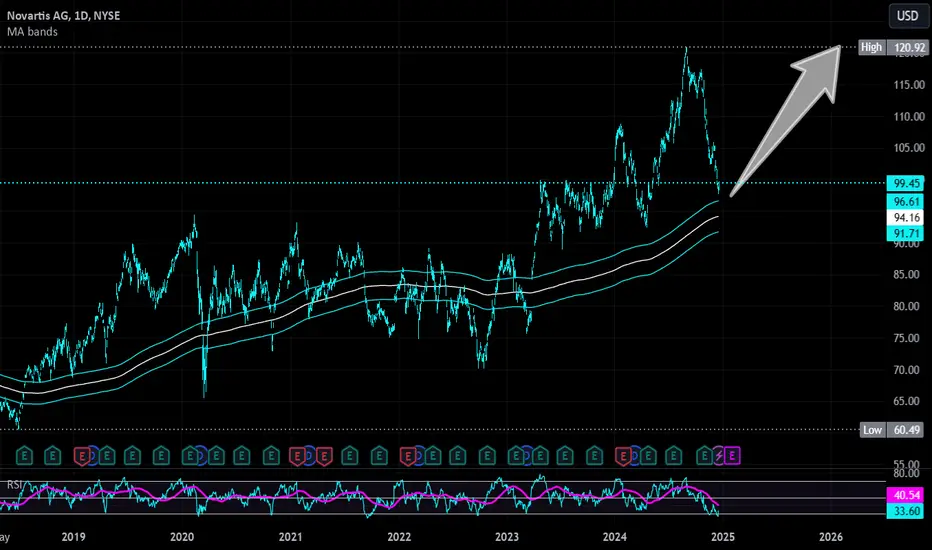
Novartis | NVS | Long at $99.00As one of the largest pharmaceutical companies in the world, Novartis NYSE:NVS is poised to grow well into 2027. It's trading at a 17x P/E, earnings are forecast to grow 7% per year, it has low debt, and has been raising its dividend over the past few years (3.8%). The price on the daily chart is nearing the historical simple moving average line and may be poised for another move up. However, entry into the lower $90's or even $80's is still not off the table and, in my view, a great opportunity. Thus, at $99.00, NYSE:NVS is in a personal buy zone.
Target #1 = $110.00
Target #2 = $120.00
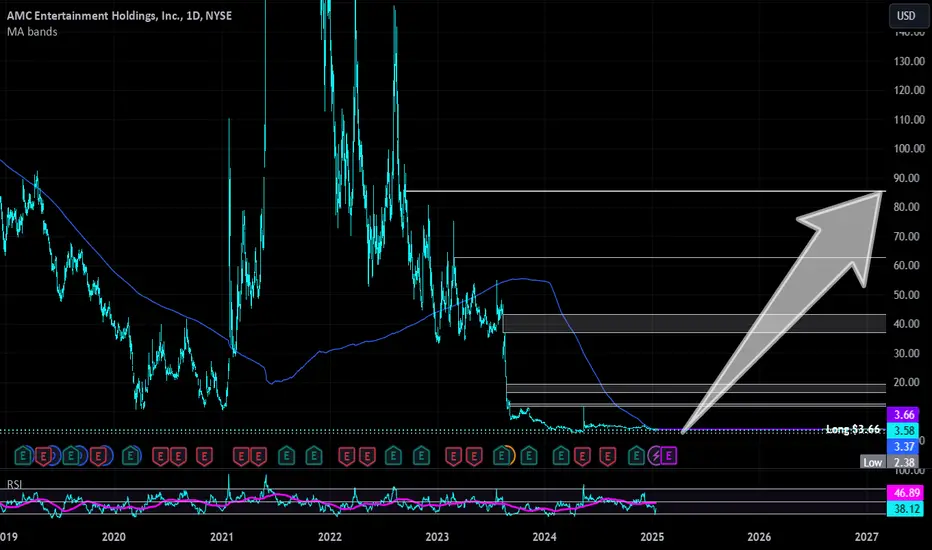
AMC Entertainment Holdings | AMC | Long at $3.66First, I'm not an " NYSE:AMC APE" and have zero interest in becoming one. Second, don't trade NYSE:AMC unless you are fully aware the investment could go to zero or the company may devalue your trade via share dilution or other means (i.e., don't simply do as I do or blindly follow anyone else's moves, for the matter).
With that aside, I started a position/gambling play today in NYSE:AMC at $3.66. The reason is 80% technical analysis and 20% fundamentals.
Technical Analysis:
The blue line on the chart represents an average true range (ATR) from a historical simple moving average (SMA) that I use for trading. For simplicity, the historical SMA is not show on the chart - just the ATR. This blue ATR line has historically been a major line of resistance and support. When it breaks through and holds, the stock goes bull - but history may not repeat. The price recently broke the blue ATR line, fell below, and the broke out again today. This may be a sign that the downward trend (overall) is changing - perhaps furthering the accumulation phase in the $3s or a gradual rise from here. And with today's breakout, I grabbed shares at $3.66.
Fundamentals
Since 2020, NYSE:AMC has shown major gains in revenue and net income (loss reduction, that is). Revenu: $1.24 billion (2020); $2.53 billion (2021); $3.91 billion (2022); 4.81 billion (2023); $4.4 billion (2024, Q1-3 only). Net Income: -$4.5 billion (2020); -$1.27 billion (2021); -$973 million (2022); -$396 million (2023); -$399 million (2024, Q1-3 only). The company is not expected to become profitable until Q4 of 2026 , but the improvements are what one would like to see.
Counter-arguments and statements the stock is junk are totally valid. But the chart is quite interesting as the company moves toward profitability (maybe...).
Targets:
$4.30
$6.00
Squeeze/mass hysteria: $18.00, $40.00, and ridiculousness: $85.00
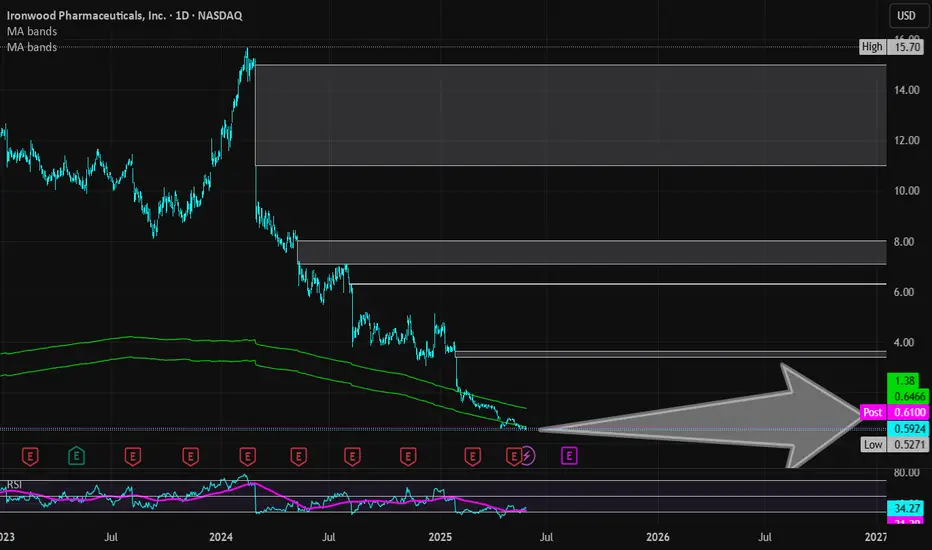
Ironwood Pharmaceuticals | IRWD | Long at $0.61Ironwood Pharma NASDAQ:IRWD stock dropped ~89% in the past year due to disappointing Phase 3 Apraglutide trial results, FDA requiring an additional trial, weak Q1 2025 earnings (-$0.14 EPS vs. -$0.04 expected), high debt ($599.48M), and analyst downgrades. So why would I be interested in swing trading this company? The chart. The price has entered my "crash" simple moving average zone, which often results in a reversal - even if temporary. Also, Linzess (GI drug) revenue is steady, and I thoroughly believe that alone pushes the fair value near $0.95, if not higher. Thus, at $0.61, NASDAQ:IRWD is in a personal buy zone with the potential for additional declines before future rise.
Target:
$0.95 (+55.7%)
BUYS PROJECTION OF XAUUSD Hey everyone good afternoon and yes this entry will be the one I will be executing yesterday own was good but this is much better after refining my charts again so I will be waiting for price to breakout 3434 zone and set up a buy limit to take buys to a new ATH the reason am interested on that zone is that anytime Gold gets to a strong zone either support or resistance price moves hugely and that zone is one of them so let’s see how it plays out….
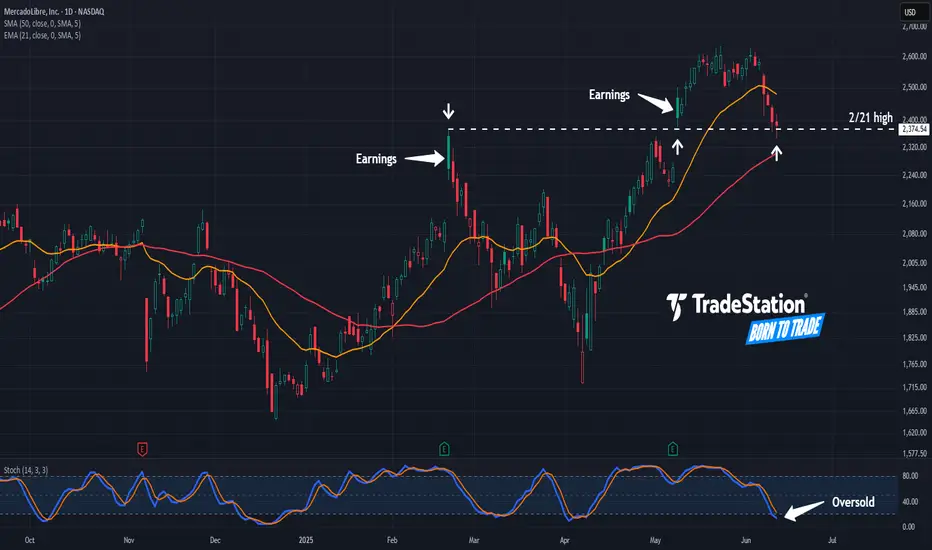
MercadoLibre Pulls BackMercadoLibre rallied to new highs last month, and some traders may see an opportunity in its latest pullback.
The first pattern on today’s chart is the $2,374.54 level. MELI first touched that price on February 21 after reporting strong earnings. The stock gapped above the level in May on another strong quarterly report and has now retested it. Will the old resistance emerge as new support?
Second, price gains after the last two quarterly reports may reflect positive fundamental sentiment in the Latin American e-commerce company.
Third, stochastics have dipped to an oversold condition.
Check out TradingView's The Leap competition sponsored by TradeStation.
TradeStation has, for decades, advanced the trading industry, providing access to stocks, options and futures. If you're born to trade, we could be for you. See our Overview for more.
Past performance, whether actual or indicated by historical tests of strategies, is no guarantee of future performance or success. There is a possibility that you may sustain a loss equal to or greater than your entire investment regardless of which asset class you trade (equities, options or futures); therefore, you should not invest or risk money that you cannot afford to lose. Online trading is not suitable for all investors. View the document titled Characteristics and Risks of Standardized Options at www.TradeStation.com . Before trading any asset class, customers must read the relevant risk disclosure statements on www.TradeStation.com . System access and trade placement and execution may be delayed or fail due to market volatility and volume, quote delays, system and software errors, Internet traffic, outages and other factors.
Securities and futures trading is offered to self-directed customers by TradeStation Securities, Inc., a broker-dealer registered with the Securities and Exchange Commission and a futures commission merchant licensed with the Commodity Futures Trading Commission). TradeStation Securities is a member of the Financial Industry Regulatory Authority, the National Futures Association, and a number of exchanges.
TradeStation Securities, Inc. and TradeStation Technologies, Inc. are each wholly owned subsidiaries of TradeStation Group, Inc., both operating, and providing products and services, under the TradeStation brand and trademark. When applying for, or purchasing, accounts, subscriptions, products and services, it is important that you know which company you will be dealing with. Visit www.TradeStation.com for further important information explaining what this means.
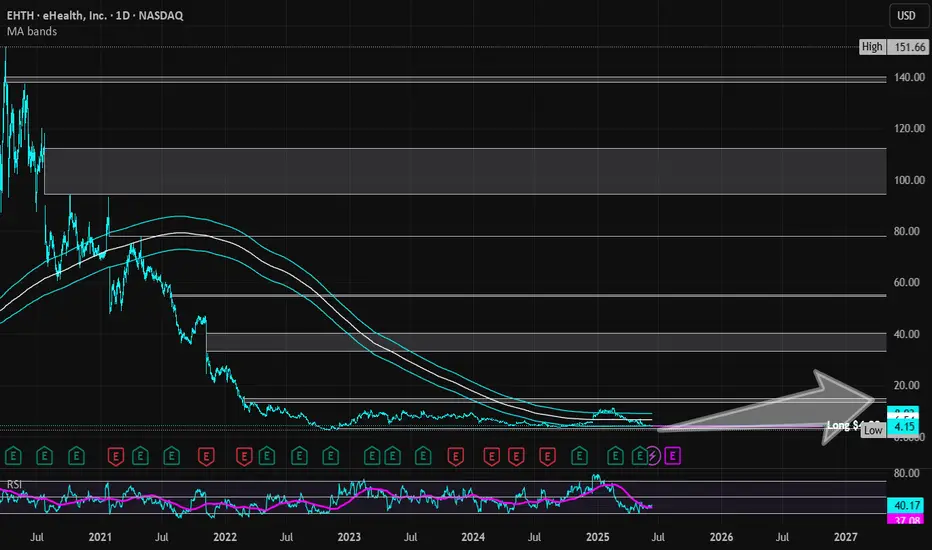
eHealth | EHTH | Long at $4.22eHealth NASDAQ:EHTH , the largest online private health insurance marketplace, may be undervalued. The book value is listed around $19 a share and it has a debt-to-equity of 0.07x (healthy), a quick ratio of 2.5 (strong liquidity, can cover liabilities), growing revenue since 2021 (over $500M in 2024), and insiders have recently bought shares/awarded options. However, profitability is still a concern, but the company is expected to be profitable by 2026. With the US's aging population and the need for affordable healthcare coverage, eHealth *may* standout as a major insurance marketplace... but time will tell.
From a technical analysis perspective, the stock price is near the bottom of its historical simple moving average. I do not doubt, however, that the stock may slip to cover the small price gap between $3.09 and $3.23 (which will be another entry point if fundamentals do not change). This stock may trade sideways for some time. But it has a 27M float and as we saw in 2014 and 2020, it can REALLY get going if buyers see the opportunity...
Thus, at $4.22, NASDAQ:EHTH is in a personal buy zone with more opportunity potentially near $3 in the future.
Targets:
$6.00 (+42.2%)
$8.00 (+89.6%)
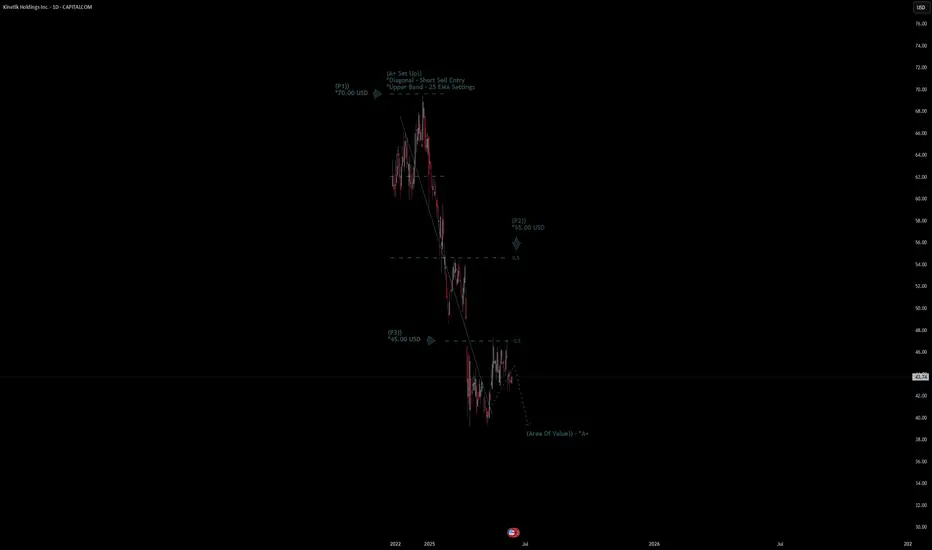
Kinetik Holdings Inc. Stock Quote | Chart & Forecast SummaryKey Indicators On Trade Set Up In General
1. Push Set Up
2. Range Set up
3. Break & Retest Set Up
Notes On Session
# Kinetik Holdings Inc. Stock Quote
- Double Formation
* (A+ Set Up)) Start At 70.00 USD | Completed Survey
* (Area Of Value)) Ending At 40.00 USD | Subdivision 1
- Triple Formation
* (P1)) / (P2)) & (P3)) | Subdivision 2
* (TP1) | Subdivision 3
* Daily Time Frame | Trend Settings Condition
- (Hypothesis On Entry Bias)) | Regular Settings
- Position On A 1.5RR
* Stop Loss At 48.00 USD
* Entry At 44.00 USD
* Take Profit At 37.00 USD
* (Downtrend Argument)) & No Pattern Confirmation
* Ongoing Entry & (Neutral Area))
Active Sessions On Relevant Range & Elemented Probabilities;
European-Session(Upwards) - East Coast-Session(Downwards) - Asian-Session(Ranging)
Conclusion | Trade Plan Execution & Risk Management On Demand;
Overall Consensus | Sell
NKE – EMA Crossover and Bullish Continuation PotentialNIKE (NKE) has completed a clean technical gap fill and is now showing early signs of a trend reversal.
🔍 Key Technical Factors:
✅ Gap Filled: The March-April gap was filled cleanly and held.
✅ EMA Crossover: EMA 9 crossed above EMA 21 → bullish short-term signal.
✅ RSI > 50: Momentum shifting bullish; RSI reclaiming territory above neutral.
✅ Volume Confirmation: Increasing activity during the breakout attempt.
🎯 Next Target: Gap to fill around $70.50
📈 Strategy Outlook:
If price closes above $64.00, this could trigger continuation toward the next gap.
Invalidation below $61.50 (EMA cluster and recent base).
