Freenet AG Quote | Chart & Forecast SummaryKey Indicators On Trade Set Up In General
1. Push Set Up
2. Range Set Up
3. Break & Retest Set Up
Notes On Session
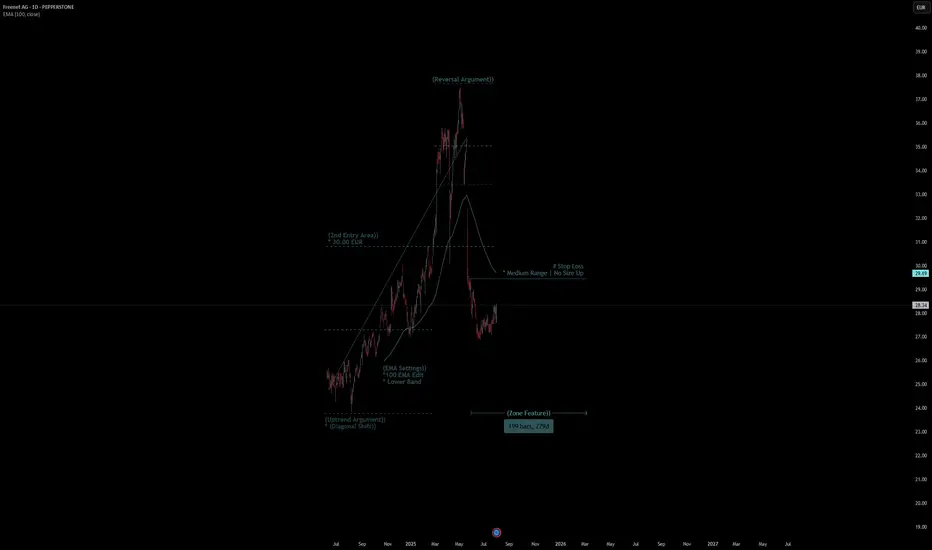
# Freenet AG Quote
- Double Formation
* (Uptrend Argument)) - *(Diagonal Shift)) | Completed Survey
* Stop Loss - *Medium Range | No Size Up | Subdivision 1
- 199 bars, 279d | Date Range Method
- Triple Formation
* (P1)) / (P2)) & (P3)) | Subdivision 2
* Daily Time Frame | Trend Settings Condition | Subdivision 3
- (Hypothesis On Entry Bias)) | Regular Settings
- Position On A 1.5RR
* Stop Loss At 30.00 EUR
* Entry At 28.00 EUR
* Take Profit At 24.00 EUR
* (Downtrend Argument)) & No Pattern Confirmation
- Continuation Pattern | Not Valid
- Reversal Pattern | Not Valid
* Ongoing Entry & (Neutral Area))
Active Sessions On Relevant Range & Elemented Probabilities;
European-Session(Upwards) - East Coast-Session(Downwards) - Asian-Session(Ranging)
Conclusion | Trade Plan Execution & Risk Management On Demand;
Overall Consensus | Sell
Moving Averages
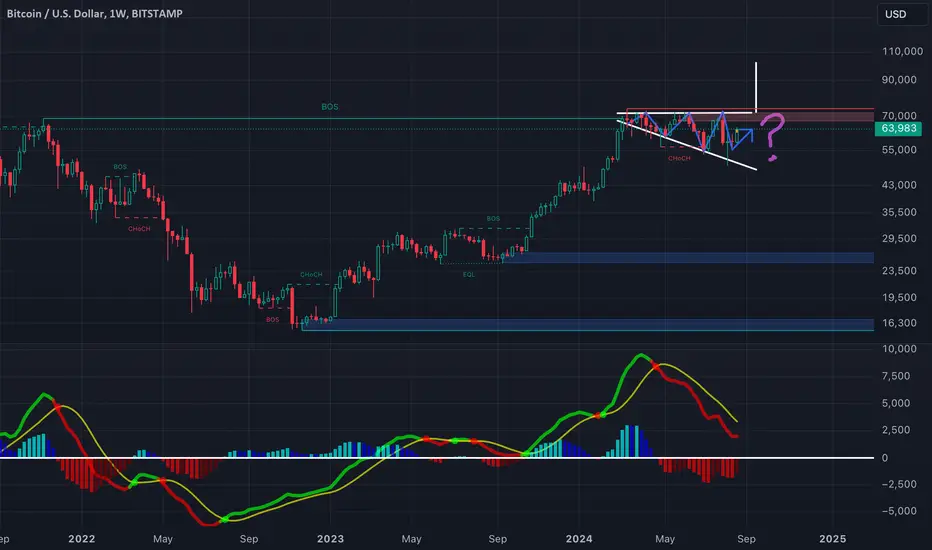
$BTCUSD, rally into rate cuts?BITSTAMP:BTCUSD has been coiling for some time now in a right angled descending broadening wedge.
A measured move of this cone so far would place BTC at right around ~$100k.
This aligns well with historical performance of BTC heading into a cutting cycle. If we rally into September and have a selloff following the cuts (sell the news), I wouldn't be shocked. This is a pattern that has happened in multiple years of the previous QE/QT Cycle (2016/2017, 2019/2020).
The real fireworks will be in 2025 if things go according to the FED's schedule
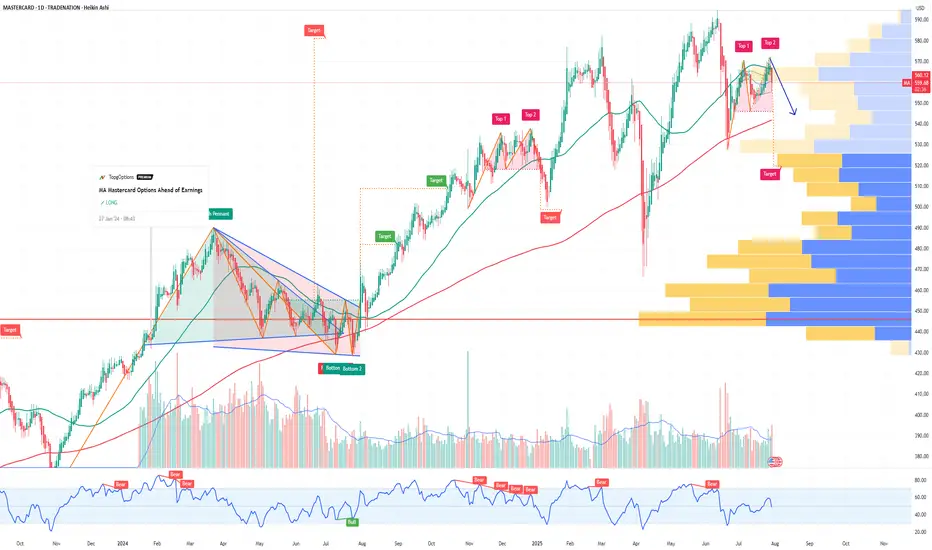
MA Mastercard Incorporated Options Ahead of EarningsIf you haven`t bought MA before the rally:
Now analyzing the options chain and the chart patterns of MA Mastercard Incorporated prior to the earnings report this week,
I would consider purchasing the 545usd strike price Puts with
an expiration date of 2025-8-8,
for a premium of approximately $4.45.
If these options prove to be profitable prior to the earnings release, I would sell at least half of them.
Disclosure: I am part of Trade Nation's Influencer program and receive a monthly fee for using their TradingView charts in my analysis.
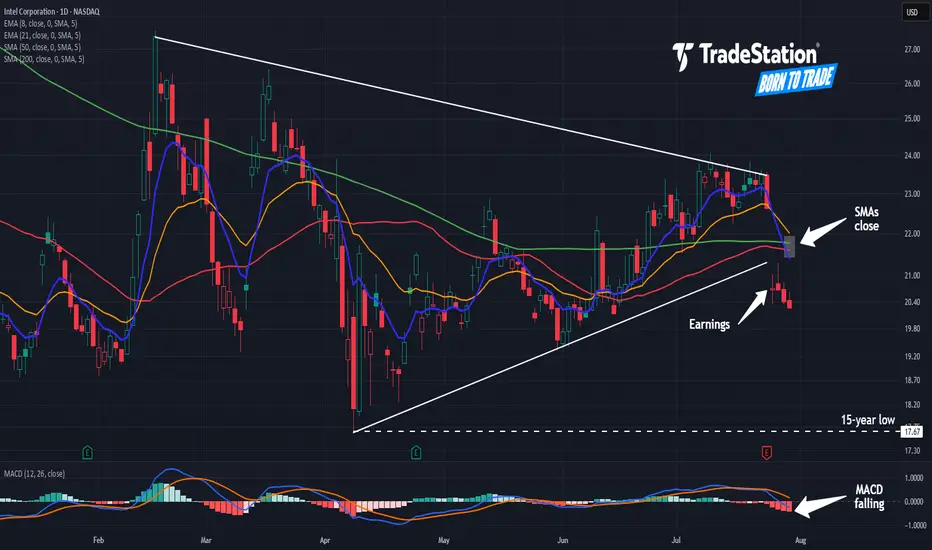
Intel: Still Not Cheap Enough?Intel has been falling for years, but some traders may think it’s still not cheap enough.
The first pattern on today’s chart is the series of higher lows since April, combined with lower highs since February. That converging range is a potential consolidation pattern.
Second, the chipmaker broke that range by gapping lower on Friday following a weak quarterly report.
Third, traders may eye $17.67 as the next important level. That April low was also the lowest price since August 2010.
Fourth, the 50-day simple moving average (SMA) inched toward the 200-day SMA this month but failed to cross above it. Is a longer-term bearish trend in effect?
Next, the 8-day exponential moving average (EMA) is below the 21-day EMA and MACD is falling. Both of those signals may be consistent with bearishness in the short term.
Finally, INTC is an active underlier in the options market. (Its average daily volume of about 350,000 contacts ranks 10th the S&P 500, according to TradeStation Data.) That could help traders take positions with calls and puts.
TradeStation has, for decades, advanced the trading industry, providing access to stocks, options and futures. If you're born to trade, we could be for you. See our Overview for more.
Past performance, whether actual or indicated by historical tests of strategies, is no guarantee of future performance or success. There is a possibility that you may sustain a loss equal to or greater than your entire investment regardless of which asset class you trade (equities, options or futures); therefore, you should not invest or risk money that you cannot afford to lose. Online trading is not suitable for all investors. View the document titled Characteristics and Risks of Standardized Options at www.TradeStation.com . Before trading any asset class, customers must read the relevant risk disclosure statements on www.TradeStation.com . System access and trade placement and execution may be delayed or fail due to market volatility and volume, quote delays, system and software errors, Internet traffic, outages and other factors.
Securities and futures trading is offered to self-directed customers by TradeStation Securities, Inc., a broker-dealer registered with the Securities and Exchange Commission and a futures commission merchant licensed with the Commodity Futures Trading Commission). TradeStation Securities is a member of the Financial Industry Regulatory Authority, the National Futures Association, and a number of exchanges.
Options trading is not suitable for all investors. Your TradeStation Securities’ account application to trade options will be considered and approved or disapproved based on all relevant factors, including your trading experience. See www.TradeStation.com . Visit www.TradeStation.com for full details on the costs and fees associated with options.
Margin trading involves risks, and it is important that you fully understand those risks before trading on margin. The Margin Disclosure Statement outlines many of those risks, including that you can lose more funds than you deposit in your margin account; your brokerage firm can force the sale of securities in your account; your brokerage firm can sell your securities without contacting you; and you are not entitled to an extension of time on a margin call. Review the Margin Disclosure Statement at www.TradeStation.com .
TradeStation Securities, Inc. and TradeStation Technologies, Inc. are each wholly owned subsidiaries of TradeStation Group, Inc., both operating, and providing products and services, under the TradeStation brand and trademark. When applying for, or purchasing, accounts, subscriptions, products and services, it is important that you know which company you will be dealing with. Visit www.TradeStation.com for further important information explaining what this means.
Hidden Bullish Divergence Bull is in a falling wedge patter while also making lower lows on the 1hr while making higher lows on the true strength index indicator. It is also bouncing off the 200ma, the bottom bollinger band, and the first reversal zone.

FMC Corporation Quote | Chart & Forecast SummaryKey Indicators On Trade Set Up In General
1. Push Set Up
2. Range Set Up
3. Break & Retest Set Up
Notes On Session
# FMC Corporation Quote
- Double Formation
* (1st Entry Area)) - *70.00 USD | Completed Survey
* (A+ SIgnal)) - *Retest Feature | Subdivision 1
- Triple Formation
* (P1)) / (P2)) & (P3)) | Subdivision 2
* 119 bars, 165d, 1.5RR - Date Range Method | Subdivision 3
* Daily Time Frame | Trend Settings Condition
- (Hypothesis On Entry Bias)) | Regular Settings
- Position On A 1.5RR
* Stop Loss At 48.00 USD
* Entry At 41.00 USD
* Take Profit At 31.00 USD
* (Downtrend Argument)) & Pattern Confirmation
- Continuation Pattern | Valid
* Pennant Structure | Short Set Up
- Reversal Pattern | Not Valid
* Ongoing Entry & (Neutral Area))
Active Sessions On Relevant Range & Elemented Probabilities;
European-Session(Upwards) - East Coast-Session(Downwards) - Asian-Session(Ranging)
Conclusion | Trade Plan Execution & Risk Management On Demand;
Overall Consensus | Sell

3 Key Catalysts Driving the Next ETH Bull Run
A remarkable confluence of powerful market forces is brewing in the Ethereum ecosystem, fueling increasingly bold outlooks for its future valuation. A potent combination of historical price patterns, dramatic supply dynamics, soaring institutional interest, and resilient price action is painting a picture of a digital asset potentially on the verge of a historic expansion. While a target of $20,000 may seem audacious, a granular look at the underlying mechanics reveals a compelling, multi-faceted argument for a significant upward repricing of Ethereum (ETH).
This deep dive will explore the four key pillars supporting this optimistic outlook: a striking historical price pattern that mirrors Bitcoin’s monumental 2021 surge, a critical supply shock evidenced by a mass exodus of ETH from exchanges, record-breaking institutional engagement in the futures market, and a tenacious price strength holding firm at key technical levels.
Chapter 1: The Bitcoin Fractal: Is History Rhyming?
In financial markets, history rarely repeats itself exactly, but its patterns often rhyme. Market analysts are increasingly pointing to a "fractal"—a recurring geometric pattern in price action—that suggests Ethereum's current market structure is eerily echoing that of Bitcoin's in late 2020, just before its parabolic surge in 2021.
This analysis highlights that Ethereum's chart is displaying a nearly identical pattern of accumulation, re-accumulation, and price compression that Bitcoin exhibited before its own historic breakout. During that period, Bitcoin experienced a multi-fold increase in value, shattering previous records. The parallel suggests that, much like Bitcoin did, Ethereum has emerged from a prolonged consolidation phase and is now pressing against a long-term downtrend resistance line that has defined its market structure for several years.
Should this fractal play out as it did for Bitcoin, a decisive breakout above this critical resistance could trigger a rapid, exponential move upwards. The potential for such a climb is being fueled by a perfect storm of institutional adoption and favorable market shifts.
A critical catalyst underpinning this parallel is the recent launch and explosive growth of spot Ethereum Exchange-Traded Funds (ETFs). The 2021 Bitcoin bull run was significantly propelled by growing institutional legitimacy and new, regulated investment vehicles. Similarly, Ethereum ETFs are now providing a secure and accessible gateway for a fresh wave of institutional capital. These funds have already seen staggering net inflows, with major asset management firms accumulating billions in assets, signaling deep conviction from the titans of traditional finance. This institutional stamp of approval is a powerful parallel to the forces that drove Bitcoin's last major cycle, providing the foundational capital flows needed for a sustained rally.
Chapter 2: The Great Supply Squeeze: A Mass ETH Exodus from Exchanges
One of the most compelling bullish arguments for Ethereum is rooted in fundamental on-chain economics: a dramatic and accelerating supply squeeze. The "Exchange Reserve," a metric that tracks the total amount of ETH held in the wallets of centralized exchanges, has plummeted at an astonishing rate.
In a recent one-month period alone, well over one million ETH were withdrawn from these platforms. This mass exodus of coins is a profoundly bullish indicator. When investors move their assets off exchanges, it typically signals an intention to hold for the long term in self-custodial wallets, rather than keeping them liquid and ready for a quick sale. This behavior drastically reduces the immediately available supply on the open market. Consequently, even a steady level of demand can exert significant upward pressure on the price.
This trend has pushed the total supply of Ethereum on exchanges down to its lowest level in nearly a decade. The drivers behind these massive withdrawals are multifaceted and all point toward a tightening market:
• Long-Term Conviction and Staking: A growing number of investors are locking up their ETH in staking contracts to help secure the network and earn passive yield. Others are simply moving their holdings to secure "cold storage" with a long-term investment horizon, effectively taking them off the market for the foreseeable future.
• DeFi Integration: A significant and growing portion of ETH is used as the primary form of collateral within the sprawling Decentralized Finance (DeFi) ecosystem, where it is locked into smart contracts for lending, borrowing, and other financial applications.
• ETF Accumulation: The newly launched spot ETFs are required to purchase and hold real ETH to back their shares. This direct accumulation removes vast quantities of ETH from the circulating supply that would otherwise be available to retail and institutional buyers.
This fundamental imbalance between a shrinking available supply and growing demand is creating the perfect conditions for a potential "supply shock." The sustained decline in exchange reserves, even as prices have rallied, reinforces the idea that current holders are not rushing to take profits. This indicates a strong belief in future price appreciation and adds a powerful layer of underlying support to Ethereum's macro bullish structure.
Chapter 3: The Wall of Institutional Money: Futures and Open Interest Soar
The derivatives market, often seen as the playground for more sophisticated and institutional investors, is flashing its own set of glaringly bullish signals. Open Interest (OI) in Ethereum futures—representing the total value of all outstanding futures contracts that have not been settled—has surged to unprecedented levels.
On major regulated exchanges favored by institutional investors, Ethereum futures Open Interest has recently shattered all-time highs. This represents a massive and undeniable increase in institutional participation, as asset managers, hedge funds, and other large-scale players use these regulated products to gain exposure to ETH's potential upside and to manage their risk. This is not an isolated phenomenon; across the global landscape of exchanges, the total Open Interest for Ethereum futures has climbed to record-breaking heights.
Rising Open Interest that occurs in tandem with a rising price is a classic technical confirmation of a strong and healthy trend. It demonstrates that new money is actively flowing into the market, with participants expressing confidence in future price appreciation. This influx of capital adds significant fuel to the ongoing rally. The surge in derivatives activity highlights a maturation of the market, where both institutional and retail investors are increasingly using sophisticated financial instruments to speculate on Ethereum's price trajectory.
While the high levels of leverage inherent in futures trading can introduce volatility and the risk of cascading liquidations, the primary signal is one of immense and growing institutional conviction in Ethereum's medium-to-long-term outlook. The influx of capital into both spot ETFs and the futures market creates a powerful, self-reinforcing feedback loop, enhancing liquidity, legitimizing the asset class, and attracting even more conservative capital off the sidelines.
Chapter 4: The Immediate Battleground: Price Action Shows Resilient Strength
Zooming in from the macro-outlook to the short-term technical picture, Ethereum's price action has demonstrated notable resilience, reinforcing the broader bullish thesis. After a strong rally, the price has been consolidating its gains, establishing critical support zones that traders and algorithms are watching with keen interest.
Recent price action shows Ethereum starting a fresh increase above the $3,820 and $3,880 levels. The price is trading near the crucial $3,800 mark and the 100-hourly Simple Moving Average, an indicator that often acts as a dynamic line of support during uptrends. Although there was a brief break below a key bullish trend line that had formed with support at $3,800 on the hourly chart, the ability of the price to remain supported above the broader $3,720 zone is considered vital for a bullish continuation. Should the pair remain supported above this zone in the near term, it could start a fresh increase.
The price has recently faced resistance near the $3,900 and $3,920 levels. The psychological $4,000 barrier remains the next major target. A decisive and sustained break above the $4,000 mark could open the door for a rapid advance, as it would clear the last major resistance area before a potential retest of previous all-time highs.
Technical indicators on higher timeframes remain robust. The price is in a clear long-term uptrend, trading well above its key daily moving averages. While short-term indicators may show temporary overbought conditions or moments of waning momentum, the overall market structure remains decisively bullish as long as critical support levels continue to hold.
Conclusion: A Compelling Case for a New Era of Price Discovery
The prospect of Ethereum reaching a valuation of $20,000 is a monumental forecast, but it is one built on a solid and multi-faceted foundation. The convergence of a compelling historical fractal mirroring Bitcoin's most famous bull run, a verifiable and intensifying supply shock, unprecedented institutional adoption via both spot ETFs and futures markets, and a resilient technical posture creates a powerful case for a sustained bullish continuation.
Each pillar of this argument reinforces the others. Institutional inflows from ETFs directly contribute to the supply squeeze on exchanges. The resulting upward price pressure attracts more speculative interest in the futures market, and the resilient technical picture provides the stable base from which a larger market move can be launched. While no outcome in financial markets is ever guaranteed, and the risks of volatility and sharp corrections remain ever-present, the confluence of these potent factors suggests that Ethereum may not just be knocking on the door of its old all-time high, but preparing to smash through it and enter a new and explosive era of price discovery.

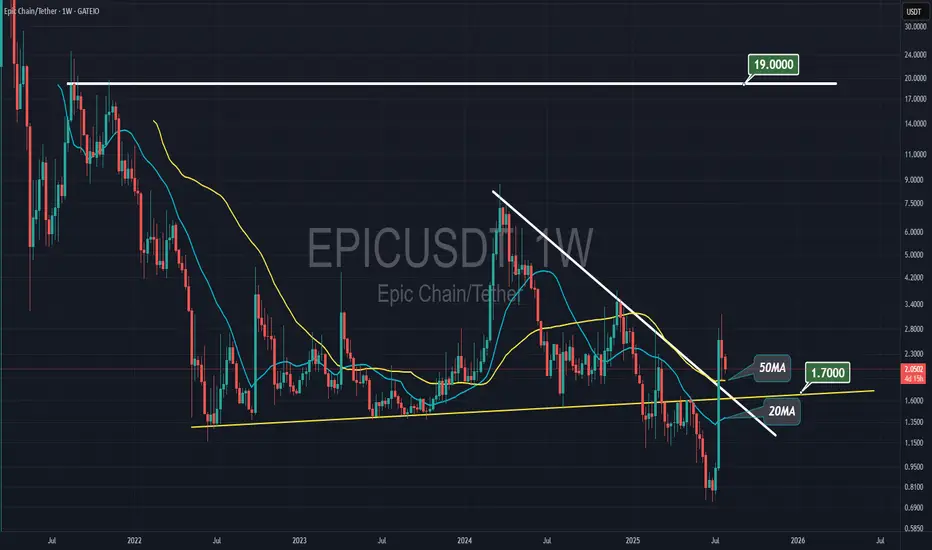
Epic Chain to $19.00Epic Chain rallied two weeks ago, surpassing all resistances. We may see sideways movement and another pump to the previous high of $19.00
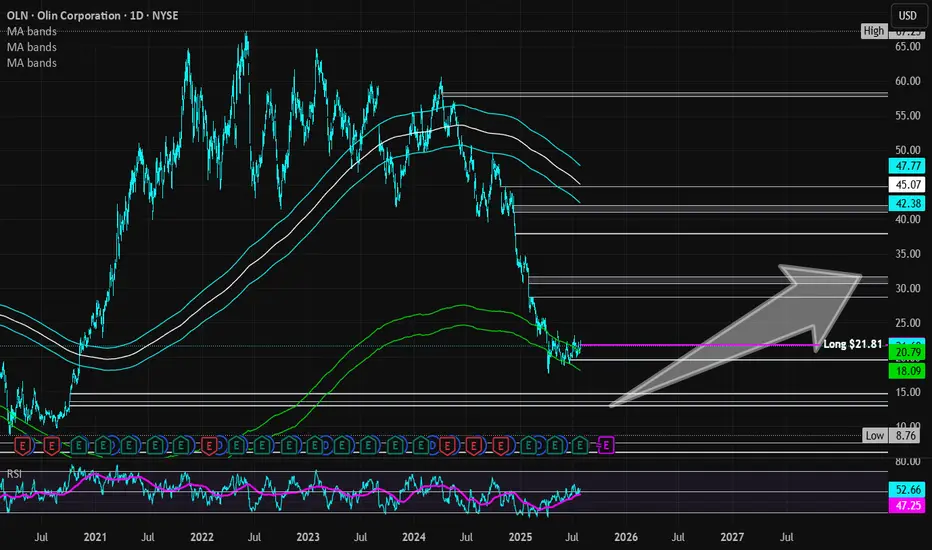
Olin Corporation | OLIN | Long at $21.81Olin Corp NYSE:OLN is currently trading within my "crash" simple moving average area (green lines on the chart). Historically, the price trades within this area for the company, consolidates, and then moves up. After today's earnings, which were relatively positive, the stock may gain some traction and move up. However, I am cautious a media-heightened economic downturn could send NYSE:OLN (a global manufacturer of chemical products and ammunition) to $13 to close the existing price gaps on the daily chart. Regardless, it's a strong company that has been trading on the US stock exchange since the mid-1970s - it's seen rough times before. While 2025 is likely to be a tough year, future earnings projections predict robust earnings growth. Time will tell...
Thus, at $21.81, NYSE:OLN is in a personal buy-zone with noted caution if there is an economic downturn down to $13 a share. The price gap around $19 may also be closed in the near-term.
Targets into 2028:
$28.00 (+28.4%)
$31.50 (+44.4%)
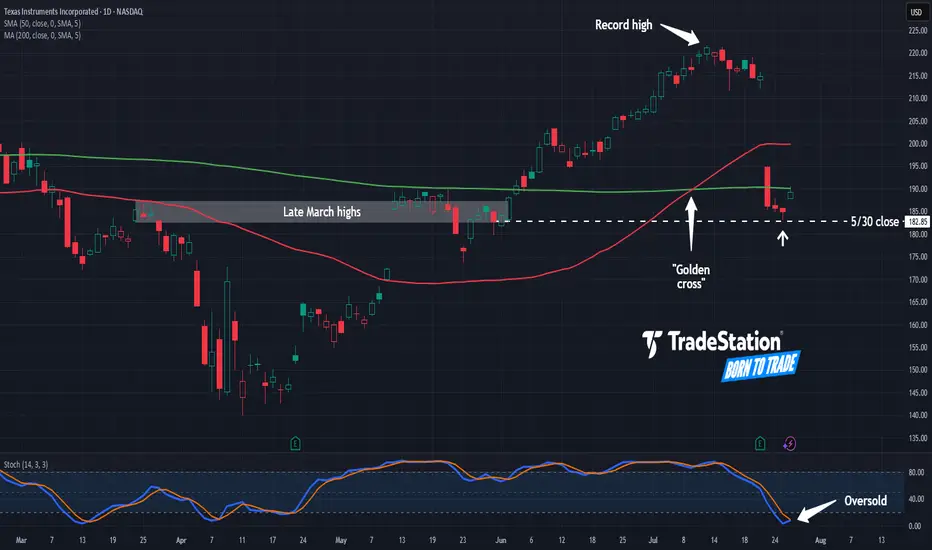
Texas Instruments May Be OversoldTexas Instruments fell sharply last week, and now it may be oversold.
The first pattern on today’s chart is the price zone on either side of $185. It’s near the peaks in late March and a consolidation zone in late May. (The May 30 weekly close is in a similar area.)
TXN held near that level last week, which may confirm old resistance has evolved into new support.
Next, stochastics are turning up from an oversold condition.
Third, the 50-day simple moving average (SMA) had a “golden cross” above the 200-day SMA earlier this month. That could indicate the semiconductor company’s longer-term trend has gotten more bullish.
TradeStation has, for decades, advanced the trading industry, providing access to stocks, options and futures. If you're born to trade, we could be for you. See our Overview for more.
Past performance, whether actual or indicated by historical tests of strategies, is no guarantee of future performance or success. There is a possibility that you may sustain a loss equal to or greater than your entire investment regardless of which asset class you trade (equities, options or futures); therefore, you should not invest or risk money that you cannot afford to lose. Online trading is not suitable for all investors. View the document titled Characteristics and Risks of Standardized Options at www.TradeStation.com . Before trading any asset class, customers must read the relevant risk disclosure statements on www.TradeStation.com . System access and trade placement and execution may be delayed or fail due to market volatility and volume, quote delays, system and software errors, Internet traffic, outages and other factors.
Securities and futures trading is offered to self-directed customers by TradeStation Securities, Inc., a broker-dealer registered with the Securities and Exchange Commission and a futures commission merchant licensed with the Commodity Futures Trading Commission). TradeStation Securities is a member of the Financial Industry Regulatory Authority, the National Futures Association, and a number of exchanges.
TradeStation Securities, Inc. and TradeStation Technologies, Inc. are each wholly owned subsidiaries of TradeStation Group, Inc., both operating, and providing products and services, under the TradeStation brand and trademark. When applying for, or purchasing, accounts, subscriptions, products and services, it is important that you know which company you will be dealing with. Visit www.TradeStation.com for further important information explaining what this means.
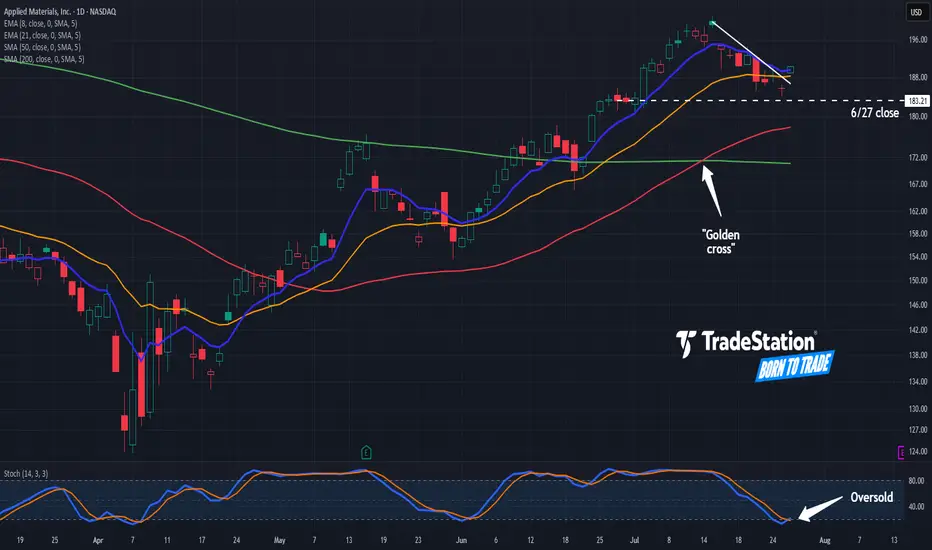
Applied Materials: Trendline Breakout?Applied Materials recently hit a nine-month high, and now it’s pulled back.
The first pattern on today’s chart is June 27's weekly close of $183.21. The chip-equipment company has bounced above that level, which may suggest new support is in place.
Second is the series of lower highs since mid-July. AMAT began this week by jumping above that trendline. Could the move be viewed as a breakout?
Third, stochastics are rebounding from an oversold condition.
Fourth, the 8-day exponential moving average (EMA) has remained above the 21-day EMA. The 50-day simple moving average (SMA) also had a “golden cross” above the 200-day SMA about two weeks ago. Those patterns may be consistent with bullish trends in the short and long terms.
TradeStation has, for decades, advanced the trading industry, providing access to stocks, options and futures. If you're born to trade, we could be for you. See our Overview for more.
Past performance, whether actual or indicated by historical tests of strategies, is no guarantee of future performance or success. There is a possibility that you may sustain a loss equal to or greater than your entire investment regardless of which asset class you trade (equities, options or futures); therefore, you should not invest or risk money that you cannot afford to lose. Online trading is not suitable for all investors. View the document titled Characteristics and Risks of Standardized Options at www.TradeStation.com . Before trading any asset class, customers must read the relevant risk disclosure statements on www.TradeStation.com . System access and trade placement and execution may be delayed or fail due to market volatility and volume, quote delays, system and software errors, Internet traffic, outages and other factors.
Securities and futures trading is offered to self-directed customers by TradeStation Securities, Inc., a broker-dealer registered with the Securities and Exchange Commission and a futures commission merchant licensed with the Commodity Futures Trading Commission). TradeStation Securities is a member of the Financial Industry Regulatory Authority, the National Futures Association, and a number of exchanges.
TradeStation Securities, Inc. and TradeStation Technologies, Inc. are each wholly owned subsidiaries of TradeStation Group, Inc., both operating, and providing products and services, under the TradeStation brand and trademark. When applying for, or purchasing, accounts, subscriptions, products and services, it is important that you know which company you will be dealing with. Visit www.TradeStation.com for further important information explaining what this means.
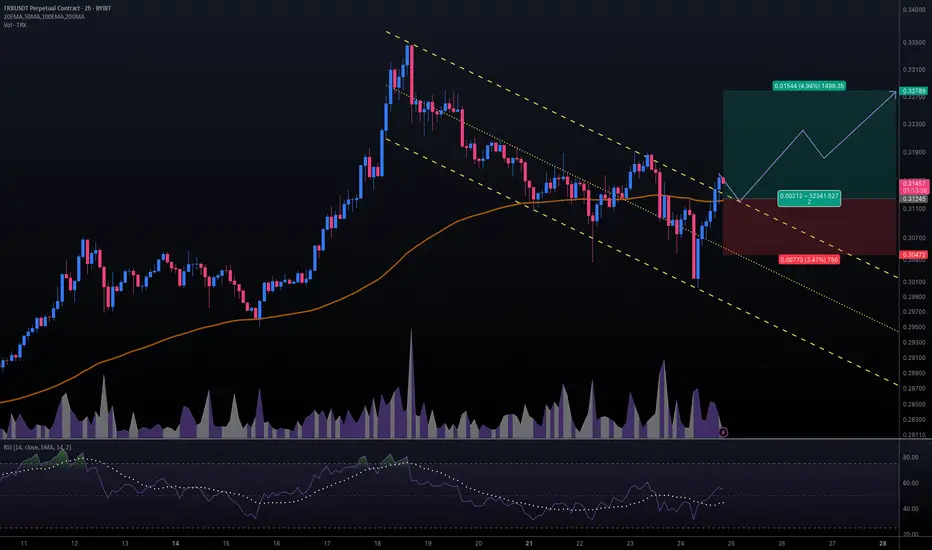
#TRXUSDT #2h (ByBit) Descending channel breakout and retestTron just regained 100EMA support and seems ready for bullish continuation after a pullback to it.
⚡️⚡️ #TRX/USDT ⚡️⚡️
Exchanges: ByBit USDT
Signal Type: Regular (Long)
Leverage: Isolated (16.0X)
Amount: 5.1%
Entry Targets:
1) 0.31245
Take-Profit Targets:
1) 0.32789
Stop Targets:
1) 0.30472
Published By: @Zblaba
CRYPTOCAP:TRX BYBIT:TRXUSDT.P #2h #TRON #DPoS #L1 #Web3 trondao.org tron.network
Risk/Reward= 1:2.0
Expected Profit= +79.1%
Possible Loss= -39.6%
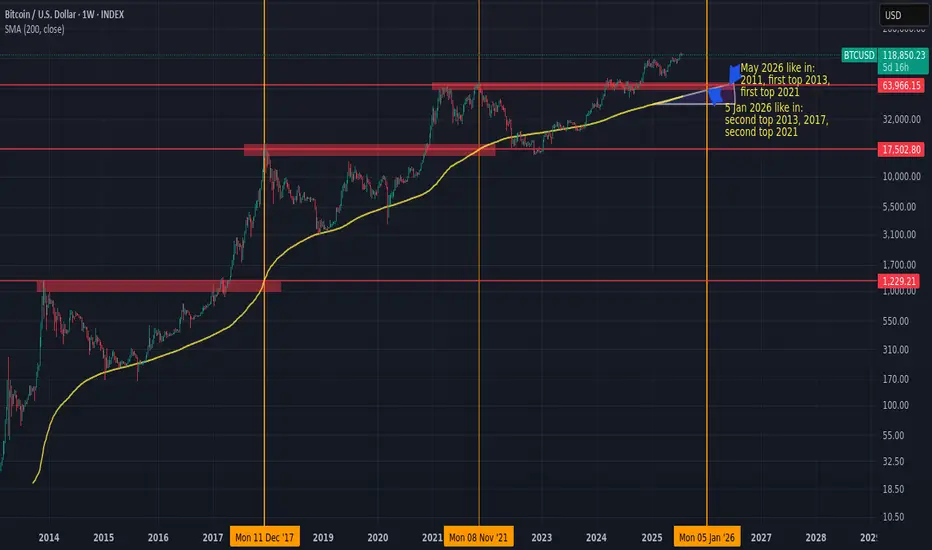
Next BTC topHistorically, BTC/USD has tended to peak when the 200-week simple moving average (200W SMA) approaches or crosses the high from the previous market cycle.
If this pattern holds, and assuming the 200W SMA continues rising at its current pace, the next top could occur sometime between January and May 2026.
If BTC accelerates earlier, the moving average would steepen, potentially shifting the timing forward.
Something worth watching to manage risk and position sizing accordingly.
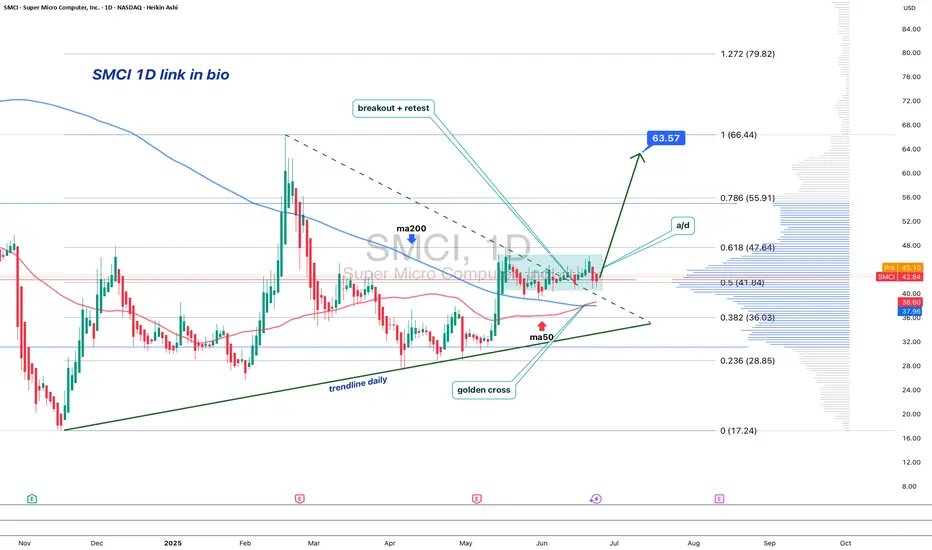
SMCI: When a chart says it’s time to reconnect with the AI hypeOn the daily chart, Super Micro Computer Inc. (SMCI) is showing a clean bullish setup. Price broke out of a descending trendline (green dashed), confirmed it with a retest, and is now consolidating above the breakout zone. The golden cross — where the MA50 crossed above the MA200 — confirms a long-term trend reversal.
Volume profile indicates strong accumulation near $41–43. The 0.5 Fibonacci level at $41.84 acted as support. Above the current range, there’s low volume resistance up to $63.57 (0.786), followed by $66.44 and a final extension target at $79.82 (1.272).
Fundamentals: SMCI is a leading server hardware manufacturer. Demand for their systems has soared with the explosion of AI infrastructure. The company maintains solid financials, with rising quarterly revenue and growing presence in the cloud sector. Institutional investors have been actively increasing their positions since late 2023 — a sign of strong long-term conviction.
Tactical plan:
— Entry: market $42–43
— Target 1: $55.91
— Target 2: $63.57
When technicals scream textbook breakout and fundamentals bring AI momentum to the table — it might just be one of the best late entries in the AI wave this summer.
Dollar General | DG | Long at $90.00Dollar General NYSE:DG took a massive hit this morning after revising their future earnings guidance. The economy is showing many signs of a recession, and this is a clear warning. From a technical analysis perspective, it has retouched my "crash" simple moving average and may dip further into the $80's in the near-term. But, like many overall strong companies that suddenly plummet, I view this as a future opportunity given the strength of NYSE:DG as a business (holistically). Dollar General is the only grocery and home goods store around in many rural locations. So, while there is doom and gloom in the near-term, Dollar General is in a personal buy zone at $90.00. I view this as a starter position, though, with the potential for future declines/opportunities for additional share accumulation in the near-term.
Target #1 = $100.00
Target #2 = $122.00
Target #3 = $200.00+ (very-long term outlook...)

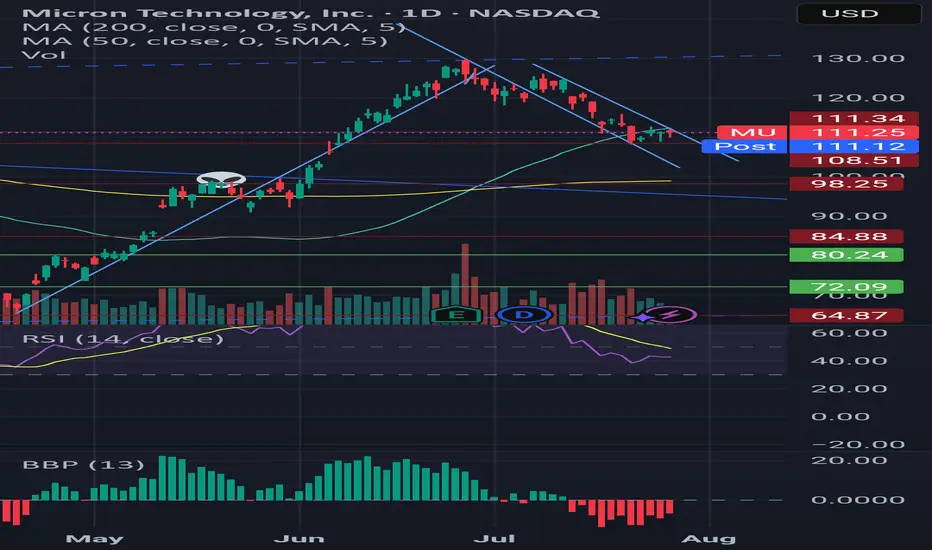
BearishI have a feeling that Micron's gonna retest $109 or blow through it and run for the 200 moving average. Waiting to see a bullish divergence in the RSI, or for it to get out of this little downtrend it's forming
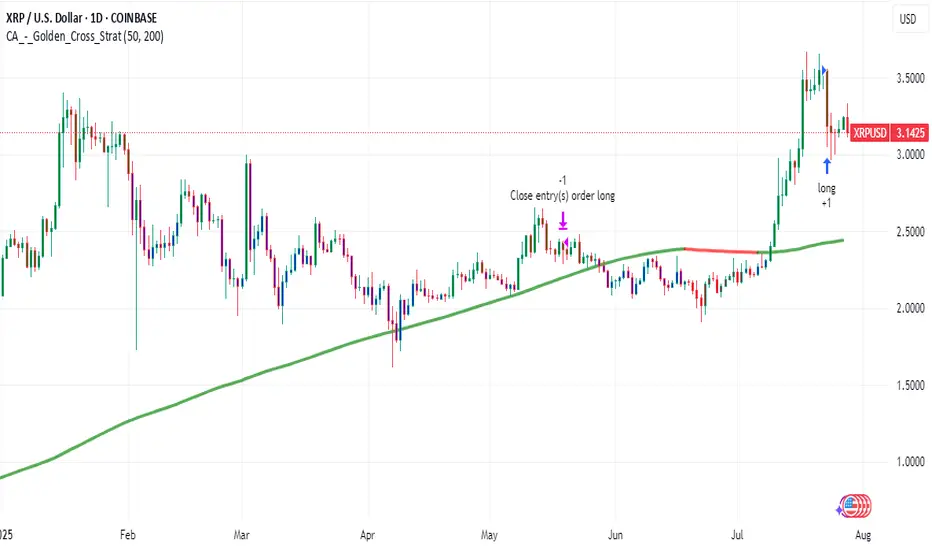
Bullish Signals Mount for XRP as Price Holds Weekend GainsXRP at a Crossroads: Technical Strength Meets Fundamental Catalysts in a High-Stakes Market
July 28, 2025 – In the volatile and ever-evolving world of digital assets, few tokens command as much attention, debate, and fervent community support as XRP. The digital asset, intrinsically linked with the fintech company Ripple, is currently navigating a period of intense market focus. After a period of consolidation, XRP is demonstrating renewed strength, holding onto recent gains and pressing against critical technical resistance levels. This price action is not occurring in a vacuum; it is the culmination of powerful undercurrents, including bullish chart patterns, significant accumulation by large holders, and a shifting landscape of regulatory clarity and institutional interest that could define its trajectory for years to come.
As of Monday morning, XRP has shown stability, trading around the $3.16 to $3.24 range. This follows a period where the token has been building momentum, with analysts closely watching key resistance zones between $3.30 and $3.40. A decisive break above these levels could signal the start of a new upward trend, while the ability to hold support, particularly around $3.15 to $3.20, is seen as crucial for maintaining the current bullish structure. This delicate balance has traders and long-term investors alike on high alert, as a confluence of technical indicators and fundamental developments suggests that XRP may be poised for its next significant move.
________________________________________
Chapter 1: Decoding the Charts: Bullish Patterns Emerge
For technical analysts, the recent XRP charts are a compelling study in bullish potential. Several classic patterns and indicators have emerged, suggesting that the path of least resistance may be upwards. These signals, watched closely by traders globally, are fueling a narrative of an imminent breakout.
One of the most discussed formations is the "Cup and Handle" pattern. This is a bullish continuation pattern that resembles a teacup on a chart. The "cup" is a U-shaped or rounded bottom that forms after a price run-up, indicating a period of consolidation and accumulation. This is followed by the "handle," a shorter and shallower downward drift in price, representing a final shakeout before a potential major upward move. Analysts have identified a large cup formation developing on XRP's long-term charts, with some pointing to a breakout zone around $3.64. A confirmed move above the handle's resistance could, according to technical theory, trigger an explosive rally, with some analysts projecting targets as high as $5.18, $7, or even a staggering $30 based on the pattern's depth.
Adding to this bullish thesis is the appearance of a "Golden Cross." This occurs when a shorter-term moving average (like the 50-day) crosses above a longer-term moving average (like the 200-day) on a price chart. It is widely regarded as a signal of a potential long-term uptrend. A golden cross was recently confirmed on XRP's daily chart around July 23, 2025, an event that historically has preceded significant price runs. The last major golden cross in late 2024 was followed by a rally of over 460% in two months. While past performance is not indicative of future results, the reappearance of such a powerful signal has undoubtedly bolstered investor confidence.
Furthermore, a rare golden cross has also been observed on the XRP/BTC trading pair, where XRP's price is measured against Bitcoin. This specific event, where the 23-day moving average crossed the 200-day, previously preceded a 158% surge in the pair's value in just two weeks. The near-identical structure of the current pattern has led analysts to suggest that XRP may be poised to outperform Bitcoin in the near term, especially as Bitcoin's price has been consolidating, shifting investor focus toward promising altcoins.
These technical signals—from the broad Cup and Handle to the precise Golden Cross—are painting a picture of a market coiling for a significant move. They suggest that underlying buying pressure is quietly building, setting the stage for a potential breakout if the market's fundamental drivers align.
________________________________________
Chapter 2: The Whale Effect: Following the Smart Money
Beyond the lines on a chart, the actions of the market's largest players—colloquially known as "whales"—provide another critical layer of insight. These are individuals or entities holding vast amounts of a cryptocurrency, and their trading activity can significantly influence market trends and sentiment. Recently, on-chain data has revealed a clear and compelling trend: XRP whales are accumulating.
In a remarkable show of force, wallets holding between 10 million and 100 million XRP have been steadily increasing their holdings, adding over 130 million XRP in a single day recently. These large-scale investors now control approximately 14% of the circulating supply, a historic high for this cohort. This accumulation is significant because it suggests that sophisticated, well-capitalized market participants are confident in XRP's future prospects and are positioning themselves for a potential price increase.
Simultaneously, the flow of XRP from whale wallets to exchanges has plummeted by over 93% since early July. This is a crucial indicator, as large transfers to exchanges often signal an intention to sell. The sharp decline suggests that whales are not only buying more XRP but are also holding onto their existing assets, reducing the available supply on the market and removing significant sell-side pressure. This behavior, often described as a "supply shock," can create a powerful tailwind for the price if demand continues to rise.
This intense accumulation has not gone unnoticed. In one instance, two identical transactions moved a combined 306.4 million XRP, worth nearly $1 billion, from an exchange to a private wallet within 60 seconds. Such large, coordinated movements are often interpreted as strategic positioning ahead of anticipated positive news or a market-wide rally. This activity, combined with reports of over 2,700 wallets now holding at least 1 million XRP each, paints a picture of broad-based accumulation among the asset's most significant backers. This "smart money" activity often provides a psychological boost to retail investors, reinforcing the belief that a major move could be on the horizon.
________________________________________
Chapter 3: The Fundamental Pillars: Regulation, ETFs, and Utility
While technicals and whale movements drive short-to-medium-term sentiment, the long-term value of any digital asset rests on its fundamental pillars. For XRP, these pillars are its evolving regulatory status, the tantalizing prospect of a spot Exchange-Traded Fund (ETF), and its core utility within Ripple's global payments network.
Regulatory Clarity on the Horizon:
The most significant overhang on XRP for years has been the lawsuit filed by the U.S. Securities and Exchange Commission (SEC) in December 2020, which alleged that Ripple conducted an unregistered securities offering. This legal battle has been a focal point for the entire crypto industry. However, recent developments have shifted sentiment dramatically. Key court rulings, including a partial victory for Ripple where a judge determined that some of its XRP sales did not qualify as securities, have bolstered institutional confidence.
Currently, the case is in a delicate phase, with both Ripple and the SEC having paused their respective appeals. While rumors of a final settlement swirl, legal experts caution that the process is subject to the SEC's internal bureaucratic procedures and a formal vote is still required. Nevertheless, the prevailing belief is that the worst of the legal uncertainty is over. A final resolution, which many hope will come before the end of the year, would remove the primary obstacle to XRP's full-scale adoption in the United States and could pave the way for its relisting on major exchanges and inclusion in institutional products.
The Race for a Spot XRP ETF:
Following the landmark approvals of spot Bitcoin and Ethereum ETFs, the crypto market is buzzing with anticipation for what comes next. XRP is widely considered a prime candidate for its own spot ETF. Asset management giants like Grayscale, Bitwise, Franklin Templeton, and WisdomTree have already filed applications with the SEC.
The approval of a spot XRP ETF would be a watershed moment, providing a regulated, accessible, and insured investment vehicle for both retail and institutional investors in the U.S. to gain exposure to XRP. The launch of XRP futures-based ETFs has been seen as a positive precursor, following the same playbook that led to the spot Bitcoin ETF approvals. Market analysts and prediction markets have placed the odds of a spot XRP ETF approval in 2025 as high as 92-95%, contingent on a favorable resolution of the SEC lawsuit. Such an approval could unlock billions of dollars in institutional inflows, dramatically increasing demand and market legitimacy for the asset.
Core Utility in Global Payments:
At its heart, XRP was designed for utility. It serves as the native digital asset on the XRP Ledger, a decentralized blockchain engineered for speed and efficiency. Its primary use case is powering Ripple's payment solutions, which are now part of the broader Ripple Payments suite.
Ripple's network is designed to challenge the legacy correspondent banking system, exemplified by SWIFT, which can be slow and costly for cross-border payments. By using XRP as a bridge currency, financial institutions can settle international transactions in seconds for a fraction of a cent, without needing to pre-fund accounts in foreign currencies. This utility is not merely theoretical. Ripple has forged partnerships with over 300 financial institutions across more than 45 countries, with a significant portion utilizing XRP for liquidity. In 2024 alone, over $15 billion was transacted via Ripple's liquidity solutions, and the XRP Ledger is now processing over 2 million transactions daily. This growing, real-world adoption provides a fundamental demand for XRP that is independent of market speculation and forms the bedrock of its long-term value proposition.
________________________________________
Chapter 4: The Retirement Dream: Audacious Predictions and Future Outlook
The convergence of bullish technicals, strong fundamentals, and growing market optimism has led to a wave of bold price predictions from analysts. While highly speculative, these forecasts illustrate the immense potential that many see in XRP, fueling a narrative that significant holdings could lead to life-changing wealth.
Price targets for the current cycle vary widely, reflecting different models and timelines. Short-term targets frequently center around the $4 to $7 range, with some analysts suggesting a move to $9 or $15 is possible if momentum continues. One analyst, citing a rare bullish chart pattern, sees a potential 60% rally to around $4.47.
Looking further out, the predictions become even more audacious. Projections based on historical cycles and technical models, such as Elliott Wave theory, have put forth long-term targets of $16, $24, and even $27. Some AI-driven prediction models forecast that XRP could reach the $10-$20 range by the end of 2025, especially if an ETF is approved. Longer-term forecasts extending to 2030 suggest prices could potentially climb to between $19 and $48, depending on the level of global adoption.
These predictions have given rise to the "retire on XRP" dream among its community. For instance, if XRP were to reach one analyst firm's high-end forecast for 2030 of $32.60, an investment of 10,000 XRP could be worth over $326,000. While tantalizing, it is imperative for investors to approach such forecasts with extreme caution. The cryptocurrency market is notoriously volatile, and such high-reward potential is invariably accompanied by high risk. Regulatory setbacks, macroeconomic downturns, or a failure to achieve widespread adoption could all significantly impact XRP's future price.
Conclusion: A Confluence of Forces
XRP currently stands at one of the most fascinating junctures in its history. The digital asset is being propelled by a powerful confluence of forces: bullish technical patterns are signaling a potential breakout, on-chain data shows undeniable accumulation by its largest holders, and its fundamental value proposition is being strengthened by increasing regulatory clarity, the imminent possibility of a spot ETF, and steadily growing real-world utility.
The journey ahead is fraught with both immense opportunity and significant risk. A decisive break above its current resistance could unleash the momentum that analysts and investors have been anticipating for months. However, the market remains sensitive to legal news and broader macroeconomic trends. For now, XRP remains a bellwether asset, its story a microcosm of the broader struggle and promise of the digital asset industry—a high-stakes battle for legitimacy, adoption, and a permanent place in the future of finance
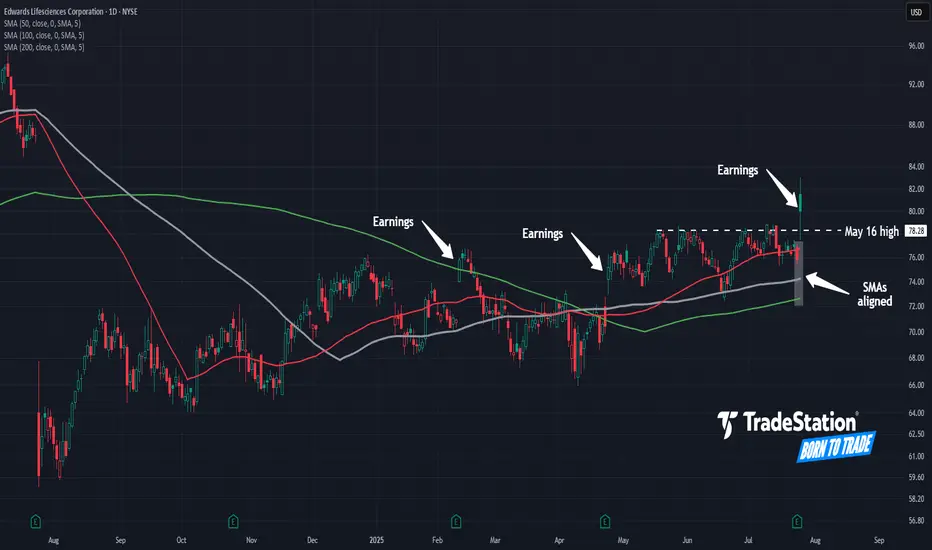
Edwards Lifesciences Enters the GapHealthcare has been the weakest sector in the past year, but some traders may expect a comeback in Edwards Lifesciences.
The first pattern on today’s chart is the breakout on Friday after earnings and revenue beat estimates. That rally brought EW into a bearish gap from one year ago.
Second is the May 16 high of $78.28. The heart-valve company spent more than two months mostly below that resistance, but now it’s been breached. Is there a confirmed breakout?
Third, the 50-day and 100-day simple moving averages (SMAs) crossed above the 200-day SMA in April. The 50-day SMA climbed above the 100-day SMA in May. Such an alignment, with the faster SMAs above the slower, may suggest a bullish trend is developing over the longer term.
Finally, the pair of bullish gaps after the previous earnings reports in February and April could reflect improving sentiment toward the company’s fundamentals.
TradeStation has, for decades, advanced the trading industry, providing access to stocks, options and futures. If you're born to trade, we could be for you. See our Overview for more.
Past performance, whether actual or indicated by historical tests of strategies, is no guarantee of future performance or success. There is a possibility that you may sustain a loss equal to or greater than your entire investment regardless of which asset class you trade (equities, options or futures); therefore, you should not invest or risk money that you cannot afford to lose. Online trading is not suitable for all investors. View the document titled Characteristics and Risks of Standardized Options at www.TradeStation.com . Before trading any asset class, customers must read the relevant risk disclosure statements on www.TradeStation.com . System access and trade placement and execution may be delayed or fail due to market volatility and volume, quote delays, system and software errors, Internet traffic, outages and other factors.
Securities and futures trading is offered to self-directed customers by TradeStation Securities, Inc., a broker-dealer registered with the Securities and Exchange Commission and a futures commission merchant licensed with the Commodity Futures Trading Commission). TradeStation Securities is a member of the Financial Industry Regulatory Authority, the National Futures Association, and a number of exchanges.
TradeStation Securities, Inc. and TradeStation Technologies, Inc. are each wholly owned subsidiaries of TradeStation Group, Inc., both operating, and providing products and services, under the TradeStation brand and trademark. When applying for, or purchasing, accounts, subscriptions, products and services, it is important that you know which company you will be dealing with. Visit www.TradeStation.com for further important information explaining what this means.
XRP Eyes $4? Analyst Says ‘Most Profitable Phase’ May Have BegunAs the broader crypto market shows signs of recovery, XRP is once again capturing investor attention—this time with bold forecasts of a surge toward $4.00, driven by technical momentum, market sentiment, and expanding real-world utility.
According to crypto analyst Darren Chu, CFA, founder of Tradable Patterns, XRP may be entering its “most profitable phase” since its 2021 rally. The token has posted a 20% gain over the last three weeks, breaking key resistance levels and displaying stronger correlation with broader altcoin inflows.
“XRP has the ideal confluence of legal clarity, technical breakout, and network traction,” Chu explained in a recent research note. “The conditions now resemble the early stages of major cyclical surges we’ve seen in past bull runs.”
Legal and Regulatory Tailwinds
Since Ripple Labs’ partial legal victory against the U.S. SEC in 2023—where a federal judge ruled that XRP is not a security when traded on exchanges—the asset has regained credibility among institutional players. Multiple crypto funds and ETFs have added exposure, and on-chain wallet growth has accelerated.
This legal clarity has paved the way for Ripple to resume aggressive expansion of its payment corridors, especially in Latin America and Asia-Pacific.
Real-World Utility as a Demand Catalyst
Unlike many Layer 1 tokens with purely speculative value, XRP benefits from real-world utility as a bridge asset for global payments. RippleNet, the enterprise-grade payment network built on XRP, now boasts over 300 financial institutions using or piloting XRP-based settlement infrastructure.
In July, Ripple announced its latest partnership with Banco Bradesco, one of Brazil’s largest banks, to streamline USD/BRL remittances—a deal expected to drive significant volume on-chain.
Analysts note that real-world utility may now be priced into XRP’s valuation at a discount, creating room for catch-up as adoption increases.
Technical Analysis Points Toward Breakout
From a technical standpoint, XRP has breached its multi-month descending channel, with daily trading volume rising 35% over the past two weeks. Analysts are watching the $0.92–$1.00 range as a short-term hurdle. If broken, momentum could accelerate quickly toward $1.50, and potentially as high as $3.80–$4.20, according to Fibonacci-based projections.
“The breakout setup is textbook,” says Chu. “We’re seeing volume confirmation, RSI divergence, and a broader macro narrative—all aligning.”
Risk and Reward: A Balanced View
Of course, XRP is not without risks. Pending SEC appeals, macro volatility, and delays in Ripple’s expansion plans could temper the pace of gains. Still, many investors are betting that the risk-reward profile is increasingly asymmetric in XRP’s favor.
In the eyes of analysts and asset managers alike, XRP is now more than a litigation story—it’s a comeback story.
For those seeking exposure to a large-cap crypto with strong fundamentals, legal clarity, and real-world traction, the message from the market is clear: XRP’s most profitable phase may have just begun.
PayPal’s Stablecoin Ambitions Falter Ahead of Earnings ReportWhen PayPal launched its own stablecoin PYUSD in August 2023, the move was seen by many as a bold step toward dominating the digital payments space. However, nearly two years later, PYUSD has yet to meet expectations. Its market share remains minimal, trading volume is weak, and trust from the DeFi community is limited — all while PayPal’s next earnings report looms and investor pressure mounts.
What’s the issue?
According to data from DefiLlama and CoinGecko, PYUSD’s market cap stands at just over $400 million, despite high-profile marketing campaigns and its integration with Venmo. In comparison, USDT has surpassed $110 billion in circulation, and USDC stands at around $32 billion. PYUSD hasn’t even broken into the top five stablecoins on Ethereum by trading activity.
A key problem is low liquidity and limited DeFi adoption. Although PYUSD is available on several decentralized exchanges (DEXs), it often suffers from high slippage. Moreover, PayPal operates under strict regulatory scrutiny as a public fintech company, limiting its ability to innovate or respond rapidly to market trends.
Why earnings matter
PayPal’s Q2 earnings report is expected next week, and investors will be closely watching not only core metrics like revenue and profit but also figures related to its Web3 and digital asset initiatives. With PYUSD underperforming, pressure is building for PayPal to justify its continued push into the crypto space.
There is growing speculation that the company may consider partnering with an established stablecoin provider or even abandoning PYUSD in favor of a white-label solution — a move that could realign its Web3 roadmap.
The strategic lens
Despite current struggles, PayPal still has the brand and user base to play a significant role in digital finance. However, as DLT analysts emphasize, a stablecoin is more than a payment tool — it’s infrastructure. Success depends on liquidity, trust, and deep integration within the DeFi ecosystem. Without robust adoption across chains and use cases, PYUSD risks becoming an internal-only solution with limited external relevance.
Unless the earnings report reveals a strategic pivot or new partnerships, investors may interpret PYUSD as a lost opportunity rather than a long-term asset.

Ethereum Staking Strain Exposed — Daxprime Weighs InIn July, the Ethereum ecosystem faced a new challenge: a sharp increase in the staking exit queue revealed structural weaknesses in the current liquid staking architecture. Within just a few days, more than 75,000 validators submitted requests to exit, causing temporary disruptions in certain derivative protocols and downward pressure on the prices of liquid staking tokens such as stETH, rETH, and sfrxETH.
Daxprime, a firm specializing in institutional analytics and active strategies in the Web3 sector, believes that this situation presents not only risks, but also new opportunities for profit — particularly for well-prepared market participants.
What Happened?
Since transitioning to Proof-of-Stake in 2022, Ethereum has enabled staking through validators. However, to exit the network, validators must join a queue. Under normal market conditions, this process takes just a few hours to a couple of days. But in July, a sudden surge in withdrawal requests extended the queue to over seven days — the longest wait time since the Shanghai upgrade.
Several factors contributed to the spike in exits:
Increased market volatility;
Rising yields in alternative DeFi instruments;
Panic reactions to liquidity stress in certain protocols.
As a result, liquid staking tokens — which are designed to trade close to a 1:1 ratio with ETH — began to trade at discounts of 3% to 4%, particularly on low-liquidity DEX platforms.
Systemic Risk or Temporary Disturbance?
Daxprime analysts emphasize that this is not a structural threat to Ethereum itself. However, the recent events clearly demonstrate that even "liquid" staking is still fundamentally tied to base-layer network constraints. Protocols like Lido and Rocket Pool are susceptible to imbalances between assets and liabilities, especially when there is a rapid increase in redemption demand.
This also means that users trading staking derivatives without understanding the mechanics of validator exit processes may face temporary illiquidity or losses when attempting to unwind positions during stress events.
How to Profit — Daxprime’s Perspective
For experienced market participants, such imbalances offer entry points with positive expected value. Here’s how Daxprime identifies ways to profit:
1. Arbitrage on Discounted Tokens
When stETH or sfrxETH fall below 0.97 ETH, there is an opportunity to buy these tokens on the secondary market and redeem them for full ETH value — either through redemption protocols or by waiting through the validator exit process.
2. Liquidity Provision with a Premium
Liquidity providers in stETH/ETH or sfrxETH/ETH pools during periods of market stress earn higher trading fees and farming incentives due to increased volume and imbalance in the pools.
3. Futures and Hedging Strategies
On platforms such as dYdX or Aevo, traders can build structured positions using stETH as the spot asset and hedging via ETH futures. This allows them to profit from either the restoration of parity or a continuation of the spread.
Daxprime’s Conclusion
The current exit queue backlog is not a catastrophe — it is a reminder that liquidity in crypto markets is always conditional. Stress events create inefficiencies that sophisticated investors can turn into sources of return.
Daxprime provides the tools to monitor such inefficiencies and helps clients execute strategies that not only mitigate risk but convert volatility into profit.
In markets where even “liquid” assets can become illiquid, those who understand the mechanics and act ahead of the curve stand to win.

Capital B Hits 2,000 BTC as BBDelta Highlights StrategyEthereum has surged past the $3,900 mark, propelled in part by news that Sharplink has acquired 77,200 ETH — a transaction worth over $300 million at current market value. For BBDelta, this move is not just market noise — it’s a concrete example of how institutional-grade Ethereum strategies can drive both asset growth and consistent income.
Sharplink, originally focused on gaming and Web3 infrastructure, has recently pivoted toward an asset-heavy Ethereum strategy. This latest acquisition positions the firm among the top ETH holders globally — and, more importantly, signals a clear roadmap to profit generation within the Ethereum ecosystem.
BBDelta analysts believe Sharplink isn’t buying ETH for speculative purposes. Rather, the company is likely deploying a multifaceted revenue model using its holdings. That includes high-yield staking via Ethereum’s proof-of-stake protocol, engagement with DeFi lending platforms, and participation in liquidity pools. These strategies, when executed correctly, can yield between 4% and 8% annually — paid directly in ETH or stablecoins.
In addition to yield generation, Sharplink could be utilizing ETH to collateralize derivatives positions, fund tokenized infrastructure, or support its presence in NFT ecosystems. Ethereum, as a platform, offers an incredibly diverse set of use cases — making it more than just a crypto asset, but a cornerstone of digital finance.
The breakout past $3,900 further strengthens this strategy. BBDelta’s technical analysis shows increased open interest in ETH futures and options, indicating rising institutional demand and the likelihood of continued volatility — a prime environment for experienced players to profit from both price movement and structure-based yields.
Sharplink’s timing also reflects sound macroeconomic thinking. As fiat currencies continue to face inflationary pressure and traditional interest rates plateau, ETH-based strategies offer both protection and performance. BBDelta believes this dual value proposition — yield + appreciation — is driving renewed interest in Ethereum as a strategic reserve asset.
At BBDelta, we empower clients to capitalize on these same dynamics. Whether it’s through ETH staking, DeFi revenue models, or structured derivatives, we offer the tools and advisory frameworks that allow investors to turn ETH holdings into active profit centers — with proper risk management in place.
Ethereum’s $3,900 milestone is not a peak — it’s a gateway to next-level opportunity. For those with the infrastructure, insights, and risk controls in place, the digital economy is not just a bet — it’s a business.

Metaplanet Doubles Down on Bitcoin Despite Weak SharesJapanese investment firm Metaplanet continues to draw attention with its pro-Bitcoin stance, announcing a fresh acquisition of BTC worth $93 million. The move comes despite ongoing pressure on the company's stock, underscoring its long-term commitment to digital assets.
Publicly listed on the Tokyo Stock Exchange, Metaplanet began accumulating Bitcoin in early 2024, taking inspiration from U.S.-based MicroStrategy. Since then, the company has steadily increased its holdings, viewing the cryptocurrency as a hedge against inflation and currency devaluation — particularly in light of the weakening yen.
With this latest purchase, Metaplanet’s total Bitcoin holdings now exceed 5,000 BTC, making it one of Asia’s largest corporate holders of the asset. Company executives emphasize that their approach is not driven by short-term speculation, but rather by a strategic vision to transform the balance sheet and align with the future of finance.
Still, the stock market has not fully embraced the strategy. Since the company’s initial crypto investments, Metaplanet shares have experienced significant volatility and an overall downward trend. Some investors remain wary of overexposure to a single volatile asset, fearing it could deter traditional capital and increase overall risk.
Speaking to local media, CEO Tetsuya Nagata reiterated that the firm’s Bitcoin commitment is deliberate and resilient. “We’re not chasing short-term price movements,” he said. “We see corrections as opportunities to strengthen our position and prepare for long-term transformation.”
Analysts are divided. Some view Metaplanet’s approach as a sign of growing institutional appetite for crypto in Asia, while others call for a more diversified portfolio to mitigate risk. There is growing speculation that Metaplanet’s bold move could set a precedent for other Japanese and regional companies seeking similar exposure.
Against the backdrop of global economic uncertainty and financial digitization, Bitcoin is evolving from a speculative asset into a core component of strategic asset allocation. Metaplanet is a clear example of this shift — one that is navigating short-term market challenges in pursuit of a long-term digital vision.
Time will tell whether the strategy pays off. But for now, Metaplanet is carving out a bold new role in Japan’s corporate landscape, as a pioneer of institutional Bitcoin adoption in Asia.
