XAUUSD is bouncing off daily 50emaHonestly i hate trading this pair. So many ridiculous highs and lows. But right now the PA is bouncing off the daily 50ema. That's it.
Moving Averages

Sugar Future - New York (Raw) Quote | Chart & Forecast SummaryKey Indicators On Trade Set Up In General
1. Push Set Up
2. Range Set Up
3. Break & Retest Set Up
Notes On Session
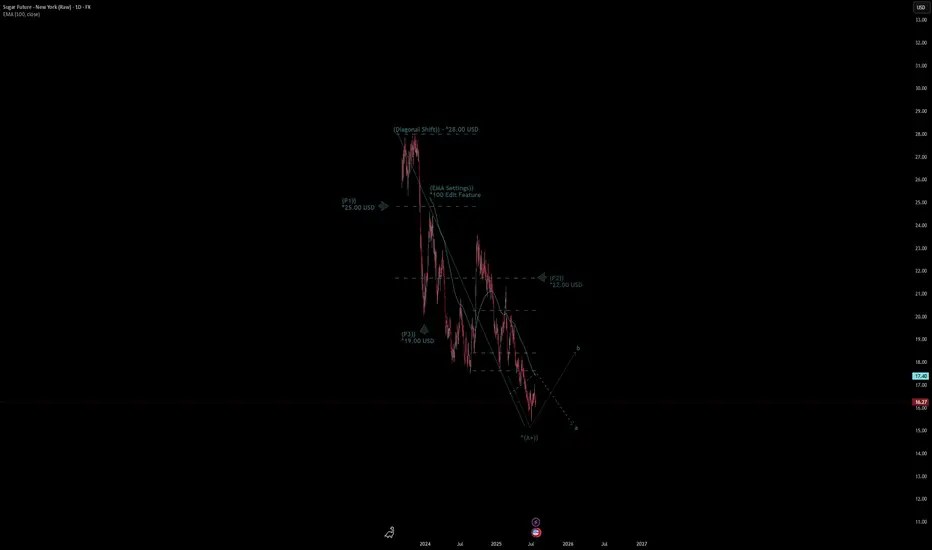
# Sugar Future - New York (Raw) Quote
- Double Formation
* (Diagonal Shift)) - *28.00 USD | Completed Survey
* (EMA Settings)) - *100 Edit Feature | Subdivision 1
- Triple Formation
* (P1)) / (P2)) & (P3)) | Subdivision 2
* (TP1) = a / Long Consecutive Range
* (TP2) = b / Short Consecutive Pullback | Subdivision 3
* Daily Time Frame | Trend Settings Condition
- (Hypothesis On Entry Bias)) | Regular Settings
- Position On A 1.5RR
* Stop Loss At 19.00 USD
* Entry At 16.00 USD
* Take Profit At 12.00 USD
* (Downtrend Argument)) & No Pattern Confirmation
- Continuation Pattern | Not Valid
- Reversal Pattern | Not Valid
* Ongoing Entry & (Neutral Area))
Active Sessions On Relevant Range & Elemented Probabilities;
European-Session(Upwards) - East Coast-Session(Downwards) - Asian-Session(Ranging)
Conclusion | Trade Plan Execution & Risk Management On Demand;
Overall Consensus | Sell
Bullish "Daily Chore" Setup on the EURUSDWe had one on Silver last week that played out nicely, now we have another Daily Chore signal setting up on the $EURUSD.
This is a short & sweet type of setup where we are looking for a test and rejection of a moving average an an opportunity to catch the next potential move upwards.
As mentioned in the video, we have A LOT of high impact news events happening this week so please be aware of that when looking to involve yourself in this and any other trading opportunities this week.
Please support by hitting that like button.
Follow so that you don't miss my future trading ideas.
And if you have any questions, comments or want to share you views on the market, please do so below.
Akil

DaxPrime: BlackRock Exec Move Signals SharpLink’s $1.3B ETH ShifIn a development that is drawing attention across both institutional finance and the crypto ecosystem, a senior executive from BlackRock’s digital assets division has transitioned to SharpLink Gaming — a rising Ethereum whale and sports betting infrastructure player now managing over $1.3 billion in ETH-based assets. At DaxPrime, we see this move not as an isolated career shift but as a strategic signal of deepening convergence between traditional asset management and Web3-native businesses.
The Move: From Wall Street to Web3 Execution
According to sources familiar with the matter, BlackRock’s former Head of Digital Asset Strategy, Daniel Wexler, is joining SharpLink Gaming as its Chief Digital Officer. Wexler played a critical role in shaping BlackRock's crypto ETF initiatives and oversaw early-stage partnerships with Ethereum ecosystem projects.
His transition comes at a time when SharpLink — originally focused on B2B sports betting technologies — has evolved into a key player in decentralized infrastructure, integrating smart contracts, Layer-2 analytics, and tokenized in-game markets. The company currently holds over $1.3 billion in Ethereum, making it one of the largest corporate ETH holders in the entertainment-tech sector.
DaxPrime’s View: Strategic Talent Realignment
At DaxPrime, we interpret this as more than just a personnel update. It reflects a broader realignment where institutional talent is gravitating toward firms that offer speed, flexibility, and a native role in the decentralized economy.
“The move illustrates a trend we’ve tracked since early 2024: legacy finance professionals are increasingly pivoting toward operational roles in Web3-native companies, particularly those with real assets and strong ETH exposure,” says Michaela Strobel, Senior Analyst at DaxPrime.
SharpLink’s use of Ethereum spans beyond treasury holdings. The firm is building proprietary smart contract infrastructure for real-time sports data feeds, NFT-linked fantasy games, and decentralized betting protocols — signaling a broader use-case than speculative ETH storage.
Ethereum as a Strategic Asset
Wexler’s decision also underscores Ethereum’s growing importance as a corporate strategic asset, not merely an investment vehicle. Ethereum’s programmable layer and widespread developer adoption make it the backbone of emerging digital business models — including SharpLink’s.
DaxPrime’s July 2025 ETH Treasury Index reveals that more than 18 publicly listed firms now hold over $500 million in Ethereum each, compared to just five a year ago. This uptick is particularly concentrated in sectors like digital media, AI-gaming convergence, and decentralized finance tooling.
“Ethereum’s shift from an investment to infrastructure asset is well underway,” Strobel notes. “Wexler’s move brings boardroom-grade credibility to a company operating deep within that transformation.”
What It Means for Investors
For investors, this move signals two critical developments:
Institutional Validation of Web3 Business Models: Wexler’s transition lends credence to firms building around Ethereum-based infrastructure, rather than just speculating on token prices.
New Pathways for ETH Utility: SharpLink’s planned integration of ETH staking, yield strategies, and decentralized oracles into its sports gaming vertical could set new standards for how consumer-facing platforms leverage blockchain.
DaxPrime’s Conclusion
The decision by a senior BlackRock executive to join an Ethereum-native company like SharpLink Gaming is not a one-off anomaly. It reflects a rapidly maturing industry where the center of gravity is shifting from financial speculation to operational integration.
At DaxPrime, we continue to monitor executive movements as a leading indicator of sector confidence and capital rotation. As Ethereum evolves from “store of value” to “platform for value,” such strategic appointments signal where the smart money is going — and what the next phase of crypto utility will look like.

ETH to Lead BTC Over Next 6 Months, Says Galaxy CEOIn a bold forecast that has reignited the debate over crypto market leadership, Galaxy Digital CEO Mike Novogratz stated that Ethereum (ETH) is poised to outperform Bitcoin (BTC) over the next six months, citing improving fundamentals, institutional tailwinds, and critical network upgrades.
Novogratz, a long-time crypto advocate with deep ties to both traditional finance and blockchain innovation, made the statement during an interview at the Digital Asset Summit in New York, sparking renewed discussion about the shifting dynamics between the two largest digital assets by market capitalization.
Ethereum’s Evolving Investment Case
“Ethereum is becoming more than just a smart contract platform,” said Novogratz. “It’s evolving into a foundational layer for the future of finance.”
This confidence is underpinned by Ethereum’s transition to proof-of-stake, reduced energy consumption, and growing usage of Layer 2 scaling solutions like Arbitrum and Optimism. These developments, Galaxy argues, have made Ethereum more attractive to institutional investors who previously stayed away due to scalability concerns and environmental critiques.
Stronger Fundamentals, Expanding Utility
Ethereum’s network revenue—driven by transaction fees and on-chain activity—has consistently outpaced competitors. According to Galaxy’s internal research, Ethereum generated over $2.1 billion in protocol revenue in the first half of 2025, compared to just under $1.5 billion for Bitcoin.
Additionally, the rise of real-world asset (RWA) tokenization, DeFi resurgence, and the adoption of Ethereum-based stablecoins by traditional finance platforms have significantly enhanced ETH’s long-term value proposition.
“Ethereum is no longer a tech experiment. It’s infrastructure,” Novogratz stated.
Bitcoin Still Dominates, But ETH Momentum Grows
While Novogratz remains bullish on Bitcoin, he emphasizes that BTC is now more of a macro hedge than a dynamic growth asset. With institutional investors already heavily exposed to Bitcoin via spot ETFs, the marginal capital over the next cycle may shift toward Ethereum, particularly as ETH-based ETF products gain traction.
“Bitcoin remains the king of store-of-value assets in crypto. But Ethereum is where innovation and yield are happening,” Novogratz added.
Six-Month Outlook
Galaxy projects that ETH could outperform BTC by 20–30% in the second half of 2025, driven by upgrades like Proto-Danksharding, expanding Layer 2 activity, and Ethereum’s role in cross-chain interoperability.
Novogratz also hinted that Galaxy is allocating more capital into Ethereum-based venture projects and staking infrastructure, in anticipation of a “second-layer boom” later this year.
Conclusion
While Bitcoin remains the undisputed anchor of the crypto economy, Ethereum’s expanding utility, institutional relevance, and revenue-generating capabilities position it to lead performance in the near term.

Crypto Might Protect You from a Global Debt Crisis | OpinionAs sovereign debt levels surge and central banks struggle with inflationary aftershocks, investors worldwide are seeking new forms of financial protection. While gold and U.S. Treasuries have historically served as safe-haven assets, the current global debt structure presents unprecedented risks. In this context, cryptocurrencies — particularly decentralized, deflationary assets — may offer a unique hedge against systemic instability.
A Mounting Crisis
According to the IMF, global debt reached $315 trillion in Q2 2025, led by the U.S., China, and EU member states. Rising interest rates have pushed sovereign debt servicing costs to record highs. At the same time, inflation remains sticky, and fiscal deficits continue to expand — creating a scenario where traditional instruments may no longer preserve purchasing power.
Credit downgrades of major economies — including a recent warning from Moody’s on the UK and France — further highlight the fragility of fiat-based systems.
Why Crypto Provides an Alternative
Fixed Supply:
Bitcoin’s 21 million cap remains untouched. In an era of unlimited fiat printing, scarcity is a value proposition in itself.
Decentralization:
Cryptocurrencies operate outside centralized banking systems. In case of capital controls or currency devaluation, digital assets remain globally transferable and resistant to censorship.
Accessibility and Liquidity:
From stablecoins to DeFi protocols, crypto provides 24/7 access to financial tools — often with greater transparency than traditional banks.
Not Without Risk
Crypto remains volatile and vulnerable to regulatory shifts. The recent ETF delays by the SEC and tax crackdowns in G20 countries underscore the uncertain terrain. However, compared to the looming debt traps of fiat economies, some volatility may be an acceptable tradeoff for autonomy and deflationary exposure.
Growing Institutional Interest
Firms like Fidelity, BlackRock, and BBDelta have significantly increased their crypto allocations, particularly in ETH and BTC. Even central banks are researching CBDCs and holding digital reserves as a contingency plan.
Conclusion
While crypto isn’t a panacea, it represents a credible hedge in a world where fiat debt continues to spiral. For risk-aware investors, a balanced portfolio in 2025 likely includes a thoughtful allocation to digital assets — not for speculation, but for protection.
The debt crisis is not a distant threat. It’s unfolding now — and cryptocurrency may be one of the few tools with the potential to navigate what comes next.

Diageo plc Quote | Chart & Forecast SummaryKey Indicators On Trade Set Up In General
1. Push Set Up
2. Range Set Up
3. Break & Retest Set Up
Notes On Session
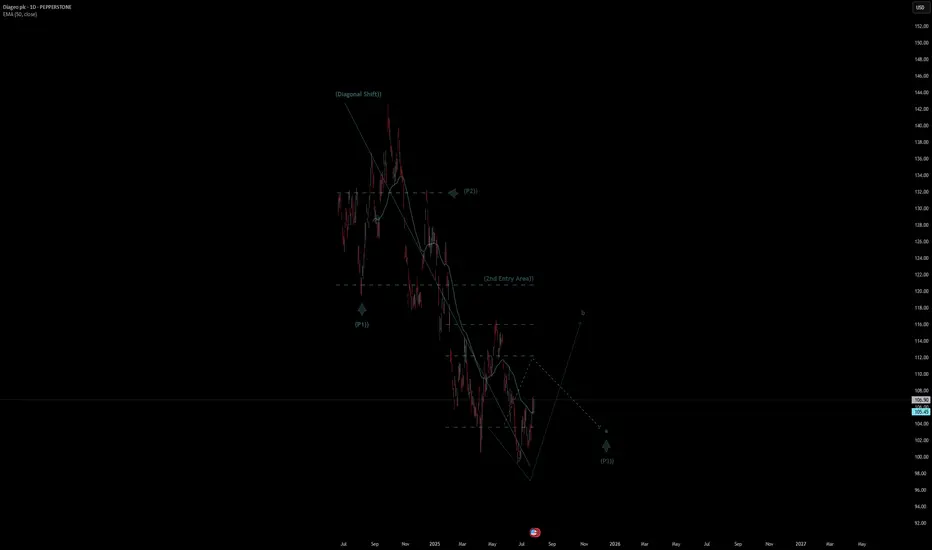
# Diageo plc Quote
- Double Formation
* (Diagonal Shift)) | Completed Survey
* (2nd Entry Area)) | Subdivision 1
- Triple Formation
* (P1)) / (P2)) & (P3)) | Subdivision 2
* (TP1) = a / Long Consecutive Range
* (TP2) = b / Short Consecutive Pullback | Subdivision 3
* Daily Time Frame | Trend Settings Condition
- (Hypothesis On Entry Bias)) | Regular Settings
- Position On A 1.5RR
* Stop Loss At 113.00 USD
* Entry At 107.00 USD
* Take Profit At 98.00 USD
* (Downtrend Argument)) & No Pattern Confirmation
- Continuation Pattern | Not Valid
- Reversal Pattern | Not Valid
* Ongoing Entry & (Neutral Area))
Active Sessions On Relevant Range & Elemented Probabilities;
European-Session(Upwards) - East Coast-Session(Downwards) - Asian-Session(Ranging)
Conclusion | Trade Plan Execution & Risk Management On Demand;
Overall Consensus | Sell
HMC Capital Ltd Quote | Chart & Forecast SummaryKey Indicators On Trade Set Up In General
1. Push Set Up
2. Range Set Up
3. Break & Retest Set Up
Notes On Session
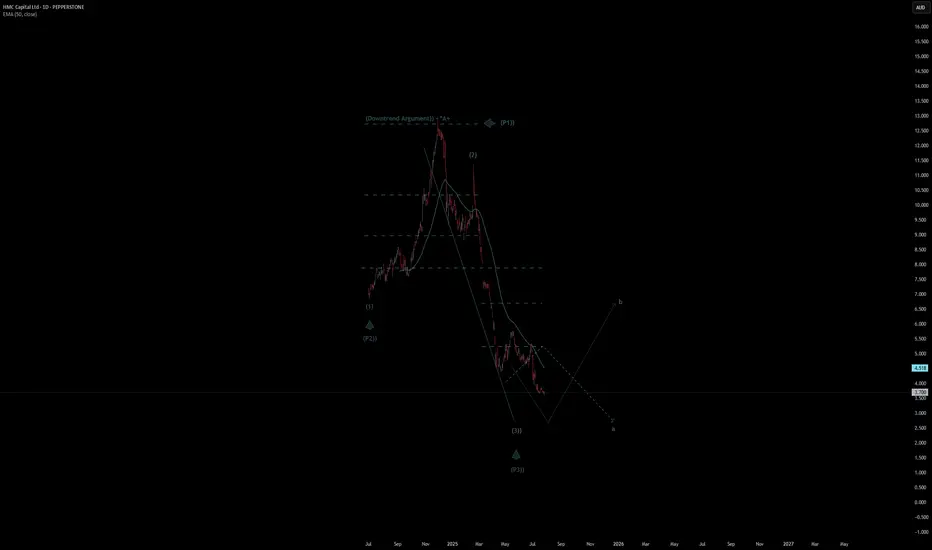
# HMC Capital Ltd Quote
- Double Formation
* (Downtrend Argument)) - *A+ | Completed Survey
* Ongoing Wave (3)) - *(P3)) | Subdivision 1
- Triple Formation
* (P1)) / (P2)) & (P3)) | Subdivision 2
* (TP1) = a / Long Consecutive Range
* (TP2) = b / Short Consecutive Pullback | Subdivision 3
* Daily Time Frame | Trend Settings Condition
- (Hypothesis On Entry Bias)) | Indexed To 100
- Position On A 1.5RR
* Stop Loss At 80.00 AUD
* Entry At 50.00 AUD
* Take Profit At 10.00 AUD
* (Downtrend Argument)) & No Pattern Confirmation
- Continuation Pattern | Not Valid
- Reversal Pattern | Not Valid
* Ongoing Entry & (Neutral Area))
Active Sessions On Relevant Range & Elemented Probabilities;
European-Session(Upwards) - East Coast-Session(Downwards) - Asian-Session(Ranging)
Conclusion | Trade Plan Execution & Risk Management On Demand;
Overall Consensus | Sell
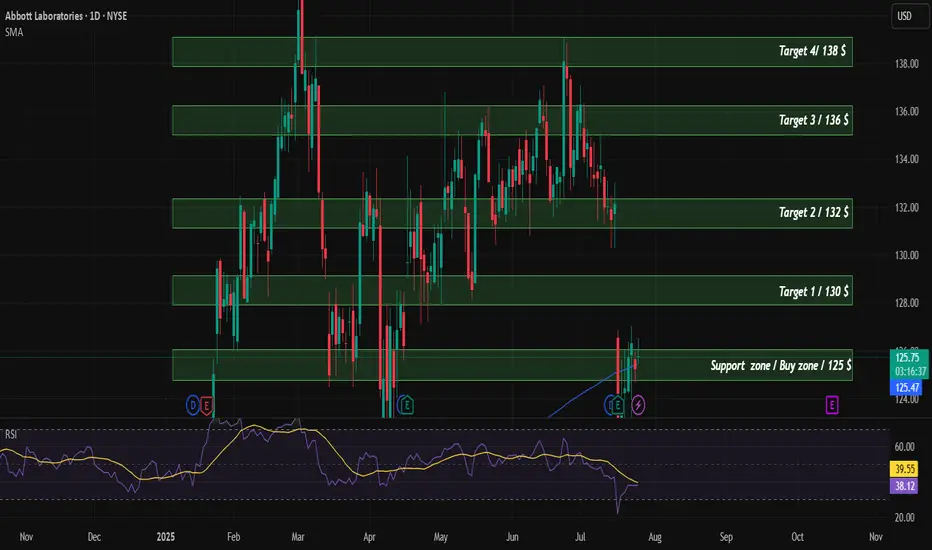
ABT Buy/LongTechnical analysis of the company. According to financial indicators, the company is currently undervalued and is supported by SMA200. The target price for the company is $142.
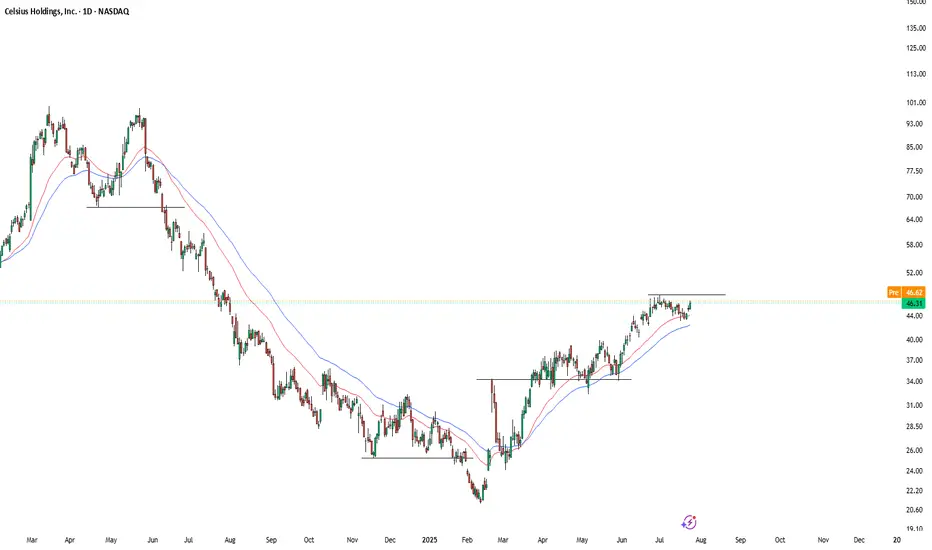
CELH Eyes Upside Momentum as Consolidation TightensCelsius Holdings, Inc. ( NASDAQ:CELH ) has shown a notable recovery from its early 2025 lows, steadily climbing and recently consolidating around the $46 level. The stock is currently trading above both the short-term (red) and mid-term (blue) moving averages, which are sloping upward—indicating bullish momentum.
The recent price action reveals a tight consolidation just below the previous local highs around $47–$48. If CELH can decisively break above this resistance zone with increased volume, it may trigger a short-term breakout and open room toward the $52–$55 range, even $60.
Conversely, if the stock fails to break above resistance and falls below the $43–$44 support area (near the moving averages), it could trigger a short pullback toward the $40 level.
Key Levels to Watch:
Resistance: $47.50–$48.00
Support: $43.00–$44.00
Breakout Target: $52.00–$55.00 / extended $60
Momentum remains positive, but confirmation through volume and follow-through price action is essential for any breakout to sustain.
USDNOK short potential setupUSDNOK recently broke down below the monthly 50ema (overlayed on this 4h chart) and has rejected off the daily 20ema (overlayed) twice this week. RSI is showing bearish momentum after a brief overbought period while the PA has remained in a strong downtrend. Short setup potential is evident but not certain.
I'm a cat not a financial advisor.

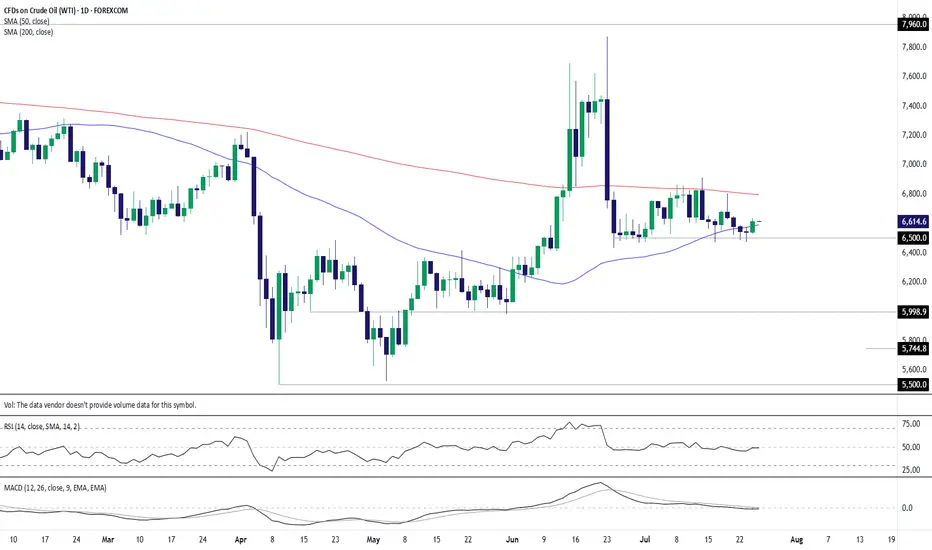
WTI crude: $65 floor holds again as bulls test 50-day MAAfter nine failures to break and close beneath $65 per barrel over the past month, you have to wonder how much longer bears will persist in attempting to take out the level. Following a nice pop higher on Thursday, completing a morning star pattern and closing above the 50-day moving average, it may be time for WTI bulls to have their day in the sun.
For those eyeing long setups, positions could be initiated above the 50-day moving average with a stop beneath for protection against reversal.
As for potential targets, the contract had little luck breaking cleanly above the 200-day moving average earlier this month, making it screen as a suitable level. It’s found just below $68 per barrel today.
Good luck!
DS
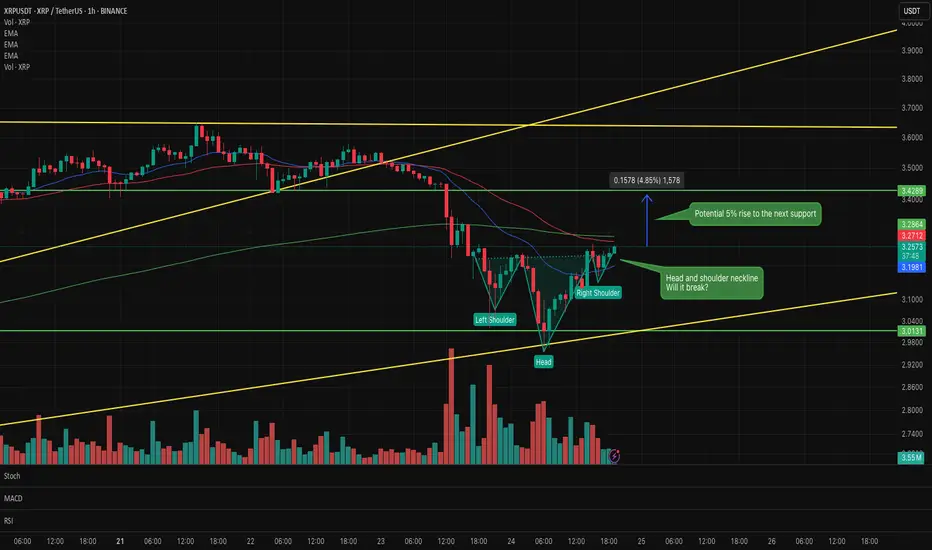
XRP 1hr Inverse head & shoulder formingXRP 1 hr chart inverse head and shoulders forming.
If it breaks the neckline it could break out for a 5% rise to the next resistance.
Watching this closely over the next few hours for confirmation.
NZDUSD is forming an upward cycle trendKiwi dollar is strong at the moment.
It is in an upward trend. If the trend completes 2 cycles and maintains the upward trajectory, I will get in the trade as a Long/Buy.
Patiently watching if the trend continues or breaks down.

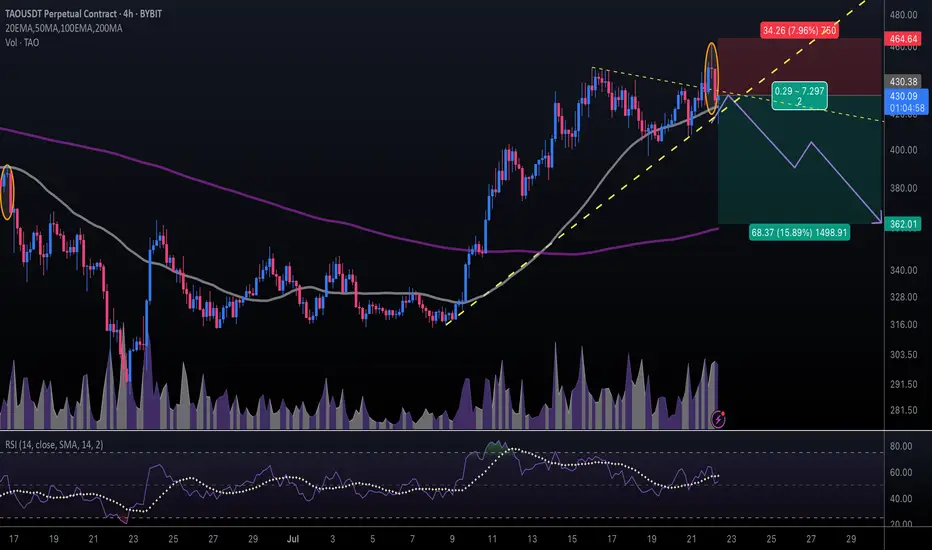
#TAOUSDT #4h (ByBit) Ascending trendline near breakdownBittensor printed an evening doji star deviation, a retracement down to 200 MA support seems next.
⚡️⚡️ #TAO/USDT ⚡️⚡️
Exchanges: ByBit USDT
Signal Type: Regular (Short)
Leverage: Isolated (5.0X)
Amount: 5.0%
Entry Targets:
1) 430.38
Take-Profit Targets:
1) 362.01
Stop Targets:
1) 464.64
Published By: @Zblaba
GETTEX:TAO BYBIT:TAOUSDT.P #4h #Bittensor #AI #DePIN bittensor.com
Risk/Reward= 1:2.0
Expected Profit= +79.4%
Possible Loss= -39.8%
Estimated Gaintime= 1 week
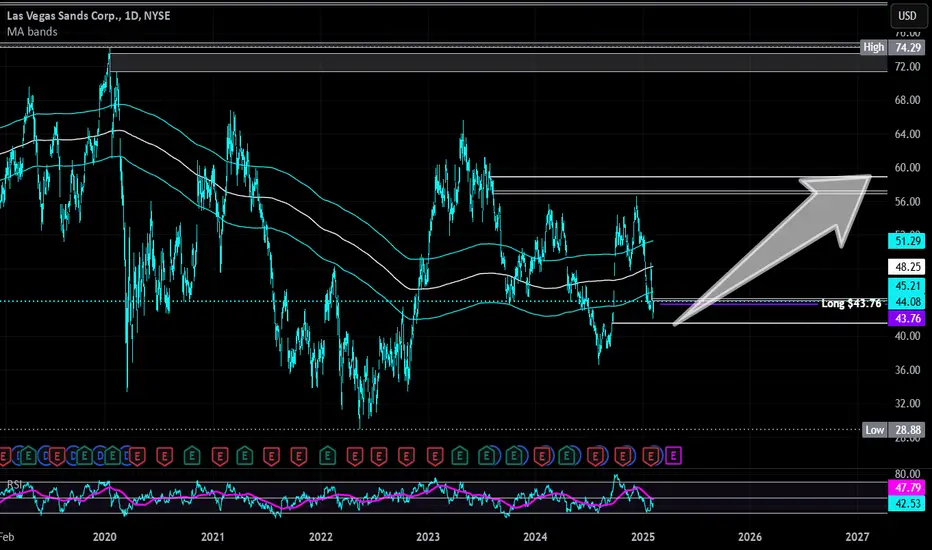
Las Vegas Sands | LVS | Long at $43.76Pros:
Earnings are forecast to grow 13.29% per year
Earnings grew by 18.4% over the past year
2.3% dividend yield
Cons:
Insider selling and exercising of options
Debt-to-equity ratio of 3.8x
Small price gap on the daily chart near $41 that may close prior to a move up.
If people can't buy houses, they will travel... thus, at $43.76, Las Vegas Sands NYSE:LVS is in a personal buy zone.
Targets
$50.00
$57.00
$59.00
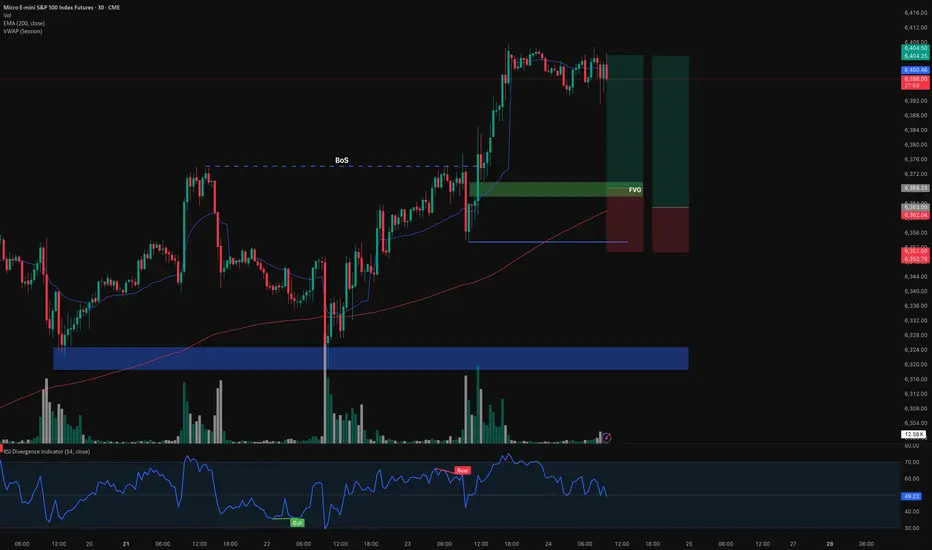
Long MESentry 6338
stop loss 6351
TP 6404.50
1. currently in a uptrend
2. FVG at 6368
3. above 200ema
Before I enter my trade at Id like to look for some market structure to form.
if it breaks below 6353.5 and makes a ChoCh im no longer bullish
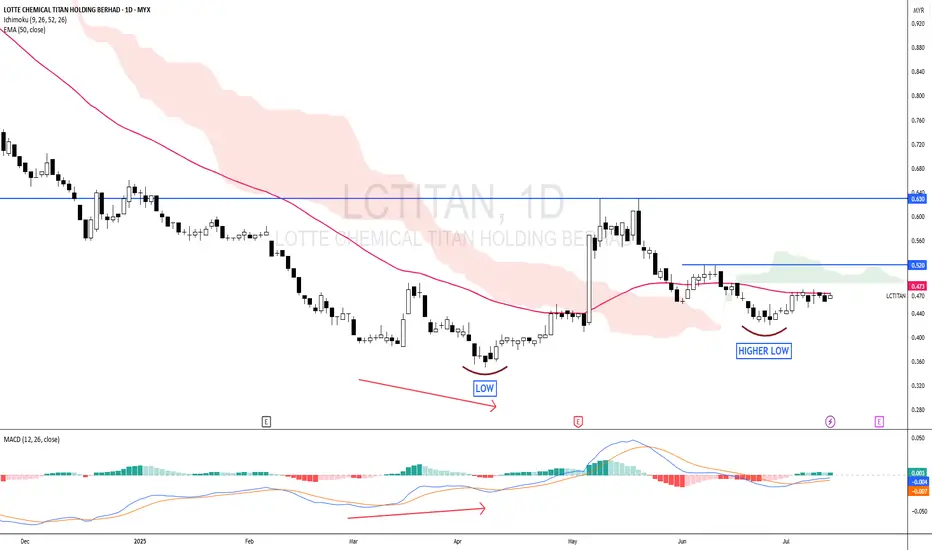
LCTITAN - The LOW is getting HIGHER !LCTITAN - CURRENT PRICE : RM0.470
The stock made a HIGHER LOW recently - this may consider as a half portion of new uptrend is completed. A breakout above RM0.630 will form the higher high structure - which confirm the new uptrend phase.
For short term trading purposes, short term traders may anticipate to buy if the stock breakout nearest resistance of RM0.520 - which will give an entry point at RM0.525. So this is a pending breakout stock. Nearest target will be RM0.580 and RM0.620. Take note that when the price breakout RM0.520 , it will also be above EMA 50 and ICHIMOKU CLOUD - which strengthening the bullish outlook.
ENTRY PRICE : RM0.525
TARGET : RM0.580 and RM0.620
SUPPORT : EMA 50
Notes : The higher low structure of LCTITAN looks like DRBHCOM - I share the link here for reading purposes.

Pi Network Faces Scrutiny as Market Cap Hits $3.4BPi Network, the mobile-first crypto project that attracted millions of users with its "mine-on-your-phone" concept, is facing growing scrutiny as its market capitalization has surged to $3.4 billion, despite lingering concerns over its actual utility and use cases. As hype continues to propel its valuation, the community and broader crypto market are demanding answers: What can Pi really do?
Background and Growth
Launched in 2019 by a team of Stanford graduates, Pi Network aimed to democratize cryptocurrency mining by enabling users to earn tokens on their smartphones without expensive hardware. Through aggressive referral-based marketing and a user-friendly interface, it reportedly attracted over 50 million users globally.
However, after years in beta and a still-limited mainnet release, the Pi token is not yet fully tradable on major exchanges, and its price remains speculative. Despite that, Pi's market cap is estimated at $3.4 billion based on limited OTC (over-the-counter) trading and projected supply metrics.
Utility Concerns Intensify
With a large user base and growing token valuation, the pressure is on for Pi Network to deliver tangible value. Key concerns include:
Lack of utility – Most users cannot use Pi to pay for goods or services in real-world scenarios.
No open mainnet – While a “closed mainnet” has launched, the network still lacks full public blockchain access, hampering transparency and developer participation.
Centralization – Pi’s governance and decision-making remain opaque, raising questions about decentralization and long-term sustainability.
No listings on major exchanges – Without real-time market discovery, token valuation remains speculative and potentially misleading.
Community Reaction
Many early adopters continue to support Pi, viewing it as a long-term project that needs time to mature. Some local communities even organize Pi-based bartering systems. However, critics argue that without real-world use cases, Pi remains a glorified points system rather than a functional cryptocurrency.
The disconnect between market cap and utility has fueled concerns of a speculative bubble. In fact, some compare Pi to past projects like BitConnect, which promised much but delivered little.
The Road Ahead
To maintain its momentum and justify its valuation, Pi Network must:
Open its mainnet to public interaction and developer contributions.
Secure listings on reputable exchanges to enable transparent price discovery.
Establish real-world utility, such as integration with e-commerce, payments, or DeFi applications.
Improve transparency around tokenomics, governance, and long-term roadmap.
Failure to address these areas could result in an erosion of community trust and capital flight to more proven projects.
Conclusion
Pi Network’s $3.4 billion market cap is both impressive and problematic. It highlights the power of community-driven growth but also underscores the risks of hype-driven valuations. As the crypto market matures, utility—not just marketing—is what will determine long-term success. For Pi, the clock is ticking to move from potential to performance.

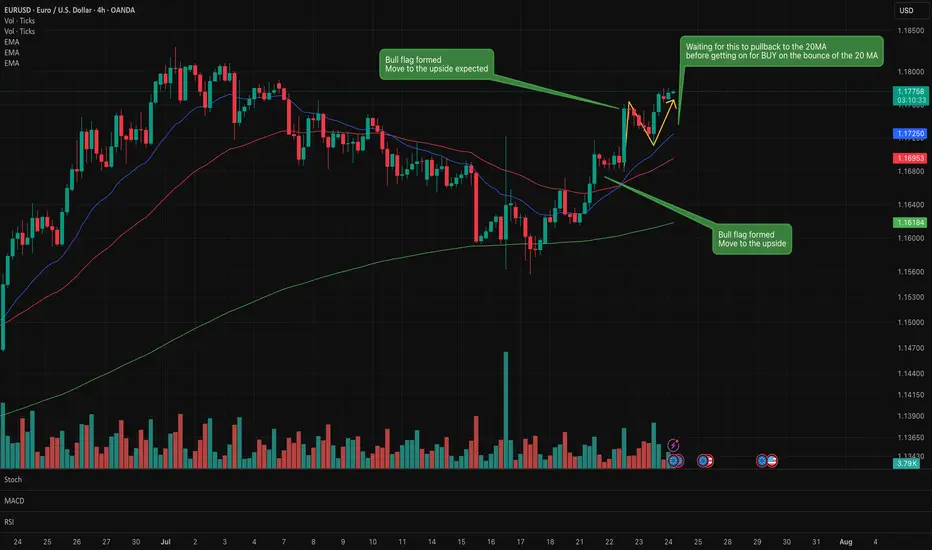
EUR/USD Lots of bull flags formed on the recent chart. Buy/Long Lots of bull flags on this chart which confirmed a move to the upside.
Waiting for a little pullback to the 20MA before considering a buy long order
Waiting to see if this small bear flag forms.
A very interesting instrument to watch at the moment. Full of various signals.
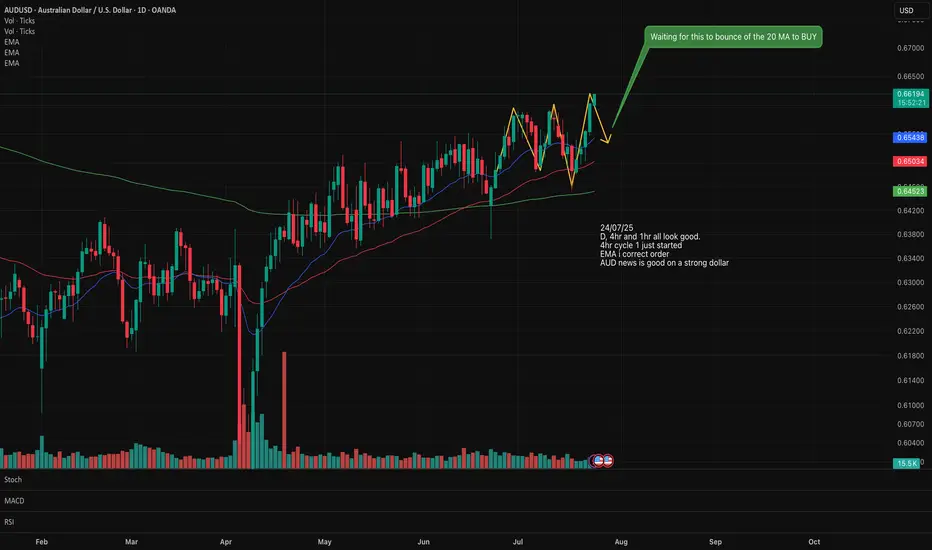
AUS/USD Long/Buy setting upLooking at AUS/USD for a potential Buy setting up on the Daily and 4 hr.
EMA has lined up in the correct stacking order.
An upward trend can be observed. The 20 has crossed over the 50.
We are starting a new Cycle 1 on the upward so I will wait for the pull back to the 20MA which will form the Cycle 2 then wait for the new Cycle 1 on the upward to start again before I buy in.
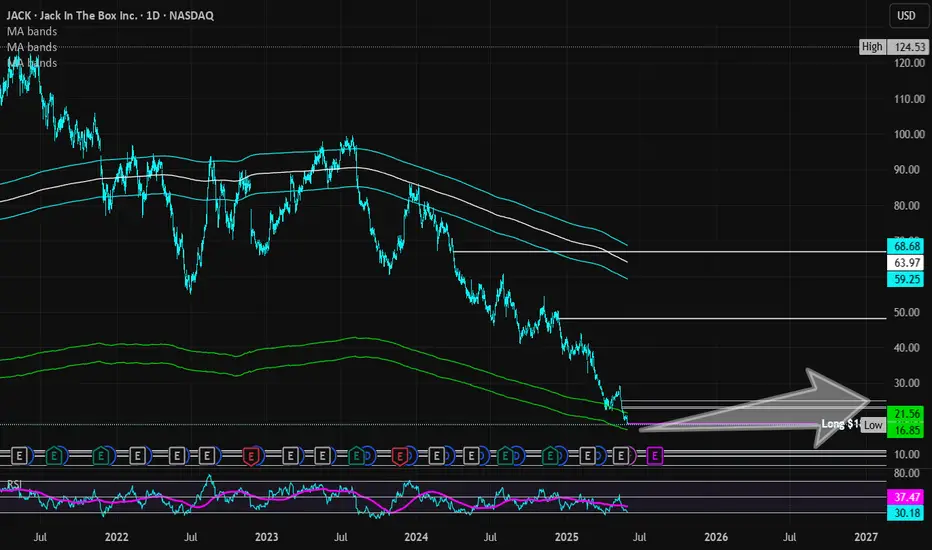
Jack in the Box | JACK | Long at $18.48Jack in the Box NASDAQ:JACK has taken a massive hit to its stock price since its peak in 2024 at just over $124 a share. It's currently trading around $18 and has entered my "crash" simple moving average zone. More often than not, this area signifies a bottom (or future bounce), but I view it more as a consolidation area to accumulate shares. Float = 18M; short interest = 19%...
Looking at NASDAQ:JACK fundamentally, this isn't the healthiest of restaurant companies. It is using a high level of debt to finance its operations and a high dividend yield of 9.28%. The company's revenue and profits have been slowly declining since 2023, as well. However, after 2025, the company anticipates a slow turnaround to begin. It will be closing 80-120 restaurants across the U.S. in 2025, which is a positive to help the company moving forward. NASDAQ:JACK also just got a new CFO and they are (at least from an outsider's view) attempting to change to generate share value. At this share price, I believe the company is in dire straits to get some investor confidence back. It's a strong name with long history.
While the stock price may hit true resistance at just under $17, NASDAQ:JACK is in a personal buy zone at $18.48. Targets are set low due to economic uncertainty.
Targets:
$23.00 (+24.5%)
$25.00 (+35.3%)