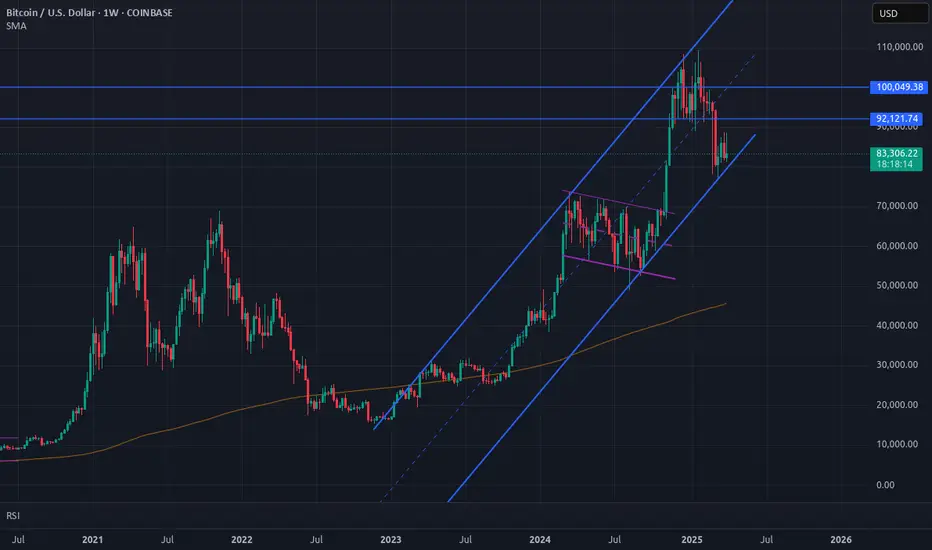
Is Bitcoin in one big parallel channel?Are we at the bottom of a massive parallel channel?
This seems like a good place to buy.
Also be prepared to buy at the weekly 200MA, if that happens.
Moving Averages
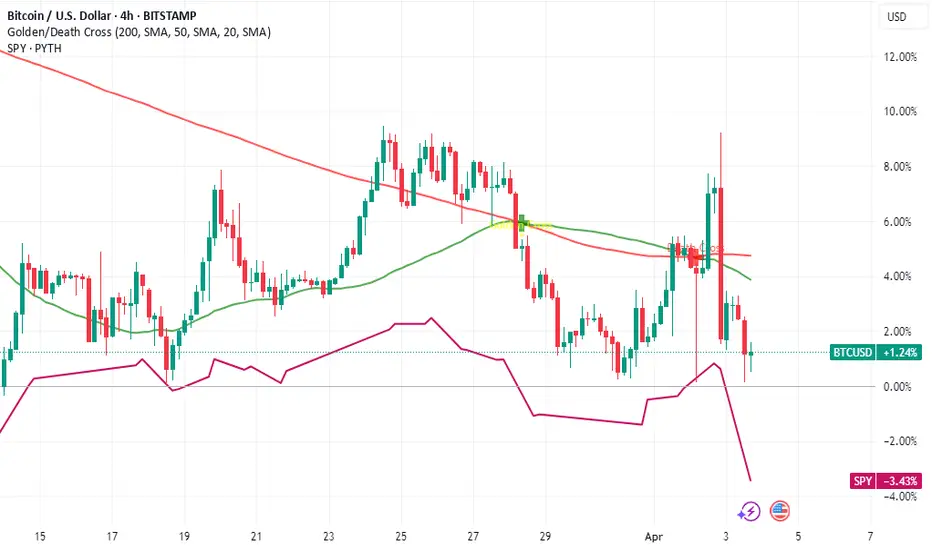
$BTC Retests 50WMA For The First Time in 217 DaysAs expected,
CRYPTOCAP:BTC retested the 50WMA for the first time since September 2024 (217 days ago).
₿itcoin historically has outsized reactions when this happens.

$SPX Flirting With a Bear Market alongside $QQQ NASDAQ fell another 4% touching down 26%
S&P 500 walking a tight rope falling 21% to play with the idea of a Bear Market, but has rebounded a bit.
NASDAQ:QQQ did have a stronger response from buyers than SP:SPX
Nonetheless, we would need several WEEKLY closes sub 20% losses to enter a textbook Bear Market.
Gold Scalping Analysis GOLD has resistance above can plan a quick scalp with 0.08% sl and 0.40 % targets

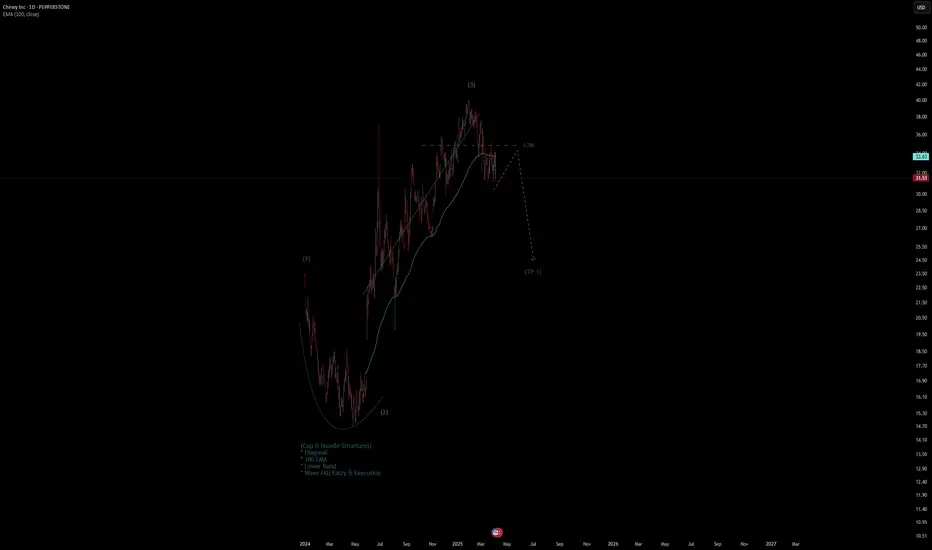
Chewy Inc Stock Quote | Chart & Forecast SummaryKey Indicators On Trade Set Up In General
1. Push Set Up
2. Range Set up
3. Break & Retest Set Up
Notes On Session
# Chewy Inc Stock Quote
- Double Formation
* (Cup & Handle Structure)) | Completed Survey
* Wave (4)) Ongoing Entry | Subdivision 1
- Triple Formation
* 0.786 Area Retracement | Subdivision 2
* (TP1) | Subdivision 3
* Daily Time Frame | Trend Settings Condition
- (Hypothesis On Entry Bias)) | Indexed To 100
- Position On A 1.5RR
* Stop Loss At 148.00 USD
* Entry At 135.00 USD
* Take Profit At 116.00 USD
* (Uptrend Argument)) & Pattern Confirmation
* Ongoing Entry & (Neutral Area))
Active Sessions On Relevant Range & Elemented Probabilities;
European-Session(Upwards) - East Coast-Session(Downwards) - Asian-Session(Ranging)
Conclusion | Trade Plan Execution & Risk Management On Demand;
Overall Consensus | Neutral
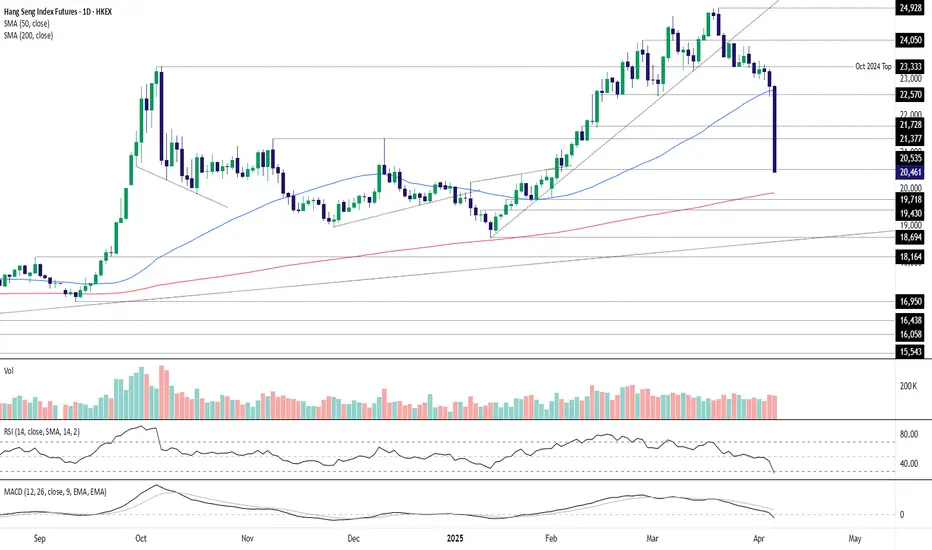
Hang Seng Bull Market ImplodesHong Kong’s Hang Seng is imploding with the price cascading lower after breaking support at 22,570 earlier today. The subsequent unwind saw 21,728 and 21,377 melt like a hot knife through butter before the price eventually bounced at 20,535 — another minor level that acted as both support and resistance earlier this year. That makes it an initial level of interest for those contemplating setups involving Hang Seng futures.
A clean break of 20,535 would put a retest of minor levels such as 19,718 and 19,430 on the table. The 200-day moving average is also found at 19,891, although one glance at how price has interacted with it previously suggests it may be entirely ignored in this environment. Beyond that, the uptrend dating back to the early 2024 low is another level to watch, although it hasn’t been tested enough to declare it meaningful downside support. It’s located around 18,550 today, just beneath the January 2025 swing low of 18,694.
While they provided no support earlier today, 21,377 and 21,728 may still be of interest if bears choose to set up shop above either. Watch the price interaction at these levels if the Hang Seng gets back there.
Momentum signals remain firmly with the bears, with MACD and RSI (14) both negative and trending strongly lower. While RSI is now oversold, it was also extremely overbought earlier this year — and that didn’t stop further gains at the time. The same could easily apply on the downside. The overall momentum signal favours selling rips and downside breaks near term.
Good luck!
DS
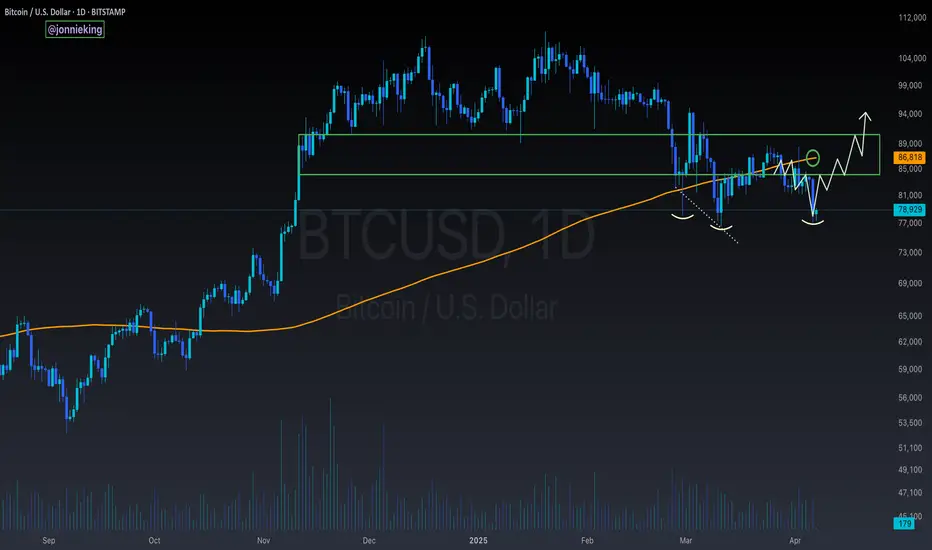
$BTC Inverse Head and Shoulders Finally FormedAnd just like that, the Death Cross has formed the right shoulder for the Inverse H & S idea I formed on March 14th
We may sit a bit more downside to retest the 50WMA at $76k for confirmation
If we get a V-shaped recovery tomorrow, this very well could be the bottom for CRYPTOCAP:BTC
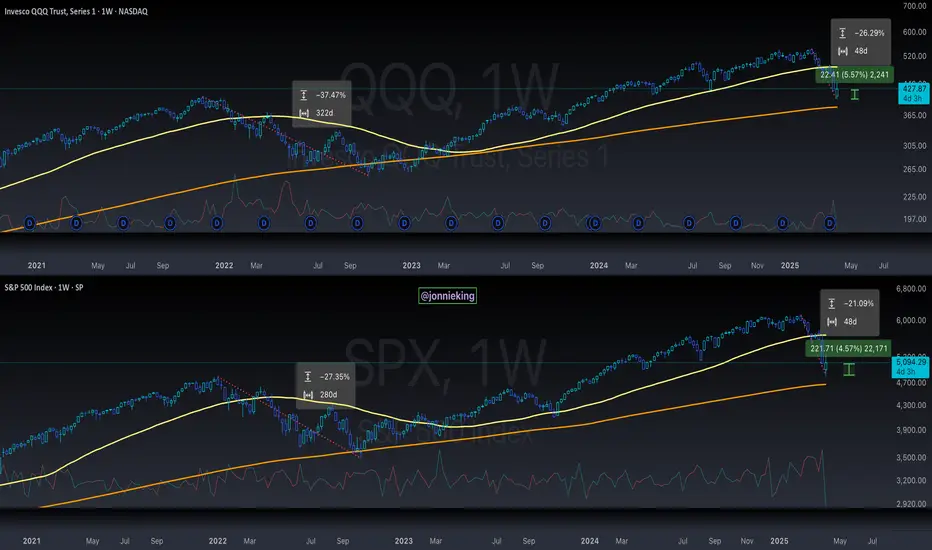
$QQQ Has Officially Entered a Bear Market $SPX is CloseNASDAQ HAS OFFICIALLY ENTERED A BEAR MARKET, DOWN ~22%
NASDAQ:QQQ 2022 Bear Market bottomed ~37%
just below the 200WMA
S&P 500 is not quite there yet, down only ~17.5%
SP:SPX 2022 Bear Market bottomed ~27% a tick below the 200WMA

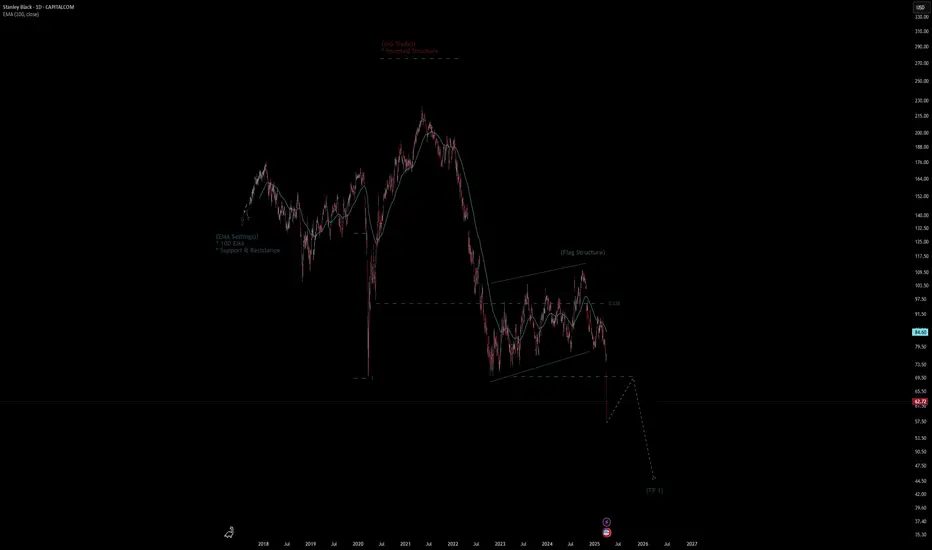
Stanley Black Stock Quote | Chart & Forecast SummaryKey Indicators On Trade Set Up In General
1. Push Set Up
2. Range Set up
3. Break & Retest Set Up
Notes On Session
# Stanley Black Stock Quote
- Double Formation
* (EMA Settings)) | Completed Survey
* (No Trade)) + Inverted Structure | Subdivision 1
- Triple Formation
* (Flag Structure) & Short Set Up | Subdivision 2
* (TP1) | Subdivision 3
* Daily Time Frame | Trend Settings Condition
- (Hypothesis On Entry Bias)) | Indexed To 100
- Position On A 1.5RR
* Stop Loss At 73.00 USD
* Entry At 63.00 USD
* Take Profit At 47.00 USD
* (Downtrend Argument)) & Pattern Confirmation
* Ongoing Entry & (Neutral Area))
Active Sessions On Relevant Range & Elemented Probabilities;
European-Session(Upwards) - East Coast-Session(Downwards) - Asian-Session(Ranging)
Conclusion | Trade Plan Execution & Risk Management On Demand;
Overall Consensus | Sell
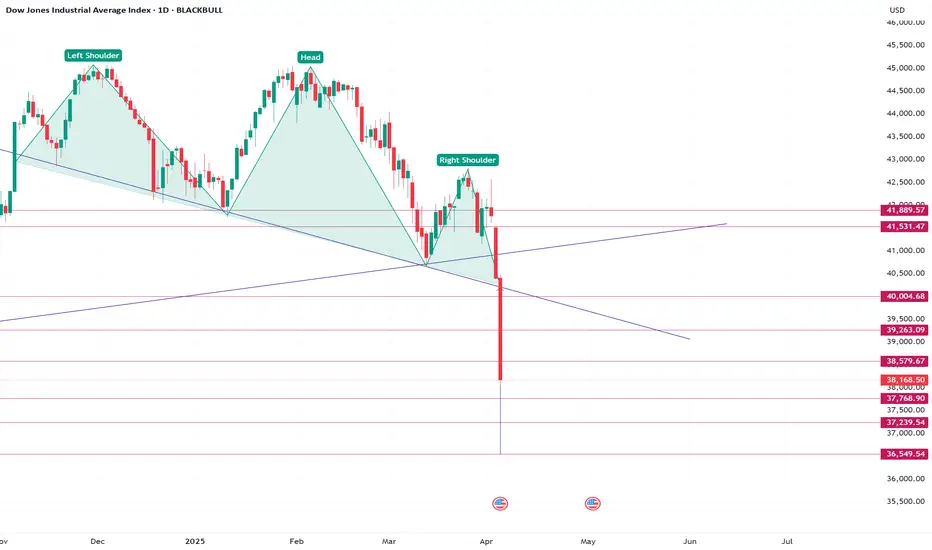
Dow jones - Head & Shoulder formation - Towards 36,500Dow Jones has Head & Shoulder breakdown,
With this it will have following targets possible,
37700 - 37200 - 36500
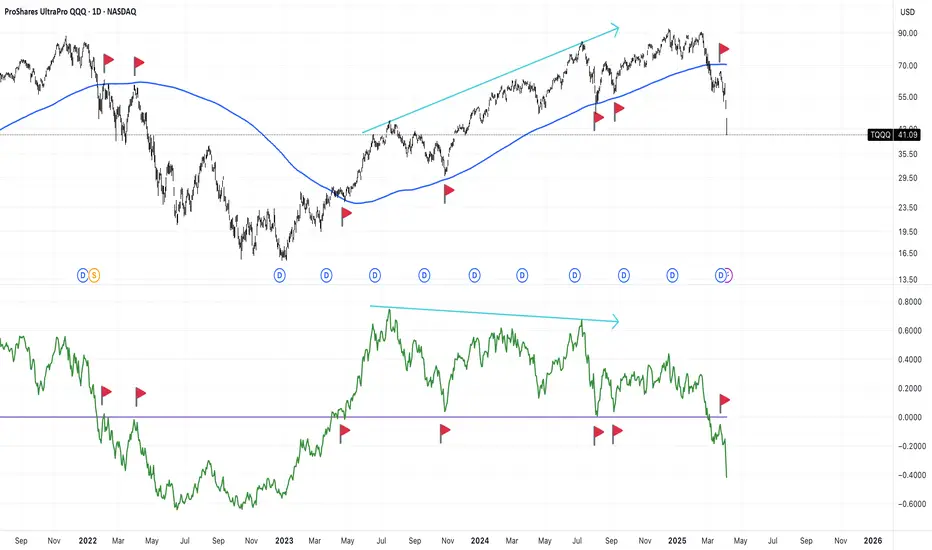
NASDAQ Long Term: Deep in Bear MarketAn indicator works until it does not.
The SMA256 on the DAY chart of NASDAQ (QQQ/TQQQ) )has been respected multiple times as both supports and resistances since the end of COVID bullish run starting 2022.
For long-term trend-following traders, this chart shows we are now deep in the bear market (trend reversal happened in early March), stop placing long positions until the next trend reversal is clear.
This 5 Step System Boosts The Rocket Booster StrategyThis 5 Step System Boosts The Rocket Booster Strategy
1. DAY- Strong Buy/Sell
2. 4 HOUR- Strong Buy/Sell
3. 2 HOUR- Strong Buy/Sell
4. 1 HOUR- Strong Buy/Sell
5. 30 MINUTES- Strong Buy/Sell
In this video we dive into the best way to trade forex
now even though it looks easy at a glance you need
to be careful.
Thats why i made this video for you
because i want to show you
how exactly the strategy works
Trust the process but always learn how to
verify this strategy using technical analysis
and thats the power of this video inside
it am showing you how to confirm the entry signal
using technical analysis
Watch this video to learn more.
Rocket boost this content to learn more
Disclaimer:Trading is risky please learn risk
management and profit taking strategies
and feel free to use a simulation trading account.

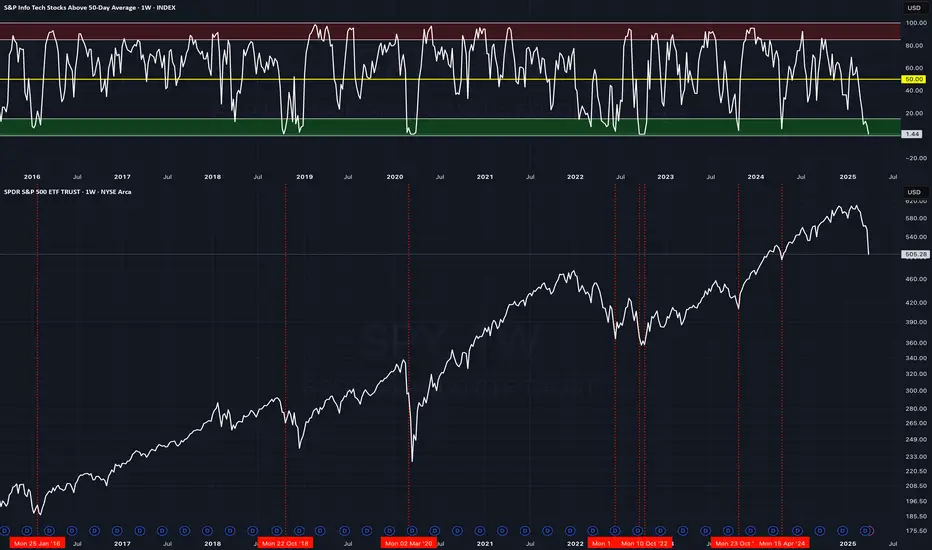
SKFI vs SPY - At OVERSOLD LevelsThere are only 1.44% of S&P Info Tech Stocks above the 50 DMA. Looking at history dating back to 2015, we generally get bounces around these zones. Even if bounces come, you would want SKFI to get back over the 50% range and hold. Failure to get back over and hold has historically let to more downside.
Gold is Past Due for a PullbackReason #1: Gold reached $3000/oz and it has a strong tendency to pullback after reaching $1000 multiples for the first time as can be seen on the chart, specifically when it first reached $1000 and $2000. $1900 which is a whole number in the ballpark of $2000 was also stiff resistance in 2011.
Reason #2: Gold has been above the 52-week simple moving average for over 1 year. This alone is not reason enough to go short, as gold can stay above the 52-week average for 3 years like it did starting in 2008, but it is indicative of gold having rallied for an extended period of time without having any routine pullbacks. In the absence of routine pullbacks, gold can be said to be "past due" for a pullback the same way a person can be said to be "past due" for a dental appointment. A person being past due for a dental appointment isn't necessarily going to go to the dentist any time soon, but they will have to go eventually and the longer they put it off, the more cavities they'll have to have filled and possibly root canals once they do. This "number of days above moving average" metric is plotted at the bottom of the chart.
Reason #3: Gold tends to correct during stock market crashes. If the stock market keeps crashing, gold will likely follow, as it more often than not does.
Reason #4: Precious metals and industrial metals have dropped tremendously with the "Liberation Day" and retaliatory tariff announcements. Gold has been holding up like a champ in comparison. If other metals are rallying, it might not be a great time to short gold, but if they continue dumping or hold steady at or near current levels, gold may very well follow suit due to being in the same commodity family. Not a great reason, but a reason.
Reason #5: Gold is extended. Draw any trendline, look at any indicator, gold is flying high. This is similar to reason #2 but is less specific.
One might consider looking to catch downswings, particularly when price is below 3000. Gold is long-term bullish, but poised for downside price action in the near term.
Previous peak to troth moves with similar setups:
May 2006: -25.76% over 5 weeks
Mar 2008: -18.15% over 6 weeks
Sep 2011: -20.19% over 3 weeks
Aug 2020: -14.97% over 17 weeks
Current move: -4.8% over 1 week
2700 (-14.88%) before first week of August 2025 is a comparable move to the Aug 2020 move.
2530 (-20.12%) by April 25th 2025 is a comparable move to the Sep 2011 move.

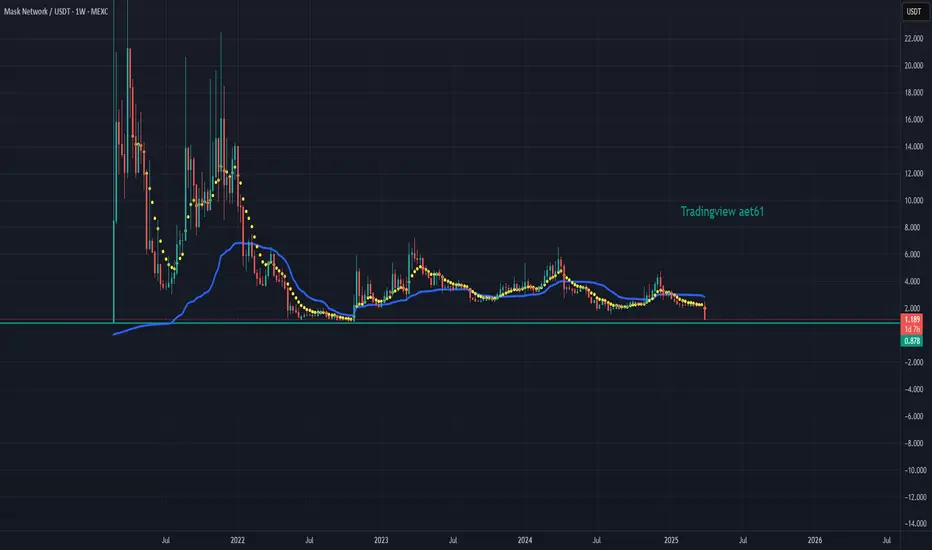
MASKUSDT // 0.878 is our strong support point. Cutting losses in possible closings below 0.878 will be the right decision. According to your risk understanding, our first take profit and 8 exponential average. second profit point is the Kaufman indicator.
Bega Cheese Ltd Stock Quote | Chart & Forecast SummaryKey Indicators On Trade Set Up In General
1. Push Set Up
2. Range Set up
3. Break & Retest Set Up
Notes On Session
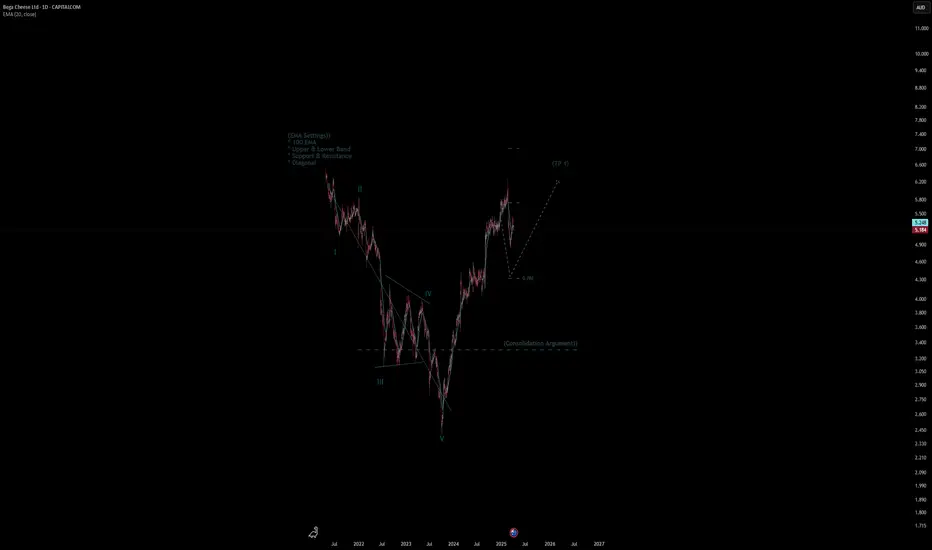
# Bega Cheese Ltd Stock Quote
- Double Formation
* (EMA Settings)) | Completed Survey
* 012345 Wave Feature | Subdivision 1
- Triple Formation
* (Consolidation Argument)) & 0.786 Area Retest | Subdivision 2
* (TP1) | Subdivision 3
* Daily Time Frame | Trend Settings Condition
- (Hypothesis On Entry Bias)) | Indexed To 100
- Position On A 1.5RR
* Stop Loss At 71.00 AUD
* Entry At 80.00 AUD
* Take Profit At 94.00 AUD
* (Ranging Argument)) & No Pattern Confirmation
* Ongoing Entry & (Neutral Area))
Active Sessions On Relevant Range & Elemented Probabilities;
European-Session(Upwards) - East Coast-Session(Downwards) - Asian-Session(Ranging)
Conclusion | Trade Plan Execution & Risk Management On Demand;
Overall Consensus | Buy
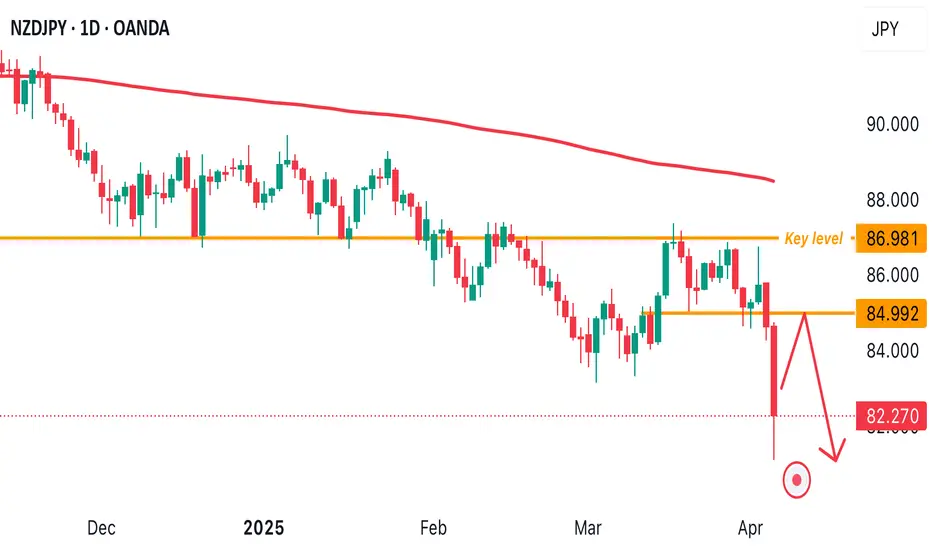
NZD/JPY DAILY TIMEFRAME CONTINUES TO DROP! POSITION FOR A SELLPrice dropped lower which further showed weakness In NZD against JPY .Coming week, I anticipate a retracement to 84.992 for a further sell. The OVERLALL market flow remains bearish coupled with the 200EMA showing bearish sentiment. A sell opportunity is envisaged once price retraces to 84.992
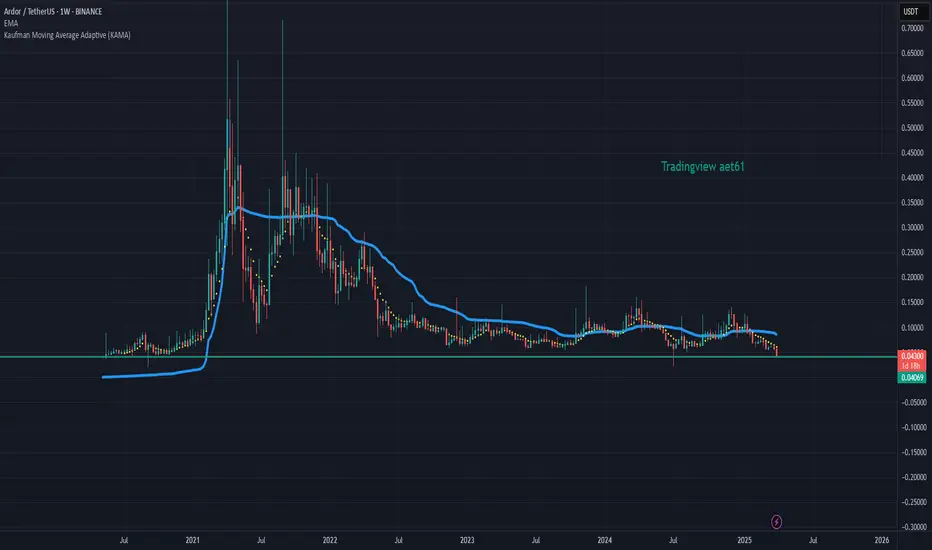
ARDRUSDT // According to your risk perception, our first target point is 8 exponential moving average. Our second target point is Kaufman indicator. Stop loss would be the right decision in closings below 0.04301 level.
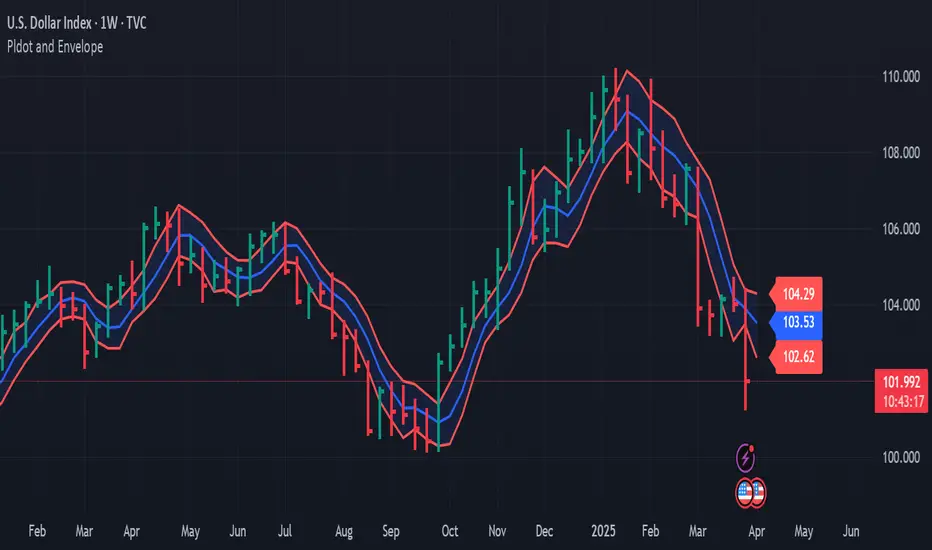
PL Dot Shapes (Detailed Summary)This idea shall focus on the behavior and structure of PL Dot Shapes, which are crucial in identifying market trends, congestion phases, and potential reversals. Let's deep dive on how to interpret PL Dot formations and recognize patterns that signal market movements.
1. Understanding PL Dot Behavior
- Trend:
PL Dots form a straight line, indicating a clear market direction. A trend stops when the market enters congestion.
- Congestion:
PL Dots move horizontally or “snake” sideways, signaling indecision or balance between buyers and sellers.
- Higher Time Period (HTP) Influence:
PL Dots from the HTP influence those in the Lower Time Period (LTP). Inconsistencies between them may indicate no clear pattern.
- Dot Distance:
Refers to the vertical price difference between consecutive PL Dots.
- Increasing Dot Distance: Indicates trend continuation or strength.
- Decreasing Dot Distance: Suggests trend exhaustion or potential reversal.
2. Key PL Dot Patterns
✅ Yes Pattern (Energy Termination Pattern)
Indicates the end of a trend and potential reversal. This pattern is characterized by signs of exhaustion:
1. PL Dot Pullback: PL Dot moves off the main trend channel, and the angle starts sloping down.
2. Decreasing Dot Distance: Dots get closer together, signaling waning momentum.
3. Exhaustion Signs: The dot pulls within range, with closes moving towards the PL Dot, causing congestion entrance.
4. Block Occurrence: Price likely returns to the area of 2-3 dots back.
5. Crest Formation: A PL Dot crest forms, indicating a potential market top.
6. Directional Shift: Dot directions begin turning downward.
7. Challenges: Be alert to price challenging PL Dot crests and valleys.
---
❌ No Pattern (Non-Termination Pattern)
Indicates that the trend is likely to continue without exhaustion:
1. Similar early behavior to the Yes Pattern but lacks signs of exhaustion.
2. No Significant Pullback: PL Dot may pull within range, but no congestion entrance signs appear (bullish).
3. Price Holds: Prices do not return to the 2-3 dots back area.
4. Weak Crests: No strong crest formation, or it's shallow.
5. Stable Direction: Dot direction struggles to turn down.
6. No Challenges: No challenges to PL Dot crests or valleys, confirming trend strength.
---
3. Trend Pattern (Trend Continuation Pattern)
Describes the start or continuation of a trend, especially in the LTP:
1. Dot Opening: PL Dot opens up, with increasing distance between dots, signaling strong momentum.
2. No Exhaustion: Continuation without signs of exhaustion.
3. Energy Refresh: If price reaches the area of 2-3 dots back, expect high energy on any PL Dot refresh.
4. Dots Out of Range: PL Dots move outside the prior bar’s range, confirming a strong trend.
5. Strong Challenges: Challenges to crests only add momentum to the trend.
6. Stable Direction: Dot direction maintains strength with minimal reversals.
---
4. PL Dot Shapes in Congestion
When the market is in congestion, expect the following:
1. Sideways Dots: PL Dots snake sideways, indicating market indecision.
2. Support/Resistance Holding: The 6-1 lines hold both sides of the congestion area.
3. Congestion Exit Signs: Look for signs indicating the market is ready to break out of congestion.
---
Key Takeaways:
- Trend Continuation: Increasing dot distance and out-of-range dots suggest a strong trend.
- Trend Exhaustion (Yes Pattern): Decreasing dot distance, dot pullbacks, and crest formation signal potential reversals.
- No Pattern: Indicates no exhaustion, suggesting the trend will continue.
- Congestion Behavior: PL Dots snake sideways with key support/resistance levels holding firm.
Understanding these patterns helps traders anticipate market behavior, identify trend reversals early, and manage trades effectively.
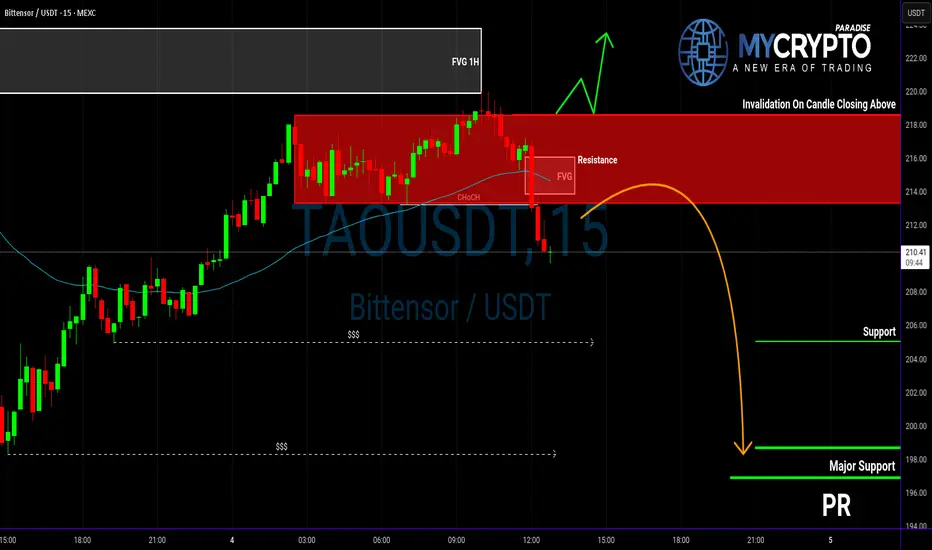
Is TAOUSDT About to Dump Hard? Yello, Paradisers! Are you paying close attention to this subtle shift on TAOUSDT? Because what we’re seeing right now could easily trap late bulls before the real drop even begins…
💎TAOUSDT is currently displaying clear signs of a potential bearish reversal. We’ve observed a bearish Change of Character (CHoCH) developing from the 1H Fair Value Gap (FVG), which is a strong early indication of weakening bullish momentum. To add to this, price has also broken down below the 50 EMA, a technical signal that increases the probability of further downside movement. When both of these elements align, it’s often a precursor to a more significant pullback.
💎If TAOUSDT revisits the recent Fair Value Gap, the trade setup becomes even more attractive, offering a stronger risk-to-reward ratio. That would be the optimal level for entry. However, even from current price levels, the trade still offers a 1:1 risk-to-reward opportunity. While not ideal, it remains viable for more aggressive traders.
💎That said, the entire bearish setup becomes invalid if the price breaks out and closes a candle above the current resistance zone. In such a scenario, it would be wise to step back and wait for more reliable price action to develop before making any further decisions.
Strive for consistency, not quick profits. Treat the market as a businessman, not as a gambler.
MyCryptoParadise
iFeel the success🌴
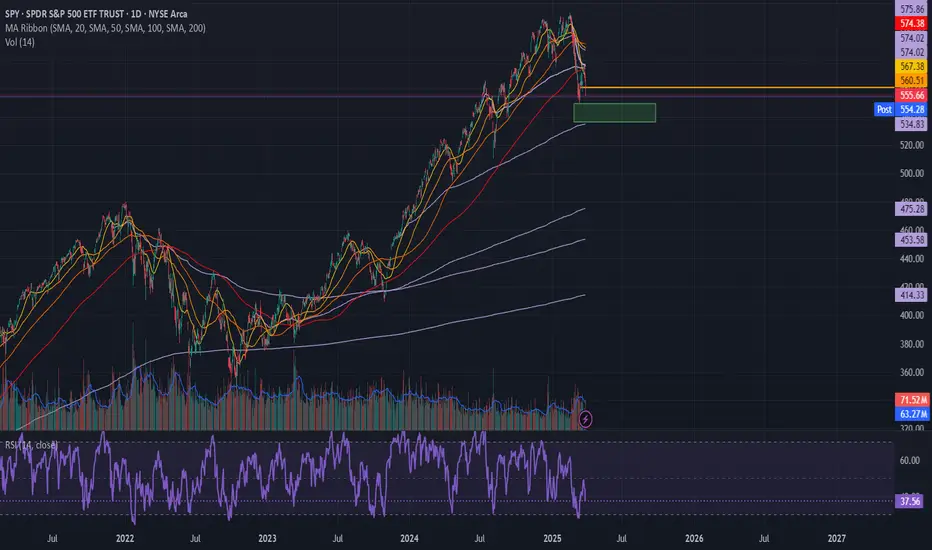
$540 incoming put trade expiring 4/4 or 4/11
AMEX:SPY
I start these Anchored VWAPs where the volume was the lowest before a major upside or downside.
When I entered this trade $540 expiring 4/4 was at $.5 on 3/27 on Thursday around 9.55am currently $2.06 closing week, however I want to highlight that the $540-$530 would be the major leg down and we might see the $570-$580 levels for first week of June imo.
Note: I am heavily comparing price actions for nowadays with 2022 first half drawdown.
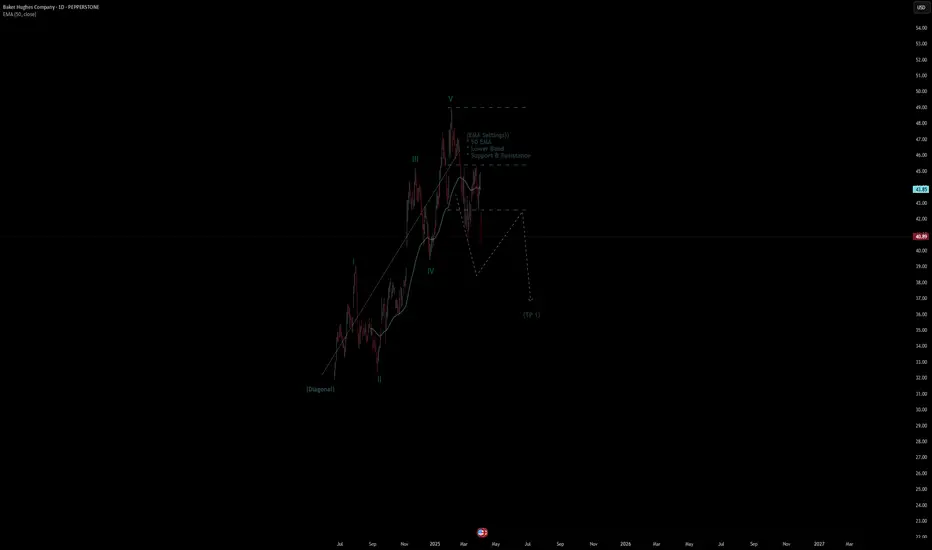
Baker Hughes Company Stock Quote | Chart & Forecast SummaryKey Indicators On Trade Set Up In General
1. Push Set Up
2. Range Set up
3. Break & Retest Set Up
Notes On Session
# Baker Hughes Company Stock Quote
- Double Formation
* Diagonal & Wave Entry Set Up | Completed Survey
* Reversal Area At 49.00 USD| Subdivision 1
- Triple Formation
* (EMA Settings)) | Support & Resistance + Lower Band | Subdivision 2
* (TP1) | Subdivision 3
* Daily Time Frame | Trend Settings Condition
- (Hypothesis On Entry Bias)) | Indexed To 100
- Position On A 1.5RR
* Stop Loss At 133.00 USD
* Entry At 128.00 USD
* Take Profit At 120.00 USD
* (Downtrend Argument)) & No Pattern Confirmation
* Ongoing Entry & (Neutral Area))
Active Sessions On Relevant Range & Elemented Probabilities;
European-Session(Upwards) - East Coast-Session(Downwards) - Asian-Session(Ranging)
Conclusion | Trade Plan Execution & Risk Management On Demand;
Overall Consensus | Sell
Navigating BTC Volatility Storm: Buy, Hold, or Flee?Bitcoin's recent price action has been reminiscent of a rollercoaster, leaving investors grappling with a whirlwind of conflicting signals. From sharp drops mirroring stock market turmoil to the looming "death cross," the cryptocurrency's trajectory is shrouded in uncertainty. Is this a prime buying opportunity, a warning to retreat, or simply another bout of the volatility that defines Bitcoin?
The past few days have been a stark reminder of Bitcoin's inherent volatility. Reports of an 8% drop, coupled with the US stock market shedding $2 trillion in value, sent ripples through the crypto sphere. The catalyst? Concerns surrounding potential US tariffs and their impact on the global economic outlook. This sudden shift in market sentiment triggered a sell-off, reminiscent of the COVID-19 crash in 2020, during which Bitcoin’s pre-pandemic gains evaporated.
Adding to the unease is the looming "death cross," a technical indicator that occurs when the 50-day moving average crosses below the 200-day moving average. Historically, this pattern has signaled bearish momentum. The 2022 death cross, for example, precipitated a significant price drop of nearly 20%. Conversely, "golden crosses," where the 50-day moving average crosses above the 200-day moving average, have historically signaled bullish momentum, triggering rallies of over 500% in 2020 and 2021.
Currently, Bitcoin's 50-day moving average is edging closer to this critical crossover, prompting widespread speculation. Is this a repeat of 2022, or will the market defy historical patterns? The answer, as always, is complex and contingent on a confluence of factors.
One significant factor is the strength of the US dollar. While the dollar's strength can often negatively impact Bitcoin, the current increase in the money supply could potentially counteract this effect, creating a bullish flag pattern. The dollar's inflation may become a catalyst for Bitcoin as a store of value. The global market dynamics are currently shrouded in uncertainty, making it difficult to predict the long-term impact of these factors.
The recent price drops have pushed Bitcoin towards the $80,000 mark, with some analysts predicting a potential fall to $71,000. However, this level could also represent a "sizeable bounce," acting as a strong support zone for Bitcoin. The concept of an "oversold bounce" also comes into play. After a period of intense selling pressure, markets often experience a relief rally as traders capitalize on discounted prices. Whether this materializes remains to be seen.
Is it a Good Time to Buy Bitcoin?
The decision to buy, hold, or sell Bitcoin depends on an individual's risk tolerance, investment strategy, and understanding of the market. Here's a breakdown to consider:
• For the Long-Term Investor:
o Bitcoin's long-term potential remains a compelling narrative. Its decentralized nature, limited supply, and growing adoption continue to attract institutional and retail investors.
o Price volatility is an inherent part of the Bitcoin journey. Historically, periods of sharp declines have been followed by significant rallies.
o Dollar-cost averaging (DCA) can mitigate the impact of volatility by investing a fixed amount at regular intervals, regardless of the price.1
o The strength of the US dollar may become a catalyst for Bitcoin as a store of value.
• For the Short-Term Trader:
o The current volatility presents opportunities for skilled traders to profit from price swings.
o Technical analysis, including monitoring moving averages and support/resistance levels, is crucial for identifying potential entry and exit points.
o However, short-term trading is inherently risky and requires a deep understanding of market dynamics.
o The "death cross" should be monitored carefully.
• For the Cautious Investor:
o The current market uncertainty may warrant a more conservative approach.
o Diversifying investments across different asset classes can help mitigate risk.
o Staying informed about market developments and avoiding emotional trading decisions is essential.
The Death Cross: A Warning or a False Alarm?
The "death cross" is a significant technical indicator, but it's not a foolproof predictor of future price action. Historical data show that while it can signal bearish trends, it's not always accurate. Market conditions, investor sentiment, and macroeconomic factors can all influence Bitcoin's trajectory.
Ultimately, the Bitcoin market remains highly speculative. The current volatility, driven by a confluence of factors, underscores the importance of careful research, risk management, and a long-term perspective. While the "death cross" and market fluctuations may cause short-term panic, the long-term potential of bitcoin, and it's reaction to the weakening dollar, may still produce long-term gains.