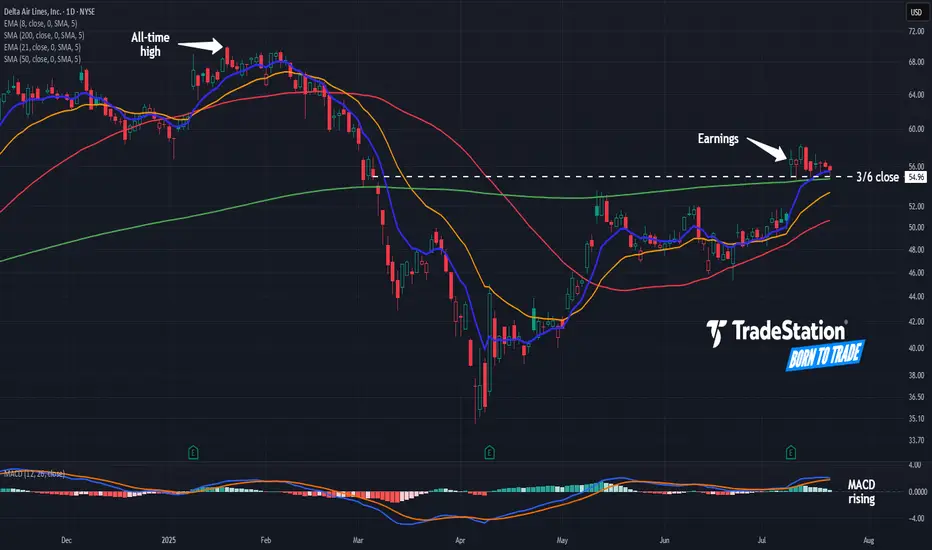
Delta Airlines: Where’s the Pullback?Delta Airlines rallied two weeks ago on strong earnings, and some traders may see further upside.
The first pattern on today’s chart is the tight consolidation pattern since July 10. The lack of pullback could reflect a lack of selling pressure in the transport stock.
Second, DAL has remained above the March 6 closing price of $54.96 and its 200-day simple moving average. Has new support been established above the pre-earnings highs?
Third, the 8-day exponential moving average (EMA) is above the 21-day EMA. MACD is also rising. Those signals may be consistent with short-term bullishness.
TradeStation has, for decades, advanced the trading industry, providing access to stocks, options and futures. If you're born to trade, we could be for you. See our Overview for more.
Past performance, whether actual or indicated by historical tests of strategies, is no guarantee of future performance or success. There is a possibility that you may sustain a loss equal to or greater than your entire investment regardless of which asset class you trade (equities, options or futures); therefore, you should not invest or risk money that you cannot afford to lose. Online trading is not suitable for all investors. View the document titled Characteristics and Risks of Standardized Options at www.TradeStation.com . Before trading any asset class, customers must read the relevant risk disclosure statements on www.TradeStation.com . System access and trade placement and execution may be delayed or fail due to market volatility and volume, quote delays, system and software errors, Internet traffic, outages and other factors.
Securities and futures trading is offered to self-directed customers by TradeStation Securities, Inc., a broker-dealer registered with the Securities and Exchange Commission and a futures commission merchant licensed with the Commodity Futures Trading Commission). TradeStation Securities is a member of the Financial Industry Regulatory Authority, the National Futures Association, and a number of exchanges.
TradeStation Securities, Inc. and TradeStation Technologies, Inc. are each wholly owned subsidiaries of TradeStation Group, Inc., both operating, and providing products and services, under the TradeStation brand and trademark. When applying for, or purchasing, accounts, subscriptions, products and services, it is important that you know which company you will be dealing with. Visit www.TradeStation.com for further important information explaining what this means.
Moving Averages
AUDNZD finding support on critical EMAsAUDNZD is finding support at the daily 200EMA (overlayed on 4H chart) and, more significantly, above the monthly 20EMA (overlayed). Break and hold the daily 10EMA (overlayed) will be key.
If the momentum continues we could see a continuation of the ongoing rally however recent AUD monetary policy meeting minutes seemed to lean dovish.
I'm a cat not a financial advisor.

CADJPY daily 20EMA bounceSimple idea here, CADJPY is testing the daily 20EMA (overlayed on this 4H chart) and recently broke above the monthly 20EMA (overlayed)... if price reclaims the daily 10EMA (overlayer) could be a nice move up.
Very simple trade, tight SL if entering.

Krispy Kreme | DNUT | Long at $3.04Krispy Kreme NASDAQ:DNUT has entered and slightly exited my simple moving average "crash" indicator. More often than not, this zone (currently between $1.88 and $2.88) is a bottom indicator. However, this means there is a still a probability that stock could drop to a value less than $2 in the near future (and I wouldn't be surprised if it gets there). But predicting a "true" bottom is a fool's game. Building a position using data-driven decisions is the best strategy.
Fundamentally, NASDAQ:DNUT has many economic headwinds and a relatively high probably of bankruptcy in the next 24 months. It brought in $1.6 billion in revenue in 2024 and is a great target for takeover, but that requires a crystal ball. Earnings are anticipated to become positive by 2026, but growth is slow. The dividend yield, currently around 4.8%, may get cut in the near-term to help the company financially (again, crystal ball needed). Short interest is 30% with a float of 78 million... Debt to Equity = 0.90x. Essentially, if it can get through 2025, the company predicts it can turn things around into 2026 and beyond.
So, is this a good investment? Fundamentally, many better options are out there. From a technical analysis perspective, a potential opportunity. Thus, a gamble. I'm not betting the farm here, but at $3.04, NASDAQ:DNUT is in a buy zone - with a warning for potentially better entries to emerge in the near future in the $1-$2 range.
Targets:
$3.60
$4.20

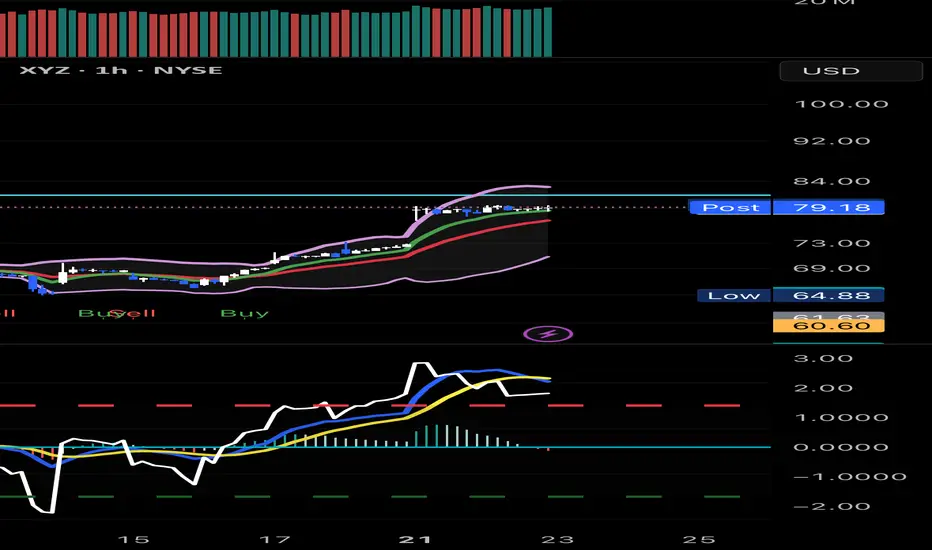
Slight pull back before we hit $90Looks like the one hour chart is respecting the small resistance area of the low $80s.
RSI is well above the overbought range as well as the MACD.
I still remain bullish but believe this may be a little range bound between $75 -$80 until another breakout.
GoHealth | GOCO | Long at $6.05GoHealth NASDAQ:GOCO is a health insurance marketplace and Medicare-focused digital health company that uses a technology platform with machine-learning algorithms to match consumers with Medicare plans (Advantage, Supplement, Part D) and individual health insurance. Understandably, a lot of investors aren't bullish on this stock given all of the healthcare provider and services headwinds. However, if the company can overcome some of their financial issues and bankruptcy risk (debt-to-equity: 1.6x; quick ration of 1.1x, Altman's Z score of .3x), it may dominate the health insurance marketplace (but do not hold my word to that...). This is a purely speculative play at this point - those who are risk averse should absolutely stay away.
What truly caught my eye with this stock is that it is consolidating nicely within my historical simple moving average area. Often, but not always, this leads to a future change in momentum and propels the stock higher. It doesn't signal a bottom and there may be more room for it to plummet, but it is a bullish (overall) sign that shares are likely being accumulated by investors. Given the need for health insurance, particularly Medicare as the US / baby boom population ages, this is a company that may prosper IF it can get its financials in order.
Thus, at $6.05, NASDAQ:GOCO is in a personal buy zone (but very risky). Further declines may be ahead before a stronger move up.
Targets into 2028:
$10.00 (+64.5%)
$12.00 (+97.4%)

The Empirical Validity of Technical Indicators and StrategiesThis article critically examines the empirical evidence concerning the effectiveness of technical indicators and trading strategies. While traditional finance theory, notably the Efficient Market Hypothesis (EMH), has long argued that technical analysis should be futile, a large body of academic research both historical and contemporary presents a more nuanced view. We explore key findings, address methodological limitations, assess institutional use cases, and discuss the impact of transaction costs, market efficiency, and adaptive behavior in financial markets.
1. Introduction
Technical analysis (TA) remains one of the most controversial subjects in financial economics. Defined as the study of past market prices and volumes to forecast future price movements, TA is used by a wide spectrum of market participants, from individual retail traders to institutional investors. According to the EMH (Fama, 1970), asset prices reflect all available information, and hence, any predictable pattern should be arbitraged away instantly. Nonetheless, technical analysis remains in widespread use, and empirical evidence suggests that it may offer predictive value under certain conditions.
2. Early Empirical Evidence
The foundational work by Brock, Lakonishok, and LeBaron (1992) demonstrated that simple trading rules such as moving average crossovers could yield statistically significant profits using historical DJIA data spanning from 1897 to 1986. Importantly, the authors employed bootstrapping methods to validate their findings against the null of no serial correlation, thus countering the argument of data mining.
Gencay (1998) employed non-linear models to analyze the forecasting power of technical rules and confirmed that short-term predictive signals exist, particularly in high-frequency data. However, these early works often omitted transaction costs, thus overestimating potential returns.
3. Momentum and Mean Reversion Strategies
Momentum strategies, as formalized by Jegadeesh and Titman (1993), have shown persistent profitability across time and geographies. Their approach—buying stocks that have outperformed in the past 3–12 months and shorting underperformers—challenges the EMH by exploiting behavioral biases and investor herding. Rouwenhorst (1998) confirmed that momentum exists even in emerging markets, suggesting a global phenomenon.
Conversely, mean reversion strategies, including RSI-based systems and Bollinger Bands, often exploit temporary price dislocations. Short-horizon contrarian strategies have been analyzed by Chan et al. (1996), but their profitability is inconsistent and highly sensitive to costs, timing, and liquidity.
4. Institutional Use of Technical Analysis
Contrary to the belief that TA is primarily a retail tool, it is also utilized—though selectively—by institutional investors:
Hedge Funds: Many quantitative hedge funds incorporate technical indicators within multi-factor models or machine learning algorithms. According to research by Neely et al. (2014), trend-following strategies remain a staple among CTAs (Commodity Trading Advisors), particularly in futures markets. These strategies often rely on moving averages, breakout signals, and momentum filters.
Market Makers: Although market makers are primarily driven by order flow and arbitrage opportunities, they may use TA to model liquidity zones and anticipate stop-hunting behavior. Order book analytics and technical levels (e.g., pivot points, Fibonacci retracements) can inform automated liquidity provision.
Pension Funds and Asset Managers: While these institutions rarely rely on TA alone, they may use it as part of tactical asset allocation. For instance, TA may serve as a signal overlay in timing equity exposure or in identifying risk-off regimes. According to a CFA Institute survey (2016), over 20% of institutional investors incorporate some form of technical analysis in their decision-making process.
5. Adaptive Markets and Conditional Validity
Lo (2004) introduced the Adaptive Markets Hypothesis (AMH), arguing that market efficiency is not a binary state but evolves with the learning behavior of market participants. In this framework, technical strategies may work intermittently, depending on the ecological dynamics of the market. Neely, Weller, and Ulrich (2009) found technical rules in the FX market to be periodically profitable, especially during central bank interventions or volatility spikes—conditions under which behavioral biases and structural inefficiencies tend to rise.
More recent studies (e.g., Moskowitz et al., 2012; Baltas & Kosowski, 2020) show that momentum and trend-following strategies continue to deliver long-term Sharpe ratios above 1 in diversified portfolios, particularly when combined with risk-adjusted scaling techniques.
6. The Role of Transaction Costs
Transaction costs represent a critical variable that substantially alters the net profitability of technical strategies. These include:
Explicit Costs: Commissions, fees, and spreads.
Implicit Costs: Market impact, slippage, and opportunity cost.
While early studies often neglected these elements, modern research integrates them through realistic backtesting frameworks. For example, De Prado (2018) emphasizes that naive backtesting without cost modeling and slippage assumptions leads to a high incidence of false positives.
Baltas and Kosowski (2020) show that even after accounting for bid-ask spreads and market impact models, trend-following strategies remain profitable, particularly in futures and FX markets where costs are lower. Conversely, high-frequency mean-reversion strategies often become unprofitable once these frictions are accounted for.
The impact of transaction costs also differs by asset class:
Equities: Higher costs due to wider spreads, especially in small caps.
Futures: Lower costs and higher leverage make them more suitable for technical strategies.
FX: Extremely low spreads, but high competition and adverse selection risks.
7. Meta-Analyses and Recent Surveys
Park and Irwin’s (2007) meta-analysis of 95 studies found that 56% reported significant profitability from technical analysis. However, profitability rates dropped when transaction costs were included. More recent work by Han, Yang, and Zhou (2021) extended this review with data up to 2020 and found that profitability was regime-dependent: TA performed better in volatile or trending environments and worse in stable, low-volatility markets.
Other contributions include behavioral explanations. Barberis and Thaler (2003) suggest that TA may capture collective investor behavior, such as overreaction and underreaction, thereby acting as a proxy for sentiment.
8. Limitations and Challenges
Several methodological issues plague empirical research in technical analysis:
Overfitting: Using too many parameters increases the likelihood of in-sample success but out-of-sample failure.
Survivorship Bias: Excluding delisted or bankrupt stocks leads to inflated backtest performance.
Look-Ahead Bias: Using information not available at the time of trade leads to unrealistic results.
Robust strategy development now mandates walk-forward testing, Monte Carlo simulations, and realistic assumptions on order execution. The growing field of machine learning in finance has heightened these risks, as complex models are more prone to fitting noise rather than signal (Bailey et al., 2014).
9. Conclusion
Technical analysis occupies a contested but persistent role in finance. The empirical evidence is mixed but suggests that technical strategies can be profitable under certain market conditions and when costs are minimized. Institutional investors have increasingly integrated TA within quantitative and hybrid frameworks, reflecting its conditional usefulness.
While TA does not provide a universal arbitrage opportunity, it can serve as a valuable tool when applied adaptively, with sound risk management and rigorous testing. Its success ultimately depends on context, execution discipline, and integration within a broader investment philosophy.
References
Bailey, D. H., Borwein, J. M., Lopez de Prado, M., & Zhu, Q. J. (2014). "The Probability of Backtest Overfitting." *Journal of Computational Finance*, 20(4), 39–69.
Baltas, N., & Kosowski, R. (2020). "Trend-Following, Risk-Parity and the Influence of Correlations." *Journal of Financial Economics*, 138(2), 349–368.
Barberis, N., & Thaler, R. (2003). "A Survey of Behavioral Finance." *Handbook of the Economics of Finance*, 1, 1053–1128.
Brock, W., Lakonishok, J., & LeBaron, B. (1992). "Simple Technical Trading Rules and the Stochastic Properties of Stock Returns." Journal of Finance, 47(5), 1731–1764.
Chan, L. K. C., Jegadeesh, N., & Lakonishok, J. (1996). "Momentum Strategies." Journal of Finance, 51(5), 1681–1713.
De Prado, M. L. (2018). Advances in Financial Machine Learning, Wiley.
Fama, E. F. (1970). "Efficient Capital Markets: A Review of Theory and Empirical Work." Journal of Finance, 25(2), 383–417.
Gencay, R. (1998). "The Predictability of Security Returns with Simple Technical Trading Rules." Journal of Empirical Finance, 5(4), 347–359.
Han, Y., Yang, K., & Zhou, G. (2021). "Technical Analysis in the Era of Big Data." *Review of Financial Studies*, 34(9), 4354–4397.
Jegadeesh, N., & Titman, S. (1993). "Returns to Buying Winners and Selling Losers: Implications for Stock Market Efficiency." *Journal of Finance*, 48(1), 65–91.
Lo, A. W. (2004). "The Adaptive Markets Hypothesis: Market Efficiency from an Evolutionary Perspective." *Journal of Portfolio Management*, 30(5), 15–29.
Moskowitz, T. J., Ooi, Y. H., & Pedersen, L. H. (2012). "Time Series Momentum." *Journal of Financial Economics*, 104(2), 228–250.
Neely, C. J., Weller, P. A., & Ulrich, J. M. (2009). "The Adaptive Markets Hypothesis: Evidence from the Foreign Exchange Market." *Journal of Financial and Quantitative Analysis*, 44(2), 467–488.
Neely, C. J., Rapach, D. E., Tu, J., & Zhou, G. (2014). "Forecasting the Equity Risk Premium: The Role of Technical Indicators." *Management Science*, 60(7), 1772–1791.
Park, C. H., & Irwin, S. H. (2007). "What Do We Know About the Profitability of Technical Analysis?" *Journal of Economic Surveys*, 21(4), 786–826.
Rouwenhorst, K. G. (1998). "International Momentum Strategies." *Journal of Finance*, 53(1), 267–284.
Zhu, Y., & Zhou, G. (2009). "Technical Analysis: An Asset Allocation Perspective on the Use of Moving Averages." *Journal of Financial Economics*, 92(3), 519–544.
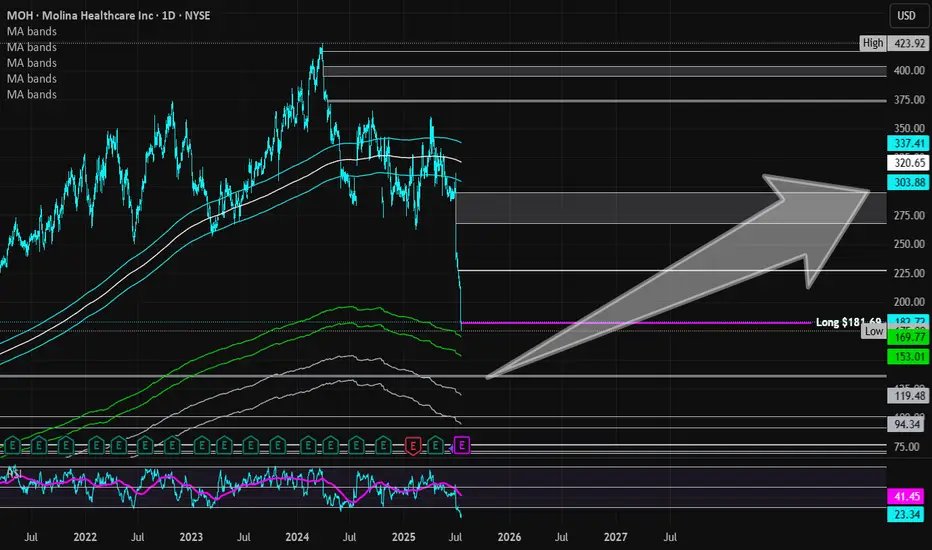
Molina Healthcare | MOH | Long at $181.69Healthcare providers and services are at a major discount right now: and may be discounted even more this year. I am personally buying and long-term holding the fear, knowing the baby boom generation is going to utilize our healthcare system at a rate unseen in modern times. While the price discounts are valid "right now" given the current political administration's cuts, long-term it is far from valid... The strategy I am using with healthcare stocks ( NYSE:MOH , NYSE:CNC , NYSE:UNH , NYSE:ELV , etc) is cost averaging: not buying one single large position in an effort to predict bottom but buying smaller positions over time to create a cost average "near" bottom. If you are a day trader or want a quick swing in healthcare, I don't think it's going to happen for a bit. But those not entering in the coming months / year will likely miss out on a very large healthcare boom - especially when AI truly enters the picture in this sector...
Fundamentally, Molina Healthcare NYSE:MOH is a very strong company. Low debt-to-equity (.9x), P/E of 8.8x, quick ratio of 1.7x, $41 billion in revenue in 2024. Yes, there will be issues in the near-term due to Medicaid and other funding cuts. But long-term, this sector is primed to benefit from an aging population.
So, while NYSE:MOH is in a personal buy zone at $181.69, I don't think this is necessarily bottom. I anticipate this stock to drop even further, eventually closing the daily price gap at $135.00. My next buys are in the $150's and $130's, thus cost averaging into a larger position. For true value investors, those prices and anything below is a steal. Today's negative healthcare sector noise is loud, but it does not represent the future.
Targets into 2028:
$226.00 (+24.3%)
$290.00 (+59.6%)
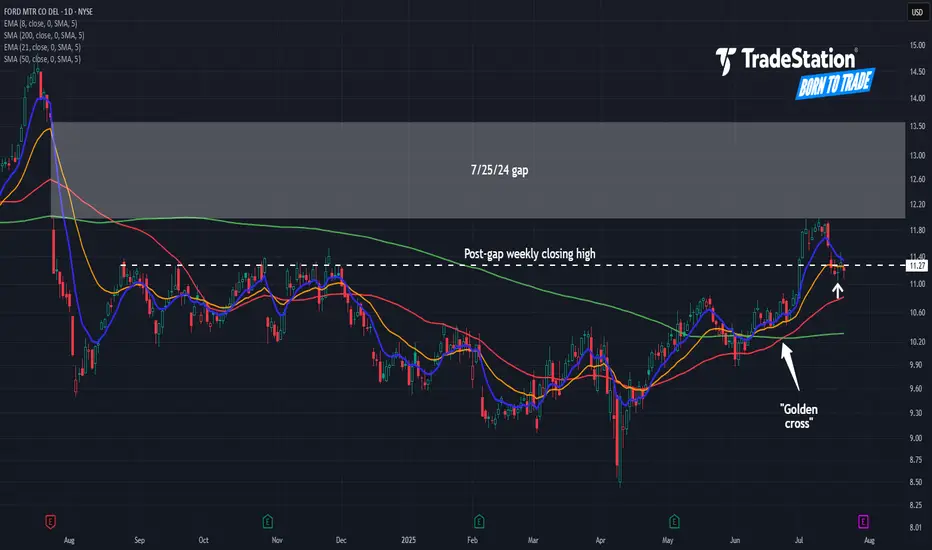
Ford Motor Pulls BackFord Motor began the month with a rally, and now it’s pulled back.
The first pattern on today’s chart is the July 1 surge following a strong monthly sales report. That may reflect healthy fundamentals.
Second is $11.27, a weekly close from last August. The automaker is back around that level, which could mean old resistance is becoming new support.
Third, the 50-day simple moving average (SMA) had a “golden cross” above the 200-day SMA in late June. That may suggest F’s long-term trend has gotten more bullish.
Next, the stock recently neared a bearish gap from July 2024. Could prices fill that gap?
Finally, F is an active underlier in the options market. (It averaged about 90,000 contracts per session in the last month, according to TradeStation data.) That could help investors take positions with calls and puts.
TradeStation has, for decades, advanced the trading industry, providing access to stocks, options and futures. If you're born to trade, we could be for you. See our Overview for more.
Past performance, whether actual or indicated by historical tests of strategies, is no guarantee of future performance or success. There is a possibility that you may sustain a loss equal to or greater than your entire investment regardless of which asset class you trade (equities, options or futures); therefore, you should not invest or risk money that you cannot afford to lose. Online trading is not suitable for all investors. View the document titled Characteristics and Risks of Standardized Options at www.TradeStation.com . Before trading any asset class, customers must read the relevant risk disclosure statements on www.TradeStation.com . System access and trade placement and execution may be delayed or fail due to market volatility and volume, quote delays, system and software errors, Internet traffic, outages and other factors.
Securities and futures trading is offered to self-directed customers by TradeStation Securities, Inc., a broker-dealer registered with the Securities and Exchange Commission and a futures commission merchant licensed with the Commodity Futures Trading Commission). TradeStation Securities is a member of the Financial Industry Regulatory Authority, the National Futures Association, and a number of exchanges.
Options trading is not suitable for all investors. Your TradeStation Securities’ account application to trade options will be considered and approved or disapproved based on all relevant factors, including your trading experience. See www.TradeStation.com . Visit www.TradeStation.com for full details on the costs and fees associated with options.
Margin trading involves risks, and it is important that you fully understand those risks before trading on margin. The Margin Disclosure Statement outlines many of those risks, including that you can lose more funds than you deposit in your margin account; your brokerage firm can force the sale of securities in your account; your brokerage firm can sell your securities without contacting you; and you are not entitled to an extension of time on a margin call. Review the Margin Disclosure Statement at www.TradeStation.com .
TradeStation Securities, Inc. and TradeStation Technologies, Inc. are each wholly owned subsidiaries of TradeStation Group, Inc., both operating, and providing products and services, under the TradeStation brand and trademark. When applying for, or purchasing, accounts, subscriptions, products and services, it is important that you know which company you will be dealing with. Visit www.TradeStation.com for further important information explaining what this means.

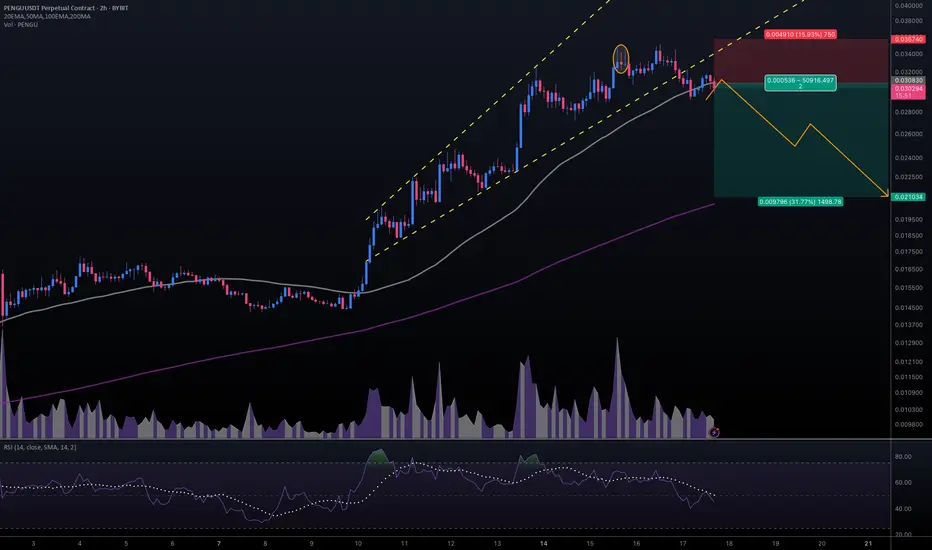
#PENGUUSDT #2h (ByBit) Broadening wedge breakdownPudgy Penguins printed an evening star then lost 50MA, seems to be heading towards 200MA support next.
⚡️⚡️ #PENGU/USDT ⚡️⚡️
Exchanges: ByBit USDT
Signal Type: Regular (Short)
Leverage: Isolated (2.5X)
Amount: 5.0%
Entry Targets:
1) 0.030830
Take-Profit Targets:
1) 0.021034
Stop Targets:
1) 0.035740
Published By: @Zblaba
CSECY:PENGU BYBIT:PENGUUSDT.P #4h #PludgyPenguins #Meme pudgypenguins.com
Risk/Reward= 1:2.0
Expected Profit= +79.4%
Possible Loss= -39.8%
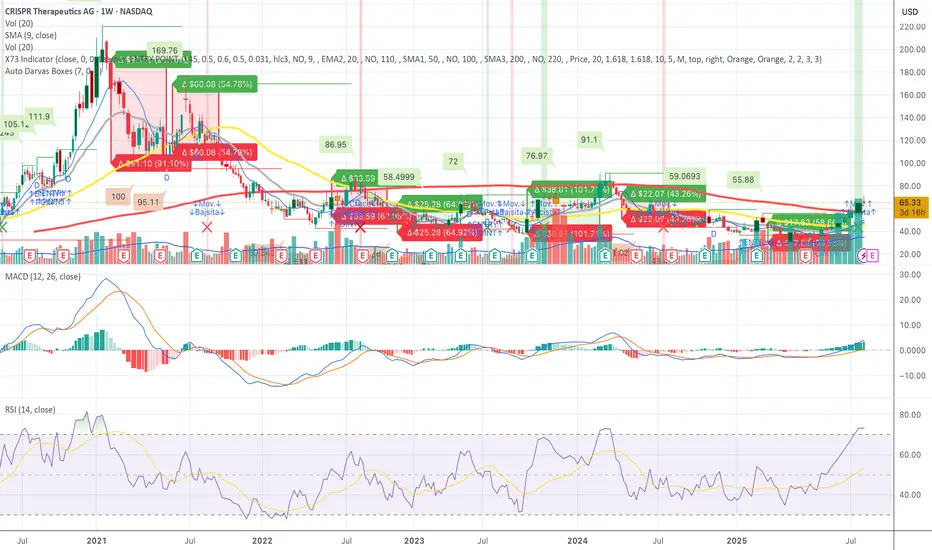
CRSP – Confirmed Breakout - Squeeze Pressure Mounting - Let's GoCRSP – Full Breakdown of the Short Squeeze Setup, Technicals, and Fundamentals
CRISPR Therapeutics (NASDAQ: NASDAQ:CRSP ) is currently setting up one of the most compelling short squeeze and momentum continuation trades in the biotech sector. After hours on July 22, 2025, the stock is trading at 67.00, pushing through a critical resistance zone with increasing volume and strong technical confirmation.
Short interest is estimated at approximately 25.5 million shares, representing between 28 and 31 percent of the float. Days to cover is between 5.8 and 9.7, which is considered high. This creates a risk zone for short sellers, especially as the stock moves higher. With the price moving above 65, many in-the-money call options are being triggered, increasing the likelihood of a gamma squeeze. This occurs when market makers must hedge their exposure by buying more shares, driving the price up further.
Open interest on call options has been building over the past month, particularly at the 65, 70, and 75 strike prices for the August 1 and August 16 expirations. October calls also show heavy volume. The August 16 70 call recently had over 1700 open contracts with more than 4400 contracts traded in a single session, indicating aggressive positioning.
On the weekly chart, price has now broken above 66.50, a major resistance zone. RSI is above 73, signaling strong momentum. The MACD has crossed bullish with rising histogram bars. The 50-week simple moving average sits around 72 to 73, marking the next area of resistance. Price is now trading above the 10, 20, and 50-week moving averages and has broken out from the previous Darvas Box range centered around 60.88.
CRSP is expected to report earnings around August 7 to August 12, 2025. In the previous quarter, the company reported a loss of 1.58 per share, missing expectations. Current estimates for Q2 range from negative 1.78 to negative 0.93, with a consensus near negative 1.40. Investors will be watching closely for updates on CRISPR’s gene therapy pipeline, especially the CTX001 program and oncology candidates. A positive earnings surprise or encouraging pipeline update could further drive upward price movement.
CRISPR Therapeutics focuses on developing gene-editing therapies based on CRISPR-Cas9. Key programs include CTX001 for sickle cell disease and beta thalassemia, CAR-T therapies for cancer, and regenerative medicine applications. The company has a strong cash position and continues to invest heavily in research and development.
Key support levels include 60.88 and 58.50. Immediate resistance is now 67.00, with the next target range between 72.50 and 76.00. If the short squeeze intensifies, a stretch target of 86.00 to 91.00 is possible. The all-time high for the stock is 169.76, reached in early 2021.
This setup includes a confirmed technical breakout, high short interest, heavy call option flow, and an upcoming earnings catalyst. The stock is now in play, and if it holds above 67.00, further upside pressure could continue into the August earnings release. This is a live squeeze and continuation setup with both technical and fundamental tailwinds.
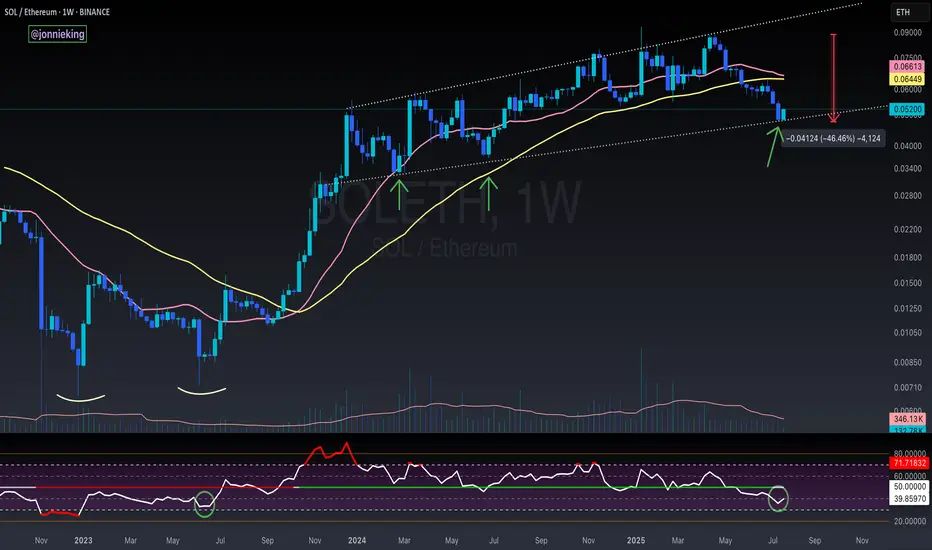
SOL / ETH - Reversal Signs FormingI suspect CRYPTOCAP:ETH has a bit more gas in the tank, but the early signs for the real Alt Season are nearing.
RSI on the weekly is nearing the June 2023 bottom which kicked off the massive bull flag formed on SOL / ETH for the next 2 years.
Still too early to call at this point tho.
Need volume to really burst through in the next week or two.
I’d also like to see BOATS:SOL close the week with a massive bullish engulfing candle.
The bearish cross on the 20 / 50WMA should mark the bottom when it occurs soon.
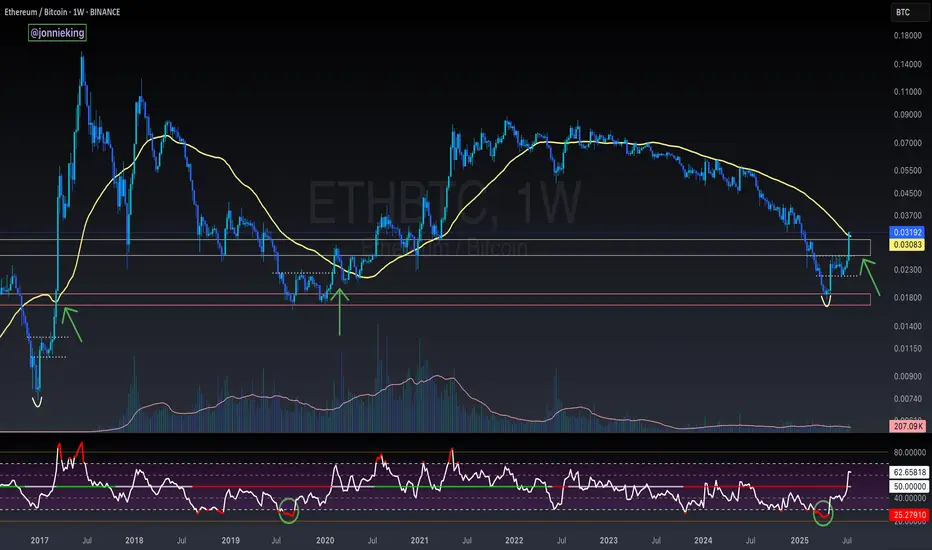
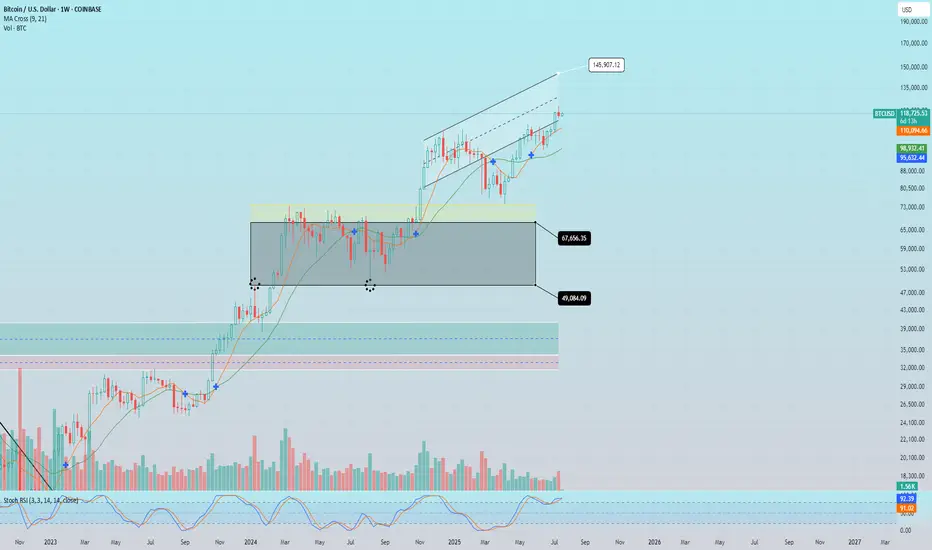
XRP Eyes Explosive Growth: A Path to $10 and a 2025 "Euphoria PhThe cryptocurrency market is charged with renewed optimism, and much of the focus is now turning to established digital assets like XRP. After a prolonged period of consolidation, a powerful combination of bullish technical indicators, evolving market dynamics, and a compelling value proposition is fueling forecasts of a significant price surge. Market analysis now points to a potential future where XRP could trade in the $6 to $10 range, a move that hinges on Bitcoin achieving a landmark price of $144,000.
Adding to this momentum, detailed chart analysis suggests that XRP may be on the cusp of entering a "euphoria phase" between August and October of 2025, a window that could see unprecedented growth. As market leaders Bitcoin and Ethereum become increasingly expensive for the average investor, a strong argument is emerging that XRP currently offers a superior entry point, blending high potential with accessibility. This convergence of factors is positioning XRP as a token to watch, with many believing its next major bull run is not a matter of if, but when.
The Bitcoin Catalyst: Charting XRP's Trajectory to $10
A significant component of XRP's bullish outlook is directly tied to the performance of Bitcoin. The relationship between the two assets, often measured by the XRP/BTC trading pair, is showing signs of a historic shift. Technical analysis of the XRP/BTC monthly chart reveals that its price is coiling tightly just below a critical resistance level. A definitive monthly close above this threshold would represent a major technical breakout, signaling a powerful reversal of its long-term trend against Bitcoin. Such a move would be the first of its kind since 2018 and could unleash substantial upward momentum.
Should this breakout on the XRP/BTC chart materialize, technical projections indicate an initial move toward a higher valuation, with a primary target zone identified. If this rally in the trading pair coincides with Bitcoin’s price climbing to the projected $144,000 level, the math translates to a U.S. dollar valuation for XRP of between $6 and $10. The timing for such a move is projected for late 2025, assuming Bitcoin’s own bull run accelerates as anticipated.
The XRP/USD chart independently supports this constructive outlook. A recent weekly close above a key price level has flipped several long-term indicators to a bullish stance, generating a classic breakout signal. Using standard technical projection models, such as Fibonacci extensions, price objectives for XRP now stand at approximately $4.53, $6.31, and even as high as $9.22. The journey to these targets, however, remains heavily dependent on the broader market strength led by Bitcoin. A stall in Bitcoin's advance would likely moderate the upside potential for XRP.
The "Euphoria Phase": Why Late 2025 Could Be Explosive
Beyond its relationship with Bitcoin, XRP's own price chart is signaling immense latent potential. After trading within a defined range for years, the token is now exhibiting powerful bullish signals on its weekly chart, suggesting a breakout from a multi-year consolidation pattern is underway.
Several key technical indicators are aligning to confirm the start of a new, sustained uptrend. A clear bullish crossover on the weekly Moving Average Convergence Divergence (MACD) indicator—a trusted measure of market momentum—has already occurred. At the same time, the Relative Strength Index (RSI) is climbing steadily but has yet to enter the overbought territory that has historically marked the peak of major cycles. This indicates that there is still significant room for price appreciation before the rally becomes exhausted.
A critical psychological and technical price level now stands at $5. A firm weekly close above this mark would be a monumental event, likely triggering a wave of intense buying pressure and shifting market sentiment from simple optimism into full-blown euphoria. If this breakout is confirmed, the next macro price targets are projected to be in the $8 to $11 range, levels consistent with the price action seen in XRP's previous parabolic advances. Based on historical cycle patterns and the current technical structure, this explosive phase could unfold between August and October of 2025.
The Value Proposition: Why XRP Stands Out in a High-Priced Market
As Bitcoin and Ethereum command prices that put them out of reach for many new participants, a psychological barrier to entry has formed. It is in this environment that XRP’s unique market position becomes a powerful advantage. The investment case for XRP is straightforward and highly attractive to first-time crypto buyers who may be experiencing "sticker shock" from the market leaders.
With its high market capitalization and global recognition, combined with a low per-unit price, XRP presents an appealing proposition. This dynamic, often referred to as "unit bias," makes investors feel they are getting better value by being able to purchase a larger quantity of tokens. This behavioral pattern has historically driven significant retail inflows into assets perceived as more affordable.
This appeal is not merely psychological. XRP is underpinned by a clear and functional use case: facilitating fast, low-cost cross-border payments. The XRP Ledger’s ability to settle international transactions in seconds for a fraction of a penny provides a fundamental strength that distinguishes it from purely speculative assets. This utility, aimed at disrupting the enormous traditional finance market, offers a layer of long-term credibility. The broad distribution of XRP across millions of digital wallets highlights its widespread accessibility and deep retail base, a demographic that could be instrumental in fueling its next major run.
A Prudent Perspective
Despite the compelling bullish case, it is essential to approach these forecasts with a clear understanding of the risks involved. The cryptocurrency market is defined by its volatility, and price targets are speculative projections, not guarantees. XRP's path is still influenced by external factors, most notably the ongoing regulatory landscape, which could have a significant impact on its future.
Furthermore, the most optimistic scenarios for XRP are heavily reliant on Bitcoin maintaining its powerful upward trajectory. Any weakness in the flagship cryptocurrency would undoubtedly impact the entire altcoin market, including XRP. While the technical and fundamental outlook appears increasingly bright, a disciplined and well-researched approach remains the cornerstone of navigating this exciting but unpredictable market.

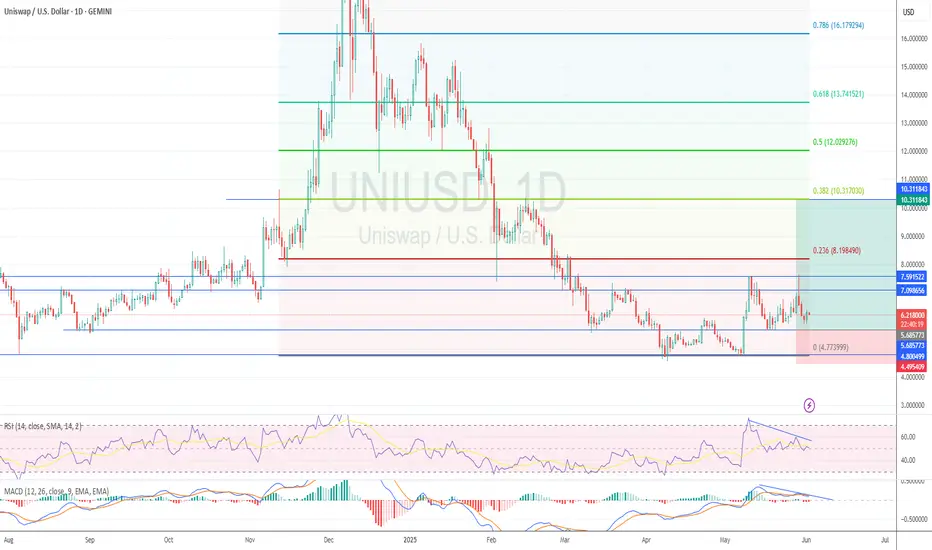
$UNI - $10 from here?Hi guys! 👋🏻
🔔I'll be trying this setup for Uniswap
🔔 We have bounced from the strong support at $4.80, which we retested in April 25 and May 7 forming a pattern impersonating a double bottom
🔔 With the current chart pattern and levels, I'll be expecting a jump with a target on $10.
🔔 Might drop to $5.70 before another move upwards.
✊🏻 Good luck with your trades! ✊🏻
If you like the idea hit the 👍🏻 button, follow me for more ideas.
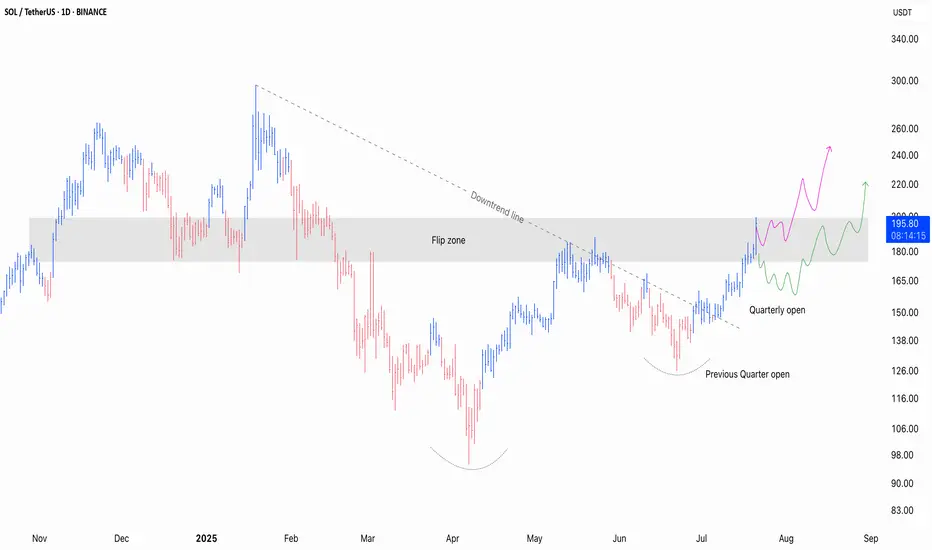
SOL / USDT - Current ThoughtsSolana’s been stealing the spotlight again and not just for the memes this time!
After months of getting smacked down at key levels, it’s finally reclaiming the lost ground with conviction. Price is grinding its way through zones that had been solid resistance for ages, flipping sentiment along the way.
The combination of structure, volume, and market psychology paints a clear story here. Let's break it down piece by piece in simple terms.
———x———x———x———
Table of Contents
⦿ Volume Profile
⦿ Key Technical Levels & Insights
⦿ Market Structure
———x———x———x———
⦿ Volume Profile
The Volume Profile offers crucial insight into where meaningful participation has taken place throughout this range and how these levels continue to influence the current structure.
Point of Control (POC) – ~145 USDT
This is the level where the highest volume changed hands during the entire consolidation. In simple terms, this is where buyers and sellers were most active in establishing positions.
The POC is like a price magnet where the market finds equilibrium when direction becomes uncertain. If bulls lose momentum, the price may gravitate back towards it.
Value Area Low – ~123.50 USDT
Below this threshold, prior market interest thinned out significantly. A breakdown here would likely accelerate downside as it signals acceptance below value, typically inviting stronger bearish flows and forcing trapped longs to capitulate.
Value Area High – ~213 USDT
This area marks a logical short-term upside target if the current rally can sustain its footing. VAH is where the prior range began to thin out and sellers historically pushed back. If buyers want to reclaim control, this is a key level to watch.
Currently, the price has cleanly reclaimed the POC and is now pressing into what I’d define as the Flip Zone (an area where former resistance is getting retested as potential support). Acceptance above the VAH will lead a rally towards the ATH.
⦿ Key Technical Levels & Insights
Several key factors are aligning here to create a compelling case and it’s about the broader narrative these levels are constructing together.
Quarterly Open – ~150 USDT
The recent breakout and push above the QO shows a clear intent buyers' intent. It’s a important reference point for ongoing structure.
Yearly Open – ~188 USDT
Reclaiming the Yearly Open is rarely a trivial event. Currently, the price is flirting with the YO. If the price manages to reclaim it with a strong push, it'll shift the broader sentiment back in favour of the bulls.
Flip Zone – 175–190 USDT
This zone has historically been a battleground, serving as both support and resistance since March 2024. A clean breakout above this zone won't just clear resistance, it'll open the door for further upside as sidelined participants as well as trapped shorts will be forced to react.
Downtrend Line – Broken
The trend line that was established earlier this year has been breached now, adding another positive factor for the bulls.
200 EMA / 200 SMA – ~163 USDT
Both KMAs are converging here, adding weight to this level as a reference for long-term trend direction. Price reclaiming and holding above these MAs often signals a meaningful shift in market sentiment.
The confluence of reclaiming major opens, breaking downtrend resistance, and positioning above critical moving averages strengthens the bullish case.
⦿ Market Structure
The current structure shows a market transitioning from bearish exhaustion, through a phase of accumulation, and now stepping confidently into breakout territory.
Double Bottom Formation (April lows ~95 USDT to recent highs):
This is a textbook accumulation. It’s not a fast V-shape reversal but a slow build. These kinds of structures often lay the groundwork for sustained trends.
Higher Lows in Place: 95 → 126 → 150 → 190 USDT
Each successive low is higher than the last, showing consistent buyer strength and deliberate positioning by participants with a longer-term view.
Breakout Above Prior Range Highs (187–190 USDT):
This area acted as clear resistance in previous attempts, capping price for months. Once this range is reclaimed with force, expect higher prices for multiple weeks/months.
TLDR
✅ Current Bias: Bullish while above 175–190 USDT.
✅ Structure: Breakout of multi-month downtrend, reclaiming key levels.
✅ Volume: Strong above POC, targeting Value Area High next.
✅ Invalidation: Failure below 150 USDT flips bias back to bearish.
I’m only focused on bullish continuation or healthy pullback scenarios for now, as I plan to keep holding my existing spot positions.
If you found this breakdown helpful, drop a like and let me know your thoughts in the comments. Always keen to hear how others are seeing the market. 👇
⚠️ Disclaimer
As always, this post is purely for educational purposes. I am not a financial advisor, and nothing here should be taken as financial advice. Always consult your financial advisor before making any investment or trading decisions. Or at the very least, consult your cat. 🐱
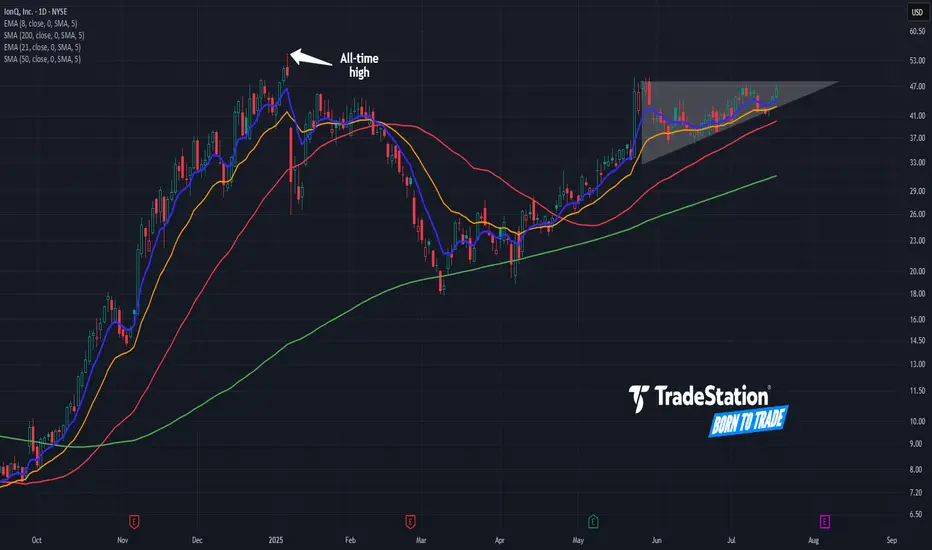
IonQ: Potential Continuation Pattern IonQ had a big surge in late 2024, and now some traders may see potential for continuation to the upside.
The first pattern on today’s chart is May 27's closing price of $48.04. IONQ has made a series of higher lows while remaining below that level, which may be viewed as a bullish ascending triangle.
Second, prices are near the all-time high of $54.74 in January. Could the stock be coiling for a move into new territory?
Third, IONQ is above its rising 50- and 200-day simple moving averages. That may be consistent with a longer-term uptrend.
Fourth, the 8-day exponential moving average (EMA) is above the 21-day EMA. That may be consistent with a short-term uptrend.
Next, IONQ is a fast-growing player in the emerging field of quantum computing. Given the overall focus on technology and increased competition with China, some investors may view the stock as a means to participate in the trend.
Finally, IONQ is an active underlier in the options market. (It’s averaged about 100,000 contracts per session over the last month, according to TradeStation data.) That may help traders take positions with calls and puts.
TradeStation has, for decades, advanced the trading industry, providing access to stocks, options and futures. If you're born to trade, we could be for you. See our Overview for more.
Past performance, whether actual or indicated by historical tests of strategies, is no guarantee of future performance or success. There is a possibility that you may sustain a loss equal to or greater than your entire investment regardless of which asset class you trade (equities, options or futures); therefore, you should not invest or risk money that you cannot afford to lose. Online trading is not suitable for all investors. View the document titled Characteristics and Risks of Standardized Options at www.TradeStation.com . Before trading any asset class, customers must read the relevant risk disclosure statements on www.TradeStation.com . System access and trade placement and execution may be delayed or fail due to market volatility and volume, quote delays, system and software errors, Internet traffic, outages and other factors.
Securities and futures trading is offered to self-directed customers by TradeStation Securities, Inc., a broker-dealer registered with the Securities and Exchange Commission and a futures commission merchant licensed with the Commodity Futures Trading Commission). TradeStation Securities is a member of the Financial Industry Regulatory Authority, the National Futures Association, and a number of exchanges.
Options trading is not suitable for all investors. Your TradeStation Securities’ account application to trade options will be considered and approved or disapproved based on all relevant factors, including your trading experience. See www.TradeStation.com . Visit www.TradeStation.com for full details on the costs and fees associated with options.
Margin trading involves risks, and it is important that you fully understand those risks before trading on margin. The Margin Disclosure Statement outlines many of those risks, including that you can lose more funds than you deposit in your margin account; your brokerage firm can force the sale of securities in your account; your brokerage firm can sell your securities without contacting you; and you are not entitled to an extension of time on a margin call. Review the Margin Disclosure Statement at www.TradeStation.com .
TradeStation Securities, Inc. and TradeStation Technologies, Inc. are each wholly owned subsidiaries of TradeStation Group, Inc., both operating, and providing products and services, under the TradeStation brand and trademark. When applying for, or purchasing, accounts, subscriptions, products and services, it is important that you know which company you will be dealing with. Visit www.TradeStation.com for further important information explaining what this means.
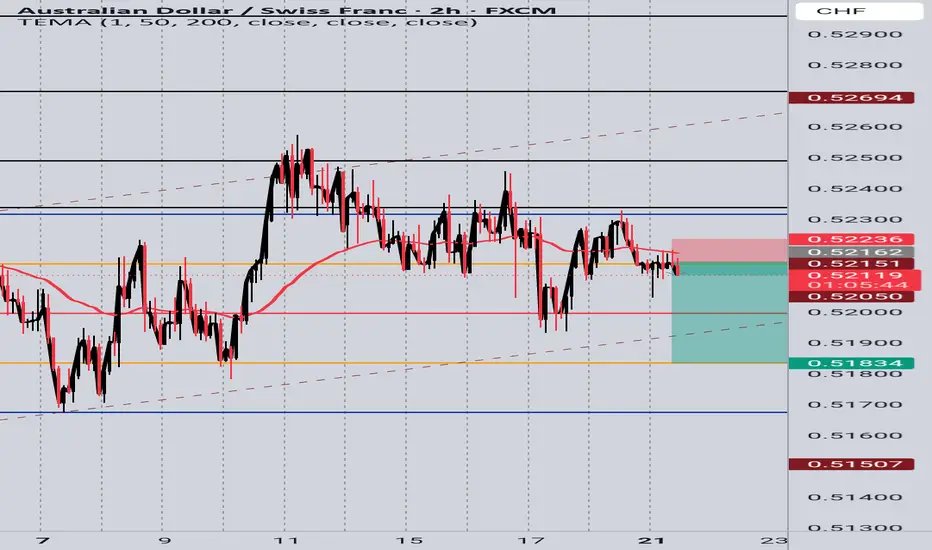
AUD/CHF 2H – Price Action Short Setup🔎 Why This Setup Makes Sense:
1.Trend Bias
Downtrend confirmed — price is below both structure and moving averages.
2.Resistance Rejection:
Price failed to break back above resistance near 0.5223 and left small bearish candles — showing seller strength.
3.Entry Idea:
Short entry just below the resistance zone with a tight stop above recent minor swing high (~0.5223).
4.Target Zone:
Your take profit is near 0.5183, where price previously bounced — a natural support and reaction zone.
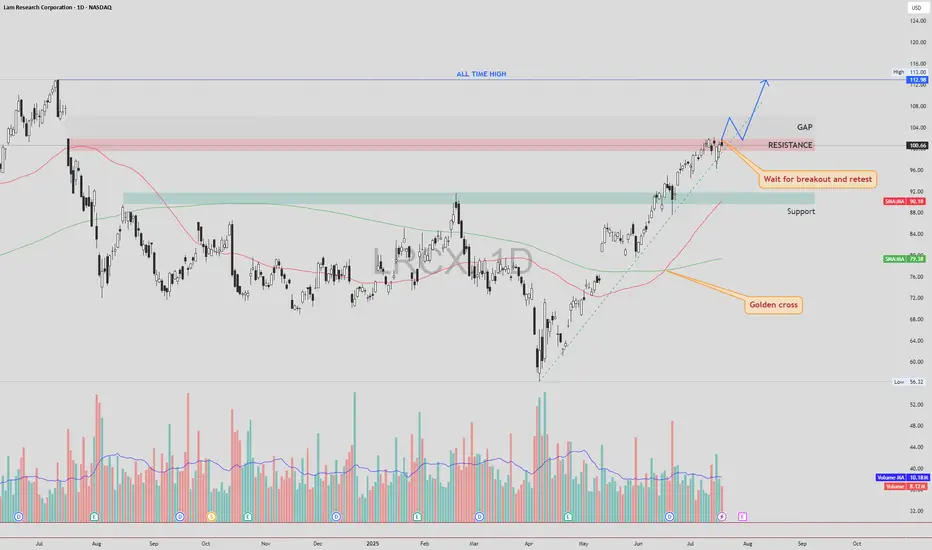
LRCX – Gap Fill First, Then Retest and Potential Move to ATHLRCX NASDAQ:LRCX is currently trading just below a key resistance zone, supported by strong bullish momentum and a confirmed Golden Cross formation.
🔍 Technical Scenario
There is a high probability that price may fill the gap above without retesting the current resistance. After the gap is filled, we could see a pullback to retest the previously untouched resistance zone (now acting as support).
If this retest is successful and holds, the structure may support a continuation move toward the All-Time High (ATH) zone.
📌 Trade Plan
Entry: Avoid chasing the breakout candle. Wait for a gap fill, followed by a clean retest of the broken resistance zone. Enter on confirmation of support holding.
Stop Loss: Place SL just below the retest zone or under the most recent higher low (structure-based stop).
Target 1: Gap fill completion
Target 2 : All-Time High (ATH), if retest confirms
⚠️ Risk Management
The gap-fill rally without retest can be volatile. Patience is key — let the price come back and confirm the breakout zone as new support.
As always, DYOR and manage your position sizing based on your risk profile.
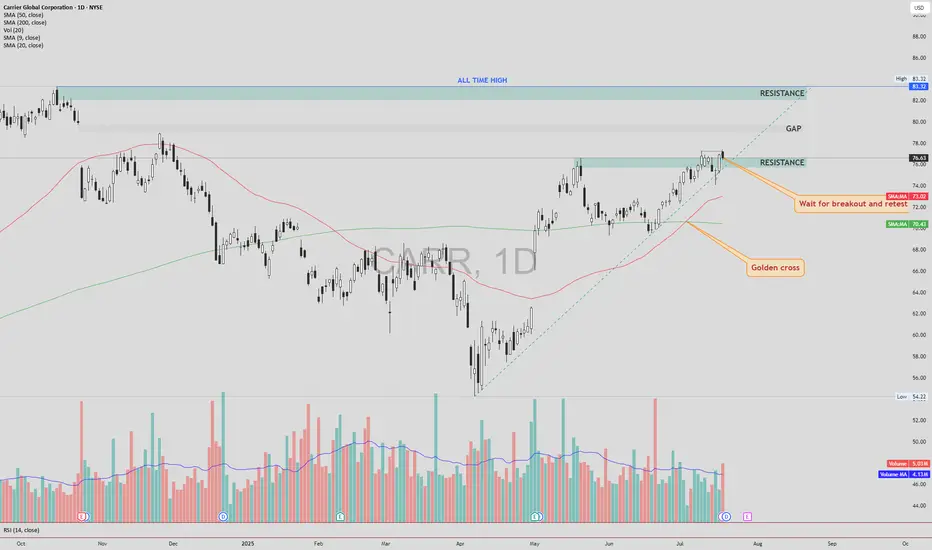
CARR – Bullish Breakout Toward Gap and ATHCarrier Global NYSE:CARR has closed above a key resistance zone near $76.50–$77.00 , indicating a possible breakout setup in progress. This move comes after a Golden Cross , where the 50 SMA crossed above the 200 SMA — a long-term bullish signal.
🔍 Technical Highlights:
✅ Golden Cross: Bullish momentum building.
✅ Breakout level: Price broke above horizontal resistance zone.
🔄 Next step: Wait for a potential retest of the breakout zone.
🔊 High volume on the breakout and retest would increase the strength and reliability of the setup.
🎯 Target Levels:
First Target (TP1): ~$80.00 — near the top of the existing gap.
Second Target (TP2): ~$83.32 — the current All-Time High (ATH).
🛡 Trade Plan:
Entry idea: After a clean retest of the breakout level with supportive volume.
Stop-loss: Below the retest zone or under 50 SMA (~$72-74 area).
Invalidation: If price falls back below resistance on high volume.
Conclusion:
CARR shows a strong breakout setup after a Golden Cross. A confirmed retest with volume could open the door toward the gap fill and new all-time highs.
DYOR – This is not financial advice.
$ETH Closes Above the 50WMA - Alt Season Signal ALT SEASON ALERT 🚨
CRYPTOCAP:ETH Closed the Week ABOVE the 50WMA
Historically this has signaled the start of ALT SEASON.
*NOTE* 2020 had the pandemic hiccup.
This bottoming pattern looks very similar to the 2017 explosion.
Also the RSI matches the 2019 bottom.
Dare I call it yet bros? 🤓