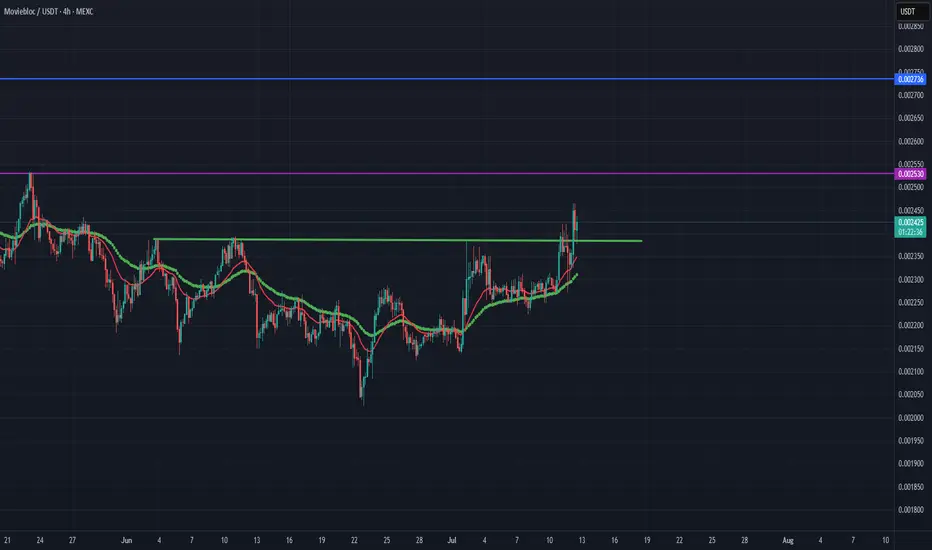
MBLUSDT //As long as we stay on the green line, the direction is up. The first target is 0.002530, which is Fibo 1.414, the main target is 0.002736. Cut losses when closing below the green line.
Moving Averages
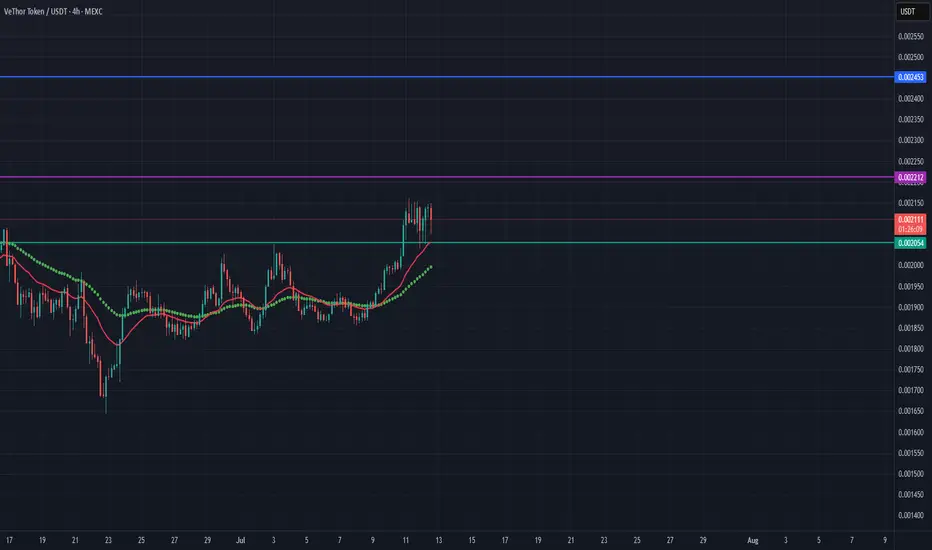
VTHOUSDT // As long as we stay on the green line, the direction is up. The first target is Fibo 1.414, which is 0.002212, the main target is 0.002453. Cut losses when closing below the green line.
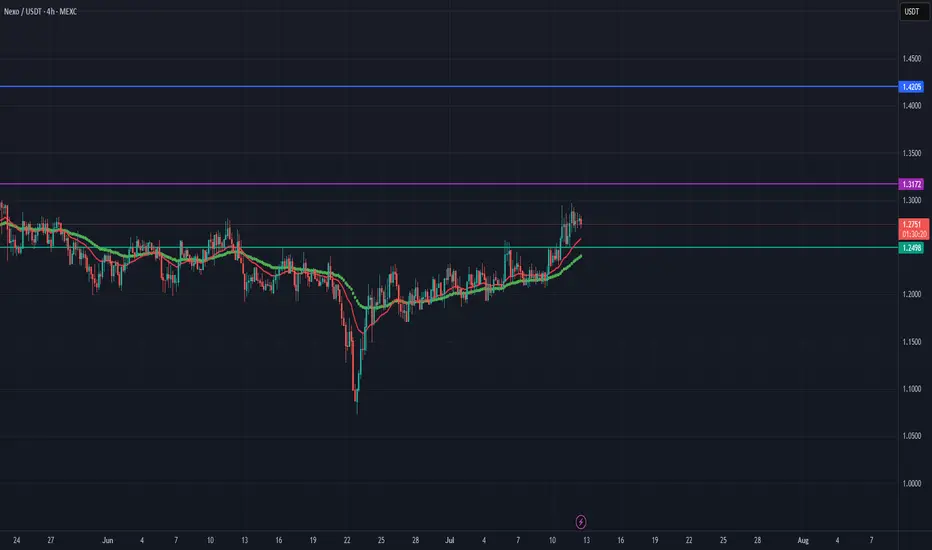
NEXOUSDT // As long as we stay on the green line, the direction is up. The first target is 1.3172, which is Fibo 1.414, the main target is 1.4205. Cut losses when closing below the green line.
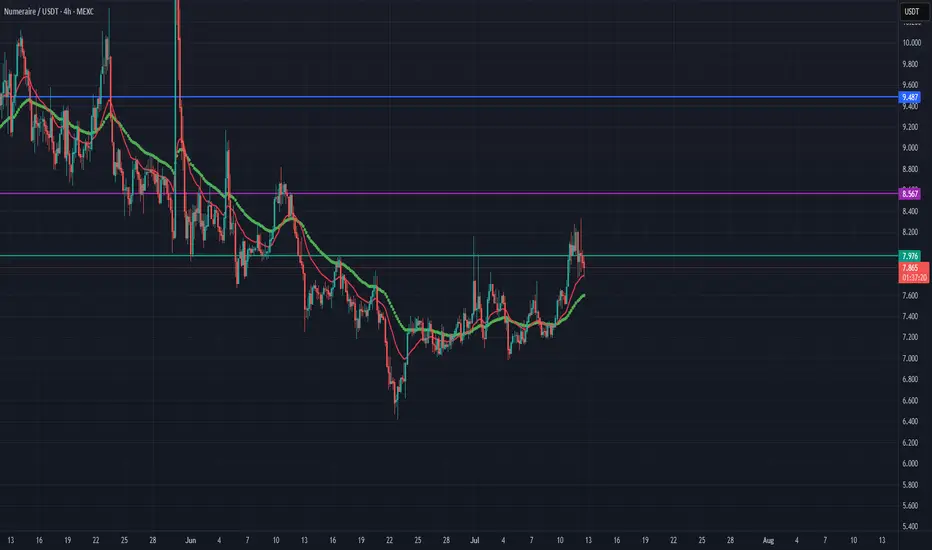
NMRUSDT // If we see closings above the green line, the first target is Fibo 1.414, which is 8.567, the main target is 9.487. Cut losses in closings below the green line.
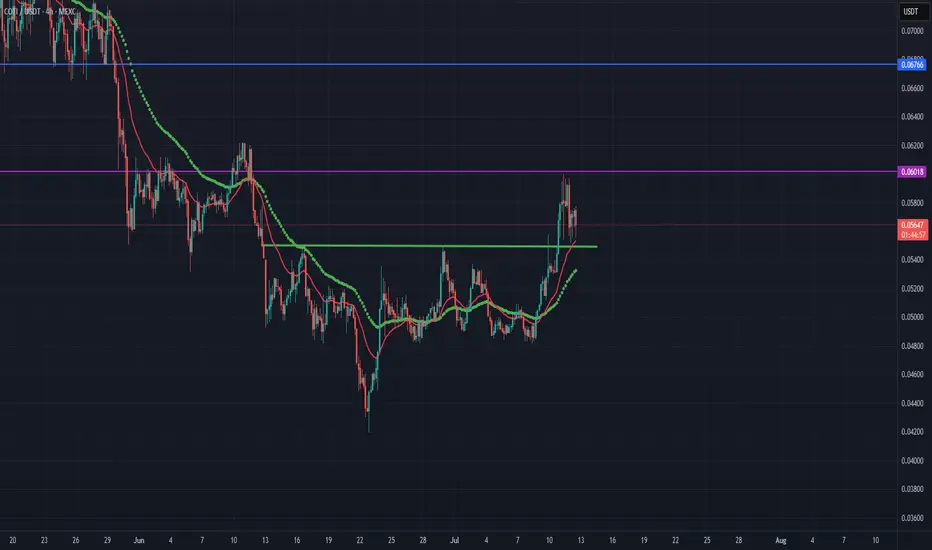
COTIUSDT // During the time we stay on the green line, the direction is up. The first target is Fibo 1.414, which is 0.06018, the main target is 0.06766. Cut losses below the green line.
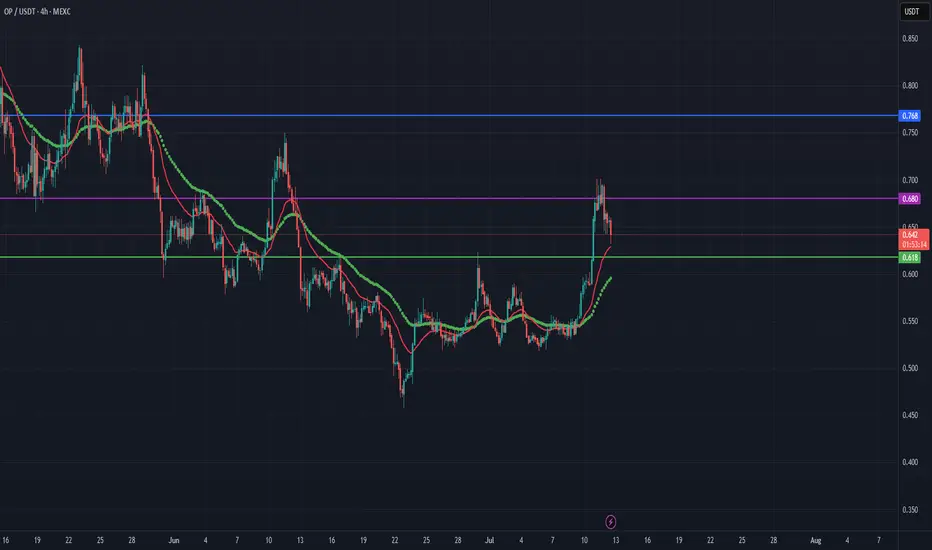
OPUSDT // During the time we stay on the green line, the direction is up. The first target is Fibo 1.414, which is 0.680, the main target is 0.768. Cut losses below the green line.
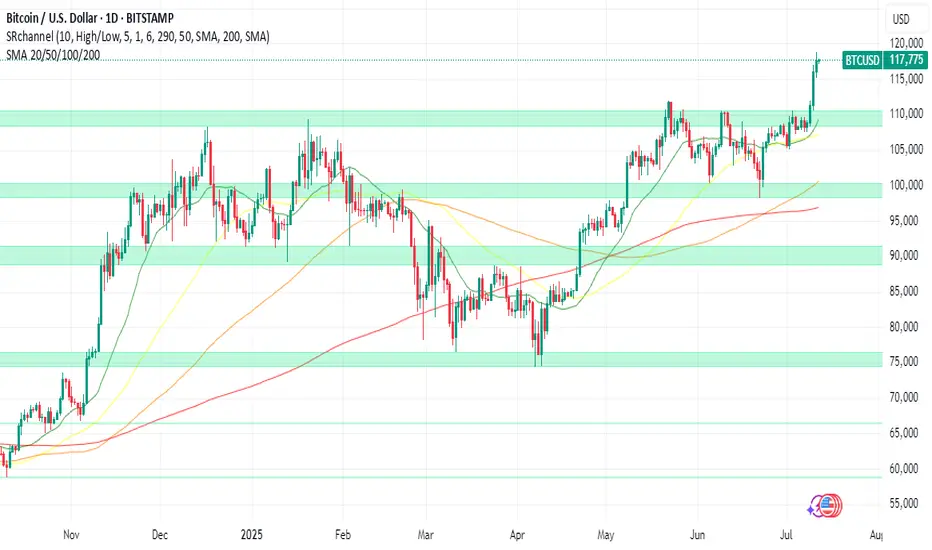
Prepare for the 2025 Crypto Summer as Bitcoin Shatters RecordBitcoin Experiences Impact of a $12B Short Squeeze: Here is How to Prepare for Imminent Crypto Summer
July 12, 2025 - The digital asset landscape has been irrevocably altered. In a move that will be etched into financial history, Bitcoin has shattered its previous all-time highs, surging with a ferocity that has left bears in utter ruin and bulls in a state of euphoric disbelief. After decisively breaking the formidable $109,000 barrier, the world’s premier cryptocurrency rocketed past $118,000, liquidating an estimated $12 billion in leveraged short positions in a cascade of forced buy-ins that added jet fuel to an already roaring fire.
This is not just another bull run. This is the manifestation of a market that has fundamentally matured. The "Crypto Summer" of 2025, long whispered about in investor circles, has arrived, and it is being majorly fueled by an unprecedented influx of institutional capital and a newly established clear regulatory outlook. While the price charts paint a picture of blistering gains, the underlying story is one of a structural shift in the global financial order.
For those who have watched from the sidelines, the question is no longer if they should pay attention, but how they can possibly prepare for the seismic shifts to come. This article will dissect the anatomy of this historic market event, explore the powerful forces driving this new paradigm, and offer a guide to navigating the thrilling, albeit treacherous, terrain of the 2025 Crypto Summer.
Part 1: The Anatomy of a $12 Billion Cataclysm
To comprehend the sheer violence of Bitcoin's recent ascent, one must first understand the market dynamics that preceded it. A short squeeze is a market phenomenon that occurs when a heavily shorted asset experiences a rapid price increase. This forces traders who bet on a price drop (short sellers) to buy back the asset to cover their positions and cut their losses. This sudden surge in buying demand creates a feedback loop, pushing the price even higher and liquidating more short positions along the way.
In the weeks leading up to the breakout, a palpable sense of bearishness had settled among many derivative traders. They saw the price range between $100,000 and $110,000 as a formidable distribution zone—a ceiling where bulls would run out of steam. Emboldened by this conviction, they began to build massive short positions. It's estimated that prior to Bitcoin’s bullish breakout above $109k, short traders had accumulated around $12B in leveraged positions, with many of these bets entered around the $118k level, anticipating a strong rejection from that point.
The trap was set. But it was the bears, not the bulls, who were about to be caught.
The initial catalyst was the clean break above the $109,000 resistance. This was followed by a swift move above a key bearish trend line that had formed on shorter timeframes, with resistance at $111,000. As the price then confidently reclaimed the $112,500 zone and began trading above the 100-hourly Simple Moving Average, the first wave of liquidations began.
What followed was a textbook short squeeze of epic proportions. As automated margin calls were triggered, computer algorithms began to market-buy Bitcoin at any price to close the losing short positions. This forced buying pressure propelled BTC through $113,000, then $114,000, and $115,000 in what felt like mere moments. The higher the price went, the more short sellers were forced to capitulate. The $12 billion in leveraged positions, once a wall of sell-side pressure, became a colossal wave of buy-side demand. The price action culminated in a spectacular surge past $116,000 and eventually screaming past $118,800, leaving market commentators and traders alike breathless. This event was a brutal lesson in the inherent risks of shorting a structurally bullish asset in a high-leverage environment.
Part 2: A New Paradigm: Institutional Capital and Regulatory Clarity
While the short squeeze provided the explosive catalyst, the true engine of this bull market is fundamentally different from those of the past. The frenzied, retail-driven manias of 2017 and 2021 have been replaced by a more deliberate, capital-heavy, and institutionally-led advance. The "Crypto Summer" of 2025 is built on the bedrock of legitimacy that only Wall Street and a clear regulatory stance could provide.
The ETF Revolution Matures
The launch of spot Bitcoin ETFs in early 2024 was a watershed moment, but 2025 is the year their impact has become undeniably dominant. These regulated financial products have provided a secure and familiar bridge for institutional investors, hedge funds, and even sovereign wealth funds to gain exposure to Bitcoin. The results have been staggering. In a clear sign of a changing of the guard in the world of alternative assets, spot Bitcoin ETFs have captured an astonishing 70% of gold’s inflows in 2025.
This statistic is more than just a headline; it represents the tangible manifestation of the "digital gold" narrative. For years, proponents have argued that Bitcoin's provable scarcity and decentralized nature make it a superior store of value to the yellow metal. Now, the flow of funds from the world's largest asset managers is proving this thesis correct. BlackRock’s IBIT, in particular, has shattered ETF records, becoming one of the fastest-growing funds in history and signaling to the entire financial establishment that Bitcoin is no longer a fringe asset but a core portfolio component.
The Certainty of Regulation
For years, the spectre of regulatory uncertainty has cast a long shadow over the crypto markets, deterring conservative institutional players. A key driver of the 2025 bull market has been the emergence of a clear regulatory outlook in major jurisdictions like the United States and Europe. With comprehensive market structure bills passed, clear guidelines on custody, and a defined tax framework, the biggest obstacle for institutional adoption has been removed.
This regulatory clarity has done more than just open the floodgates for capital; it has legitimized the entire asset class. Institutions operate on long-term horizons and require predictable rules of engagement. With these in place, they are no longer making a speculative bet but a strategic allocation to a new, globally recognized asset class. This influx of what is often called "stickier" capital—long-term investment rather than short-term speculation—is helping to build a more stable market foundation and reduce some of the notorious volatility associated with Bitcoin.
Part 3: Reading the Charts and Chains
The story of this bull run is written not only in the headlines but also in the data. A confluence of technical chart patterns, on-chain analytics, and market sentiment indicators paints a uniquely bullish picture, suggesting that this rally may have much further to run.
Technical Analysis: Echoes of the Past, Pointers to the Future
For seasoned market observers, the BTC price action in 2025 has mirrored the 2017 macro bullish breakout. The fractal nature of Bitcoin's four-year cycles, often centered around its programmatic "halving" events, appears to be playing out once again. The structure of the consolidation below $100,000 and the subsequent explosive breakout bears a striking resemblance to the patterns that preceded the parabolic run to $20,000 in 2017.
On a more granular level, the price has decisively conquered several key technical levels. The break above the bearish trend line at $111,000 was a critical signal that the downtrend pressure had been absorbed. Now, with the price trading firmly above $113,500 and the 100-hourly Simple Moving Average, these former resistance zones are expected to act as strong support levels for any potential pullbacks. The next major hurdle appears to be the $116,800 resistance zone, a level that, if cleared, could open the door to a much larger upward expansion.
Perhaps the most tantalizing model for predicting the cycle top is the Bitcoin "power law" model. This model suggests that Bitcoin's price growth over time follows a predictable exponential path when plotted on a logarithmic scale. Developed by analyst Giovanni Santostasi, the model views Bitcoin's long-term growth not as a random walk but as a structured, measurable trajectory akin to natural growth phenomena. According to analysts applying this model, Bitcoin is currently trading ahead of its long-term power law curve. Historically, this has been a sign that the market is entering the final, euphoric phase of its bull cycle. Based on this model, some analysts believe a Bitcoin Christmas rally to $200K or even $300K is possible, with the parabolic rally potentially lasting until the end of the year.
On-Chain Analysis: A Supply Shock in the Making
On-chain analysis, which involves examining data directly from the blockchain, provides a transparent view of investor behavior. One of the most encouraging signs for this rally is that Bitcoin Supply On Exchanges Remain Low Amid Latest Milestone. When investors move their BTC off exchanges, it is typically to place them in secure, self-custody wallets for long-term holding. This reduces the immediately available supply that can be sold on the market, creating a "supply shock" dynamic where even a small increase in demand can have an outsized impact on price. The current trend indicates that new institutional buyers and long-term believers are accumulating coins and have no intention of selling at current prices.
Further bolstering the bullish case is the metric of profitability. The market has reached a point where Bitcoin has broken records with 100% profitable days and unmatched returns. This means that for a vast majority of its history, buying and holding Bitcoin has been a profitable endeavor, reinforcing its narrative as one of an incredibly successful long-term asset.
However, a note of caution comes from on-chain analytics firm Glassnode, which warns that despite the breakout to over $118,000, liquidity is still thin. This means the order books on exchanges are not particularly deep. While this can amplify moves to the upside, it also means that a large sell order could cause a sharp and swift correction. This thin liquidity explains the continued volatility and serves as a reminder that the market, while more mature, is still susceptible to violent price swings.
Sentiment Analysis: A Rally Without the Mania
Perhaps the most compelling argument for further upside potential is what is absent from this rally: hype. In previous cycle tops, the market was characterized by a palpable mania. Bitcoin dominated mainstream news, celebrity endorsements were rampant, and stories of overnight crypto millionaires were inescapable.
This time is different. In a sign that suggests significant further upside potential, the current Bitcoin All-Time High Lacks Hype. Google Trends for "Bitcoin" are not at their peak, social media is not yet in a state of collective FOMO (Fear Of Missing Out), and the general public is not yet clamoring to get in. This suggests that the rally so far has been driven by the "smart money" of institutions. The retail-driven "mania phase," which typically marks the final blow-off top of a bull cycle, has not yet begun. This quiet confidence, devoid of irrational exuberance, is seen by many analysts as one of the healthiest indicators for the market's future.
Part 4: The Macroeconomic Tailwinds
A key factor is the falling dollar and anticipated Federal Reserve interest rate cuts. The US Dollar Index (DXY), which measures the greenback against a basket of foreign currencies, has been in a significant downtrend throughout 2025, hitting its lowest levels in over two decades relative to its moving averages. There is a historically strong inverse correlation between the DXY and Bitcoin; a weaker dollar makes assets priced in dollars, like BTC, more attractive to foreign investors and also pushes domestic investors to seek hedges against currency debasement.
Furthermore, the anticipation of interest rate cuts by the Federal Reserve to stimulate a slowing economy makes holding cash and low-yielding government bonds less attractive. This monetary policy shift encourages a "risk-on" environment, where capital flows out of safe-haven assets and into those with higher growth potential. As the ultimate digital risk-on asset, Bitcoin stands as a major beneficiary of this capital rotation.
The magnitude of this rally has also had fascinating side effects, such as the fact that the Bitcoin Surge Pushes Satoshi Nakamoto Into Global Top 15 Rich List. Based on the estimated 1.1 million BTC held by Bitcoin's pseudonymous creator, the recent price surge would place their net worth among the wealthiest individuals on the planet—a testament to the incredible value creation of this new technology.
Part 5: How to Prepare for the Imminent Crypto Summer
With a potential parabolic rally to $200,000 or $300,000 on the horizon, the central question for every investor is how to position themselves. The answer depends heavily on one's experience and risk tolerance. (This section is for informational purposes and should not be construed as financial advice).
For the Newcomer:
1. Education Before Allocation: Before investing a single dollar, take the time to understand what Bitcoin is. Learn about its core principles of decentralization, scarcity, and self-custody. Do not simply buy based on FOMO.
2. Dollar-Cost Averaging (DCA): Entering a market that is already in a parabolic uptrend can be risky. DCA involves investing a fixed amount of money at regular intervals, regardless of the price. This strategy reduces the risk of buying the top and smooths out your average entry price over time.
3. ETFs vs. Self-Custody: For the first time, investors have a simple choice. Buying a spot Bitcoin ETF through a traditional brokerage account is easy and secure. However, the core ethos of Bitcoin is self-sovereignty ("not your keys, not your coins"). Learning to use a hardware wallet to take self-custody of your coins is the ultimate way to embrace the technology, but it comes with greater personal responsibility.
For the Experienced Investor:
1. Prudent Risk Management: The warning of thin liquidity should be heeded. Volatility will remain high. Use stop-losses to protect capital, avoid excessive leverage, and do not get caught up in the euphoria. Have a clear plan for both entry and exit points.
2. Develop a Profit-Taking Strategy: No asset goes up forever. It is crucial to have a plan for taking profits. This could involve selling a certain percentage of your holdings at pre-determined price targets (e.g., $150k, $200k, $250k) or using technical indicators to signal a potential market top.
3. Look Beyond Bitcoin: Historically, a major Bitcoin rally paves the way for a subsequent "alt-season." As Bitcoin's dominance peaks, capital often rotates into Ethereum and other alternative cryptocurrencies with strong fundamentals, leading to explosive gains in those assets. Researching promising projects now could position you for the next phase of the crypto summer.
Finally, it is essential to address the question: Breakout Or Brutal Bull Trap? While all signs point to a sustained, institutionally-backed bull market, the risk of sharp corrections remains. Parabolic advances are often followed by equally dramatic pullbacks. The thin liquidity could exacerbate such a move. Staying grounded, managing risk, and sticking to a well-defined plan are the keys to surviving and thriving.
Conclusion
The Bitcoin story of 2025 is a symphony of powerful forces playing in perfect harmony. The violent crescendo of a $12 billion short squeeze announced its arrival, but the enduring melody is one of profound structural change. The unwavering commitment of institutional capital, flowing through newly approved and highly successful ETFs, has provided a stable and deep foundation for the market. This, combined with a clear regulatory framework and supportive macroeconomic tailwinds from a weakening dollar, has created the conditions for a historic "Crypto Summer."
Unlike the retail-driven manias of the past, this rally is characterized by a quiet confidence, a lack of widespread hype, and on-chain data that points to a severe supply shock. Models like the power law suggest that the journey is far from over, with potential targets that would have seemed fantastical just a year ago.
The road ahead will undoubtedly be volatile. But for those who understand the underlying dynamics at play—the institutional shift, the market structure, the on-chain truths—the path to navigating this new era is clear. The summer has just begun.
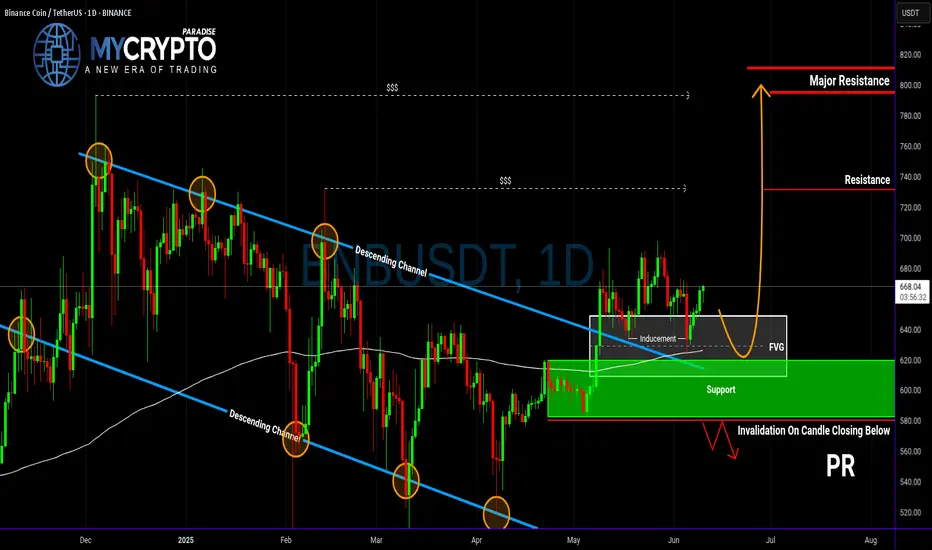
Is BNB About to Explode—or About to Collapse?Yello Paradisers! Could this be the beginning of the next BNB rally, or just another classic trap to liquidate early longs before the real move begins? Let’s dive into this high-probability setup before it’s too late.
💎BNBUSDT is currently showing good signs of bullish continuation. The price has successfully broken out of a descending channel and performed a precise retest of that structure—an early confirmation of strength. Following this, we’ve seen a strong reaction from a Fair Value Gap (FVG) and the 200 EMA, both of which align perfectly with the inducement taken just before the bounce. This confluence of technical signals significantly increases the probability of a sustained bullish move in the near term.
💎If price pulls back from current levels, it could offer us a more attractive risk-to-reward opportunity for long entries. Traders who are targeting higher RR ratios, such as 1:2 or beyond, may prefer to wait for a deeper pullback into our predefined support zone for a cleaner entry. This zone remains critical for maintaining our bullish bias.
💎However, if the price breaks down and we see a full candle close below that support zone, the entire bullish scenario becomes invalid. In such a case, it would be more prudent to stay on the sidelines and wait for a clearer and more favorable price action setup to emerge before jumping back in.
We are playing it safe right now. If you want to be consistently profitable, you need to be extremely patient and always wait only for the best, highest probability trading opportunities.
MyCryptoParadise
iFeel the success🌴
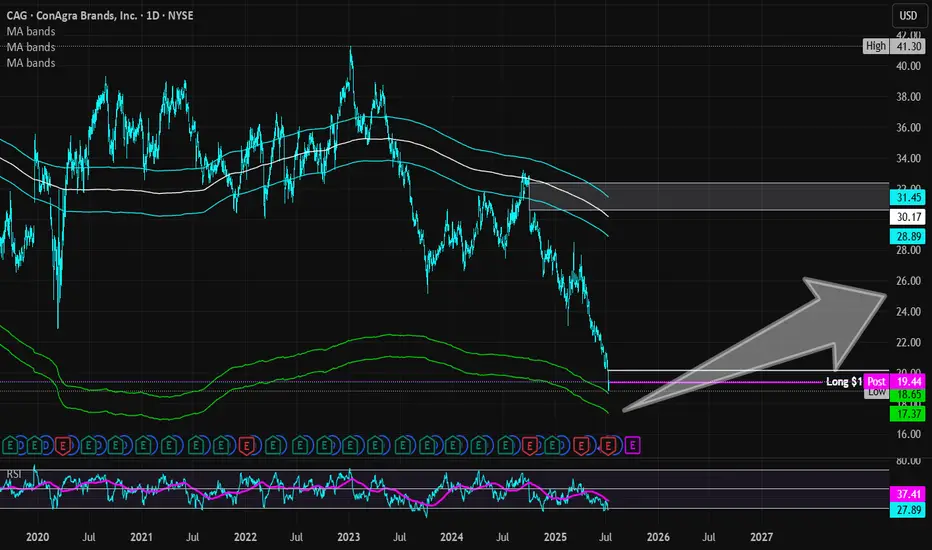
ConAgra Brands | CAG | Long at $19.38ConAgra Brands NYSE:CAG , maker of Marie Callender's, Healthy Choice, Birds Eye, Orville Redenbacher's, Slim Jim, and many more, has seen a continuous drop in share price since the rise of interest rates, inflation, and tariffs. The stock is currently trading near its book value of $18.71 and has a dividend yield of 6.9%. Debt-to-equity is reasonable (0.9x), but the company does have a Quick Ratio of 0.2x (short-term liquidity issues) and a Altman's Z Score (bankruptcy risk) of 1.7, which should ideally be 3+. Like almost every large-scale food company, earnings growth is relatively low, but 2025 is anticipated to be its worst performing year - which explains the price.
While the stock is not likely to generate triple-digit returns in the near-term, NYSE:CAG is a strong company with a nice dividend and some growth ahead. I foresee such stocks getting new life with drops interest rates. However, a dip near $17 (into my "crash" simple moving average area) or even slightly lower is possible - which may likely result in another stock entry.
Thus, at $19.38, NYSE:CAG is in a personal buy-zone with future entries planed near $17 or below.
Targets into 2028
$22.00 (+$13.5%)
$25.00 (+29.0%)
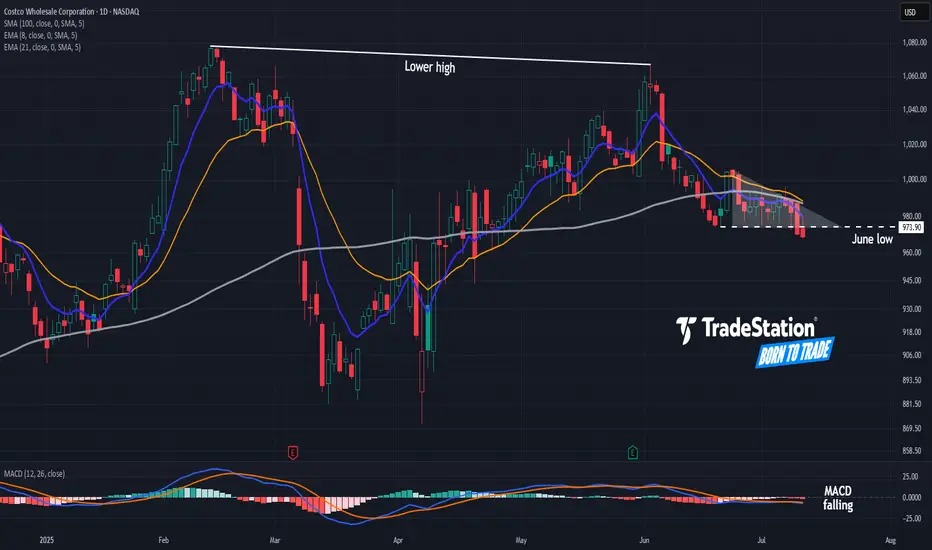
Potential Top in CostcoCostco Wholesale has been quietly limping, and some traders may see downside risk in the big-box retailer.
The first pattern on today’s chart is the June low of $973.90. COST made lower highs while trying to hold that level but is now sliding below it. That may be viewed as a potentially bearish triangle breakdown.
Second, the 8-day exponential moving average (EMA) is under the 21-day EMA. MACD is also falling. Both of those signals may be consistent with short-term downtrends.
Third, COST made a lower high in June compared with February. Compared with the broader market’s breakout, such price action may reflect a lack of buying interest.
Finally, the 100-day simple moving average has turned meaningfully lower for the first time in over two years. That may suggest a weakening longer-term trend.
TradeStation has, for decades, advanced the trading industry, providing access to stocks, options and futures. If you're born to trade, we could be for you. See our Overview for more.
Past performance, whether actual or indicated by historical tests of strategies, is no guarantee of future performance or success. There is a possibility that you may sustain a loss equal to or greater than your entire investment regardless of which asset class you trade (equities, options or futures); therefore, you should not invest or risk money that you cannot afford to lose. Online trading is not suitable for all investors. View the document titled Characteristics and Risks of Standardized Options at www.TradeStation.com . Before trading any asset class, customers must read the relevant risk disclosure statements on www.TradeStation.com . System access and trade placement and execution may be delayed or fail due to market volatility and volume, quote delays, system and software errors, Internet traffic, outages and other factors.
Securities and futures trading is offered to self-directed customers by TradeStation Securities, Inc., a broker-dealer registered with the Securities and Exchange Commission and a futures commission merchant licensed with the Commodity Futures Trading Commission). TradeStation Securities is a member of the Financial Industry Regulatory Authority, the National Futures Association, and a number of exchanges.
TradeStation Securities, Inc. and TradeStation Technologies, Inc. are each wholly owned subsidiaries of TradeStation Group, Inc., both operating, and providing products and services, under the TradeStation brand and trademark. When applying for, or purchasing, accounts, subscriptions, products and services, it is important that you know which company you will be dealing with. Visit www.TradeStation.com for further important information explaining what this means.
HUB24 Ltd Quote | Chart & Forecast SummaryKey Indicators On Trade Set Up In General
1. Push Set Up
2. Range Set Up
3. Break & Retest Set Up
Notes On Session
# HUB24 Ltd Quote
- Double Formation
* (Area Of Value)) - (Range Structure)) *A+ | Completed Survey
* (2nd Entry Area)) - *0.5 Retracement Feature | Subdivision 1
- Triple Formation
* (P1)) / (P2)) & (P3)) | Subdivision 2
* (TP1) = a / Long Consecutive Range
* (TP2) = b / Short Consecutive Pullback | Subdivision 3
* Daily Time Frame | Trend Settings Condition
- (Hypothesis On Entry Bias)) | Indexed To 100
- Position On A 1.5RR
* Stop Loss At 120.00 AUD
* Entry At 126.00 AUD
* Take Profit At 133.00 AUD
* (Uptrend Argument)) & No Pattern Confirmation
- Continuation Pattern | Not Valid
- Reversal Pattern | Not Valid
* Ongoing Entry & (Neutral Area))
Active Sessions On Relevant Range & Elemented Probabilities;
European-Session(Upwards) - East Coast-Session(Downwards) - Asian-Session(Ranging)
Conclusion | Trade Plan Execution & Risk Management On Demand;
Overall Consensus | Buy
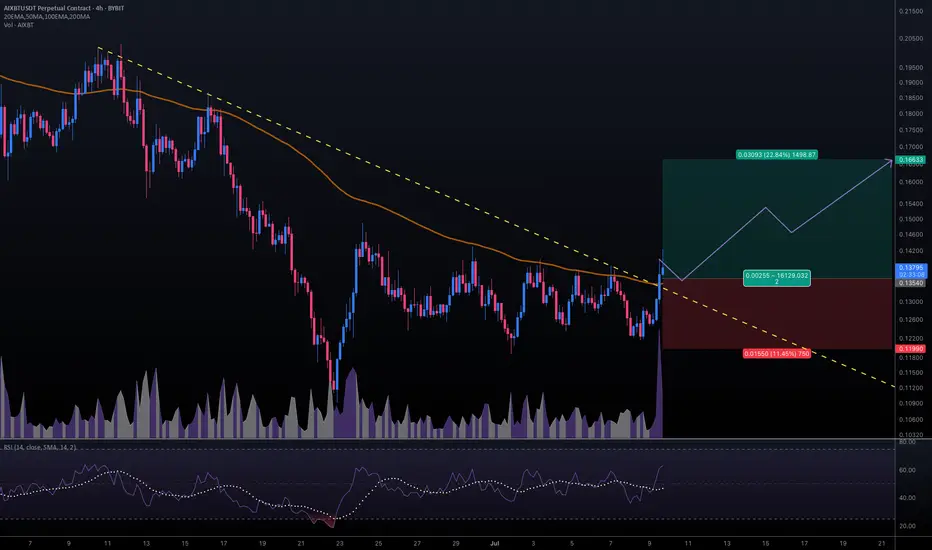
#AIXBTUSDT #4h (ByBit) Descending trendline breakout$AIXBT just regained 100EMA support and looks ready for short-term recovery.
BYBIT:AIXBTUSDT.P aixbt.tech
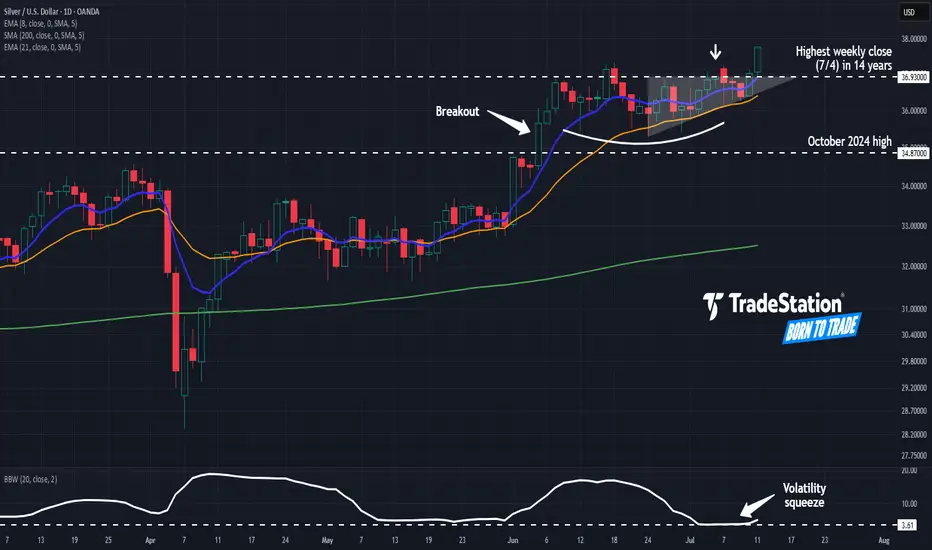
Silver Pushes HighsSilver broke out a month ago, and some traders may think the metal is ready to run.
The first pattern on today’s chart is last Friday’s last price of 36.93. It was the highest weekly close in 14 years, which may reflect buying pressure.
Second, XAGUSD has made higher lows while remaining trapped below resistance. That ascending triangle is a potentially bullish continuation pattern.
Third, the 8-day exponential moving average (EMA) has remained above the 21-day EMA. Such configurations can be consistent with positive short-term momentum.
Finally, Bollinger Band Width recently dropped to a four-year low. Will that tight price compression give way to expansion?
Check out TradingView's The Leap competition sponsored by TradeStation.
TradeStation has, for decades, advanced the trading industry, providing access to stocks, options and futures. If you're born to trade, we could be for you. See our Overview for more.
Past performance, whether actual or indicated by historical tests of strategies, is no guarantee of future performance or success. There is a possibility that you may sustain a loss equal to or greater than your entire investment regardless of which asset class you trade (equities, options or futures); therefore, you should not invest or risk money that you cannot afford to lose. Online trading is not suitable for all investors. View the document titled Characteristics and Risks of Standardized Options at www.TradeStation.com . Before trading any asset class, customers must read the relevant risk disclosure statements on www.TradeStation.com . System access and trade placement and execution may be delayed or fail due to market volatility and volume, quote delays, system and software errors, Internet traffic, outages and other factors.
Securities and futures trading is offered to self-directed customers by TradeStation Securities, Inc., a broker-dealer registered with the Securities and Exchange Commission and a futures commission merchant licensed with the Commodity Futures Trading Commission). TradeStation Securities is a member of the Financial Industry Regulatory Authority, the National Futures Association, and a number of exchanges.
TradeStation Securities, Inc. and TradeStation Technologies, Inc. are each wholly owned subsidiaries of TradeStation Group, Inc., both operating, and providing products and services, under the TradeStation brand and trademark. When applying for, or purchasing, accounts, subscriptions, products and services, it is important that you know which company you will be dealing with. Visit www.TradeStation.com for further important information explaining what this means.
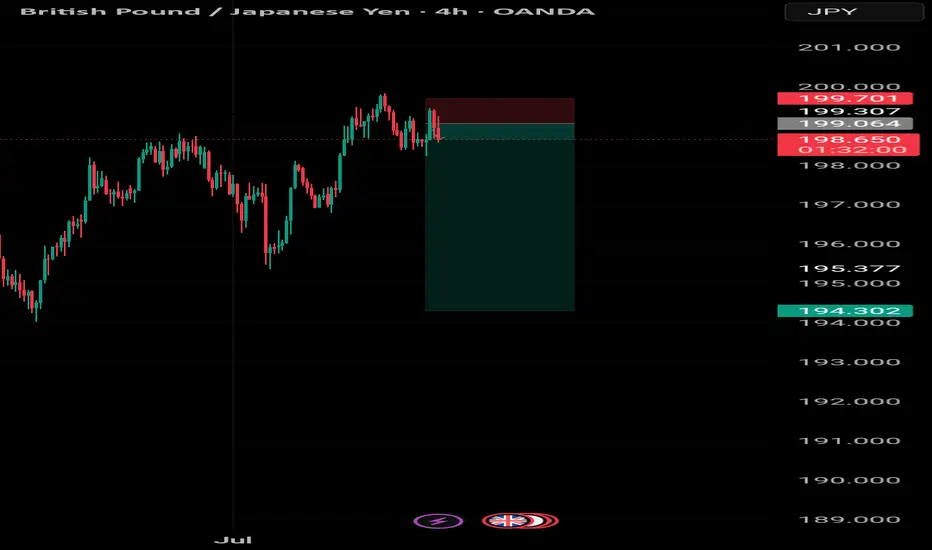
GBPUSD SELLFind a nice entry
Place trade based
Ensure risk management based on available funds
This is a 1:12 trade
Agilon Health | AGL | Long at $2.36Reentering this trade (original: )
Agilon Health NYSE:AGL
Pros:
Revenue consistently grew from 2019 ($794 million) to 2024 ($6.06 billion). Expected to reach $9.16 billion by 2028.
Current debt-to-equity ratio 0.07 (very low)
Sufficient cash reserves to fund operations and strategic initiatives
Strong membership growth (659,000 in 2024, a 38% year-over-year increase)
Recent insider buying ($2 - $3) and awarding of options
Cons:
Rising medical costs - currently unprofitable and not forecast to become profitable over the next 3 years
Medicare Advantage Membership issues with the new political administration
No dividend
It's a gamble and I think it's a possibility this could drop near $1 in the near-term due to the Medicaid changes/fear... regardless, long-term, personal buy-zone at $2.36.
Targets in 2027
$3.70 (+56.8%)
$5.25 (+122.5%)
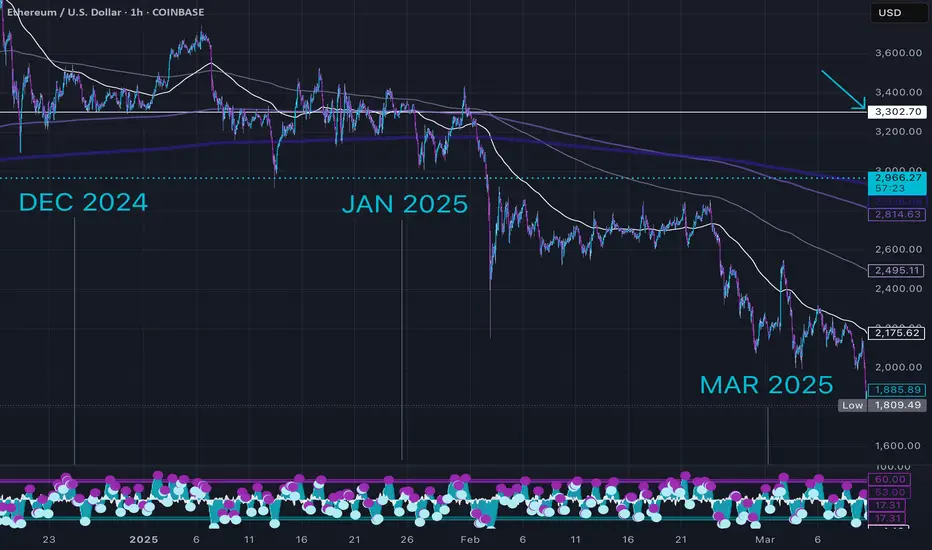
ETH - Back at the Level Everyone Forgot.Everyone’s watching ETH pump right now like it’s something new. It’s not. Look closer:
This is a look back in time to the breakdown that started to slide in Jan 2025.
That clean base around $3300 was holding for months in late 2024. It failed in January Q1, dragged us to sub-$2K by March, but now we’re right back under it.
This isn’t a random pump, it’s ETH revisiting the exact area it broke down from.
• White line = previous floor that gave out
• Dotted line = current price climbing back up into that structure
A move above $2960–$3300 flips the entire structure from resistance to reclaimed floor.
Market memory’s short, but price tends to remember everything.
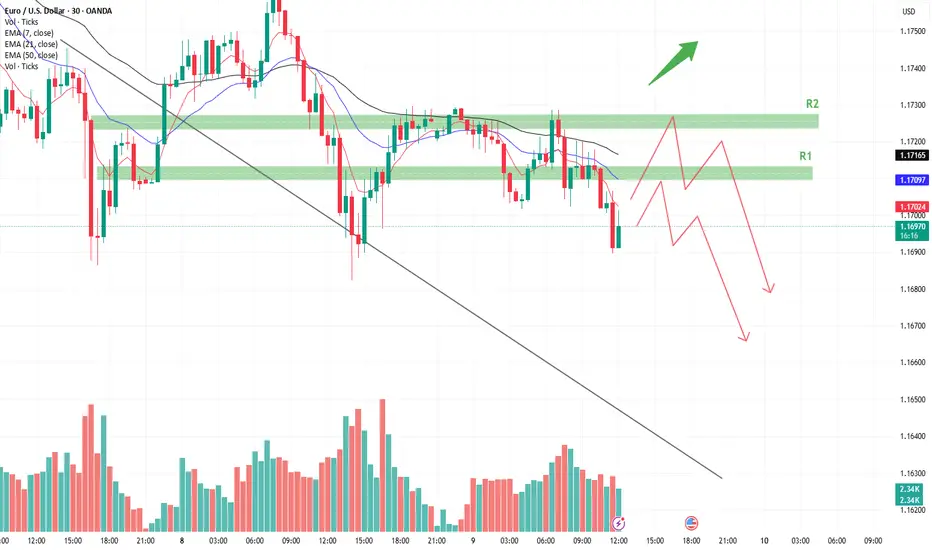
EURUSD Technical Analysis**Chart Overview:**
* **Pair:** EUR/USD
* **Timeframe:** 30-minute
* **Trend:** Bearish (Confirmed by lower highs, lower lows, and downward-sloping trendline)
---
🔍 **Technical Analysis :**
**1. Downtrend Structure**
* Price is consistently making **lower highs and lower lows**, confirming a **strong downtrend**.
* A clear **descending trendline** is respected multiple times as resistance.
**2. EMAs (7, 21, 50)**
* All EMAs (blue, purple, black) are sloping downward.
* Price is trading **below all EMAs**, signaling continued bearish momentum.
* EMA 50 (\~1.1716) acts as a **dynamic resistance** zone.
**3. Key Resistance Zones (Marked as R1 & R2)**
* **R1 Zone (\~1.1710–1.1720):** Previous support now turned resistance. Could see rejection here.
**R2 Zone (\~1.1730+):** Higher resistance, possibly tested if R1 breaks. Also aligns with EMA confluence.
**4. Volume Analysis**
* Volume shows **spikes on bearish candles**, which suggests **strong selling interest** at lower highs.
* No significant bullish volume breakout so far.
📈 **Price Projection Path (Red Arrows)**
* The red path illustrates a **bearish price projection**:
* Price may pull back into **R1 or R2**
* Likely to face **resistance & rejection** from those levels
* Expected to make **lower highs and resume downside movement**
* Potential drop toward **1.1670, 1.1650, and lower**
🟢 **Bullish Invalidator**
* If price **breaks and holds above R2 (\~1.1735+)** with volume, it may indicate a **trend reversal or bullish correction**.
---
**Summary:**
* **Bias:** Bearish
* **Resistance Zones to Watch:**
* R1: 1.1710–1.1720
* R2: 1.1730–1.1740
* **Targets on Downside:**
* 1.1670
* 1.1650 or lower
* **Confirmation Needed:** Bearish rejection candles or failure to break R1/R2
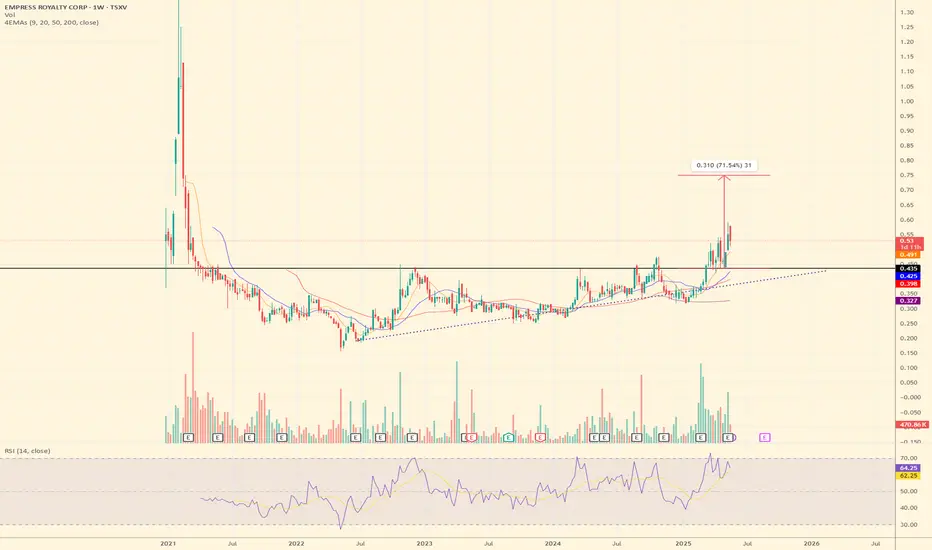
Empress Royalty – Undervalued Precious Metals Royalty🔹 Fundamental Outlook:
Empress Royalty offers exposure to gold and silver through a diversified portfolio of streaming and royalty agreements, with a focus on earlier-stage producers and developers. Backed by strategic partnerships with Endeavour Financial and Terra Capital, the company leverages deep deal flow and structuring expertise, while keeping overhead lean.
Cash flowing from several active royalties
EV/EBITDA (TTM): ~2.3 – indicating deep value
Free Cash Flow: ~$33M
Float: Only ~43M shares – tightly held
No major debt concerns (cash/debt ratio ~1.44)
The recent appointment of Mark Ashcroft as Business Development Advisor (North America) further boosts Empress’ ability to scale its portfolio with quality assets in the region.
✅ Undervalued vs peers on cash flow and earnings
✅ Royalty model limits operational risk
✅ Exposure to gold and silver (a rare mix)
✅ Insiders and partners with long-standing mining credentials
✅ Benefiting from a rising silver sentiment and the search for non-dilutive capital by small/mid-tier miners
🔹 Risks:
Operator dependency (as a royalty company)
Exposure to early-stage projects with potentially higher execution risk
Thin trading volume at times, which may increase volatility
📈 Conclusion:
Empress Royalty is a fundamentally solid, technically bullish small-cap royalty play. With silver sentiment turning and precious metals investors rotating into high-leverage names, EMPR offers both growth potential and asymmetric reward/risk.
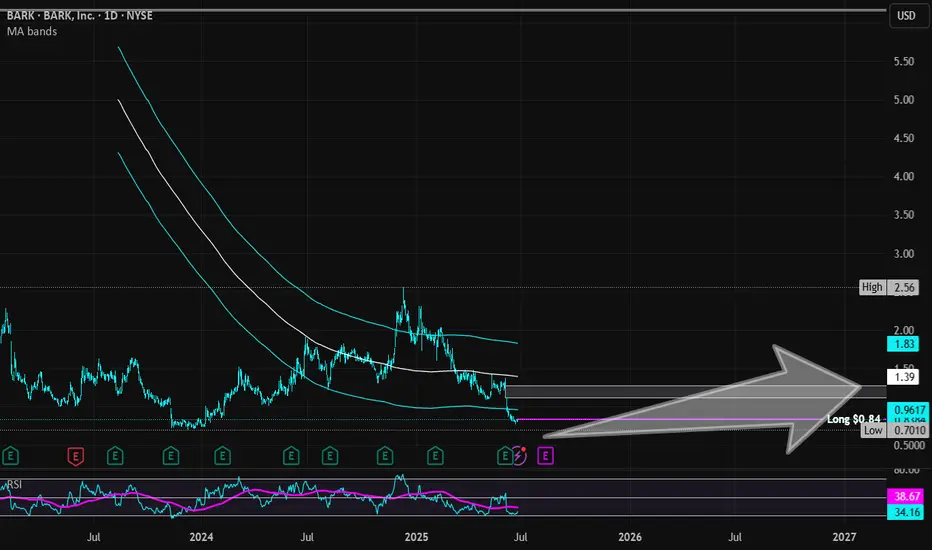
Bark | BARK | Long at $0.84BARK, Inc. NYSE:BARK is a dog-focused company offering subscription-based products like BarkBox and Super Chewer, delivering monthly toys, treats, and pet supplies. It operates in Direct-to-Consumer and Commerce segments, selling through its website, retail partners, and e-commerce platforms. While not overly bullish here, especially given the economic / recession-fear headwinds, I think this is one of those stocks that may have a future "pop" as interest rates are lowered, or news emerges of the company expanding to new retail partners. A few insiders have recently purchased shares (~$75k under $1.00) and others have been awarded options. The book value currently rests near $0.64. It may dip between that price at $0.50 in the near-term. However, that's just been the trajectory of SO many of these SPAC stocks... dip then pop or bust.
Fundamentally, nothing to uproar over and this is a risky investment (Nasdaq delisting may occur). The positive is the debt-to-equity in 0.9x, which is pretty good for a small company. But 2026 is expected to be its worst earnings year. The future may look bright in 2027 and beyond, but can the company last? Time will tell.
Thus, for a swing trade, NYSE:BARK is in a personal buy zone at $0.84 with a risk of further near-term decline between $0.50 and $0.64.
Targets into 2027
$0.95 (+13.1%)
$1.25 (+48.8%)
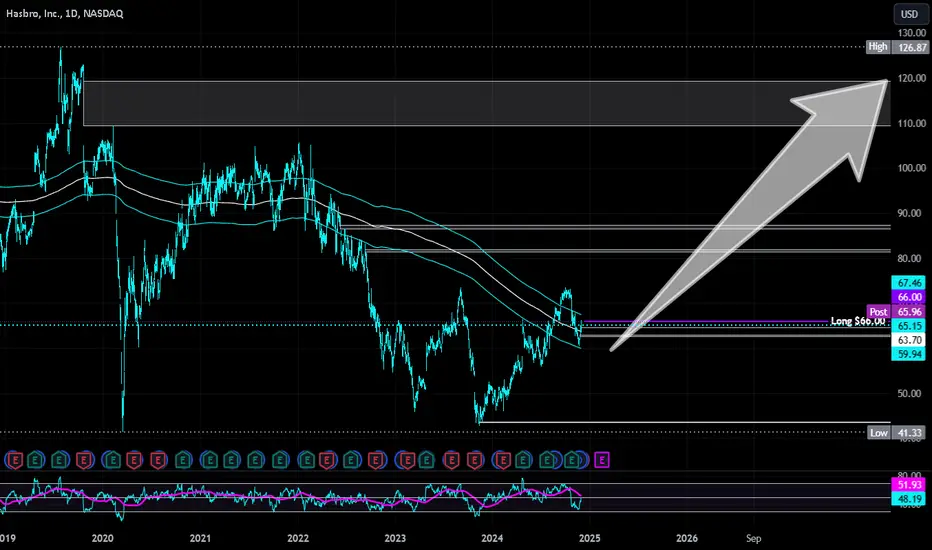
Hasboro | HAS | Long at $66.00Hasboro $NASDAQ:HAS. Bouncing in an out of the historical simple moving average (SMA). While it may take a bit for it to spring out and continue its upward trend, it looks poised to do so. However, there is a small price gap that was never closed in the $40's that investors should stay cautious of if the downward trend continues. But a "confirmation" of a reversal will be either a continued move up or a retest of the lower historical SMA band (to close the recent price gaps) followed by a further move up. Fundamentally, NASDAQ:HAS has a high level of debt, but earnings growth is forecasted in its future. At $66.00, $ NASDAQ:HAS is in a personal buy zone, but patient investors may wish to wait for further confirmation of a reversal.
Target #1 = $73.00
Target #2 = $81.00
Target #3 = $87.00
Target #4 = $119.00 (very long-term...)
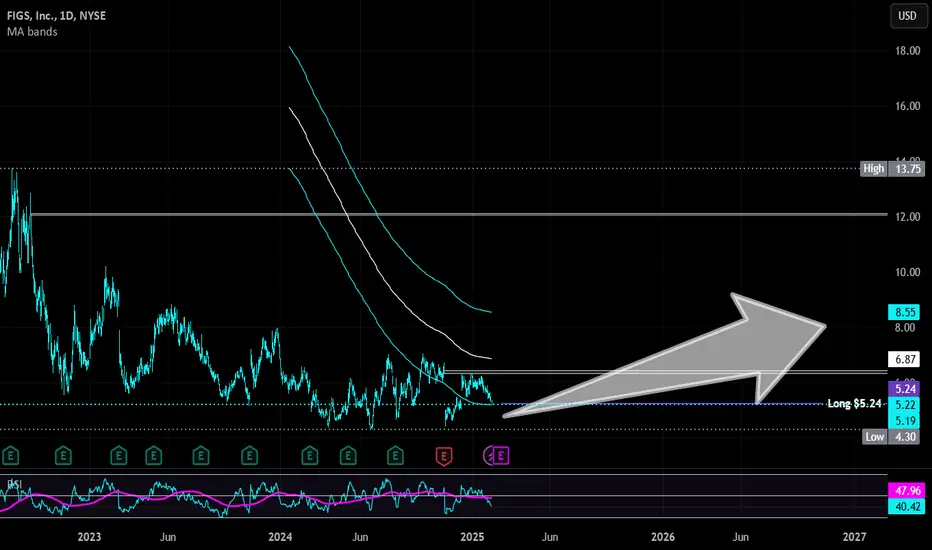
Figs Inc | FIGS | Long at $5.24Figs Inc $NYSE:FIGS. Technical analysis play first, fundamentals second.
My selected historical simple moving average lines have converged with the stock price, which often leads to sideways trading and a reversal in the downward trend (i.e. future price increase). The downward trend is flattening, but that doesn't mean post-earnings drop to $1.50-$2.00 isn't out of the question...
The FIGS brand is growing within the healthcare world with significant opportunities overseas. While economic headwinds may impede near/medium-term growth, revenue is anticipated to grow into 2027. EPS is expected to rise from 0.01 in 2024 to 0.20 by 2027. While this is not a "value" play and there is high risk for rug pulls, something may be brewing within the chart for a move up. Tread lightly, however...
Targets
$6.00
$6.40
$7.00
$8.00
THG Holdings PLC Quote | Chart & Forecast SummaryKey Indicators On Trade Set Up In General
1. Push Set Up
2. Range Set Up
3. Break & Retest Set Up
Notes On Session
# THG Holdings PLC Quote
- Double Formation
* (Fractional Spike)) - *A+ | Completed Survey
* (EMA Settings)) - *100 EMA Feature | Subdivision 1
- Triple Formation
* (P1)) / (P2)) & (P3)) | Subdivision 2
* (TP1) = a / Long Consecutive Range
* (TP2) = b / Short Consecutive Pullback | Subdivision 3
* Daily Time Frame | Trend Settings Condition
- (Hypothesis On Entry Bias)) | Indexed To 100
- Position On A 1.5RR
* Stop Loss At 54.00 GBP
* Entry At 46.00 GBP
* Take Profit At 34.00 GBP
* (Downtrend Argument)) & No Pattern Confirmation
- Continuation Pattern | Not Valid
- Reversal Pattern | Not Valid
* Ongoing Entry & (Neutral Area))
Active Sessions On Relevant Range & Elemented Probabilities;
European-Session(Upwards) - East Coast-Session(Downwards) - Asian-Session(Ranging)
Conclusion | Trade Plan Execution & Risk Management On Demand;
Overall Consensus | Sell

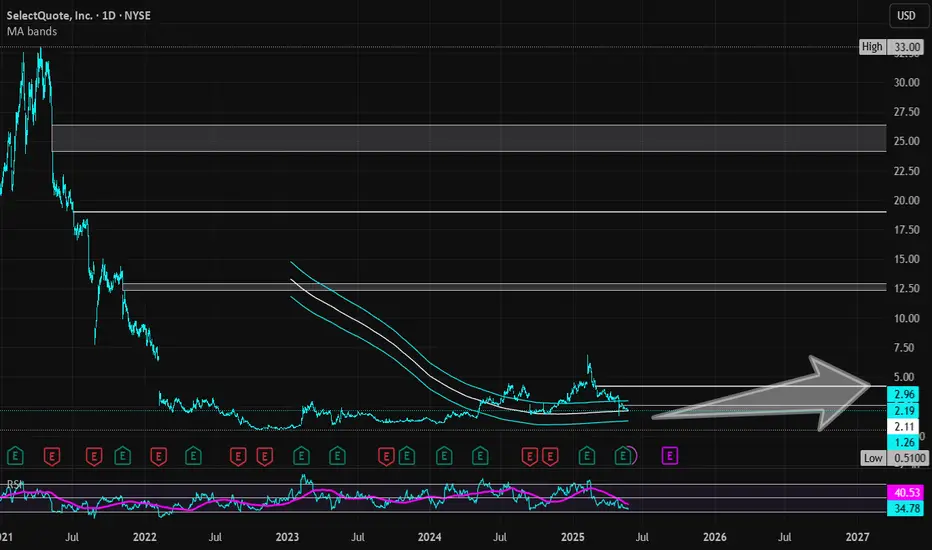
SelectQuote | SLQT | Long at $2.18SelectQuote NYSE:SLQT is currently resting within my historical simple moving average zone. This often signals consolidation and a future move (in this case, let's hope up). Looking at the company's financials, NYSE:SLQT is currently profitable. For Q3 2025 (ended March 31, 2025), the company reported a net income of $26.0 million, up from $8.6 million in Q3 2024. This follows a strong Q2 2025 with a net income of $53.2 million. While like most companies there are likely headwinds in 2025 (earnings are projected at a loss of -$0.20 per share due to seasonal fluctuations and investments in 2025 (e.g., new Kansas facility)), profitability is likely to stabilize in 2026, with EPS forecasts of $0.05, supported by improved Medicare reimbursement rates and operational efficiencies. Ongoing Department of Justice allegations could pose risks... but SelectQuote’s recent $350M investment and cost management suggest profitability may continue if legal issues are resolved favorably.
Thus, at $2.18, NYSE:SLQT is in a personal buy zone. There is a potential for the price to dip to the bottom of the historical simple moving average channel (near $1.25) in the near-term, but time will tell.
Targets:
$2.64
$4.24