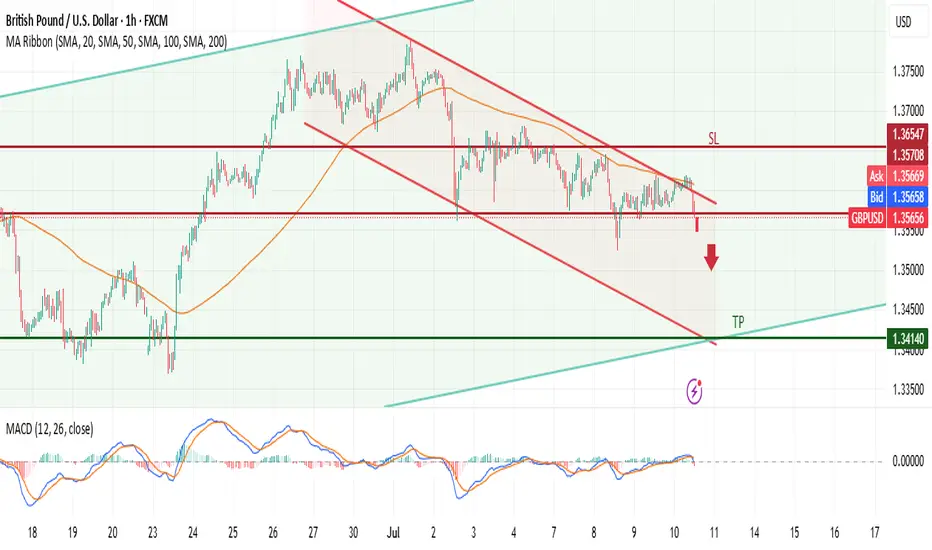
GBPUSD – Classic FRL setup unfoldingWe have a clear descending channel (wedge) on H1, with the price testing the neckline level after a corrective consolidation.
According to Fractal Reversal Law (FRL):
The neckline is drawn horizontally at the start of the last impulse, not on the top of the candle wicks.
The price has retested the neckline multiple times, forming a clean structure before potential continuation.
The 100 SMA is above the price, confirming the bearish structure and scale alignment.
Trade Plan:
🔻 Entry: Below the neckline on confirmation of breakout.
🔻 Stop Loss (SL): Above the upper boundary of the channel and last swing high (clearly marked on the chart).
🔻 Take Profit (TP): At the intersection of the lower channel line with the long-term ascending trendline (green support), around 1.34 area.
Confirmation:
• The MACD shows momentum fading, indicating a potential downside move aligning with the FRL setup.
• We expect a clean impulse downward after a tight consolidation, providing a high-probability entry.
Following the FRL principles, we wait for a clean breakout below the neckline to confirm the structure shift before entering.
Moving Averages
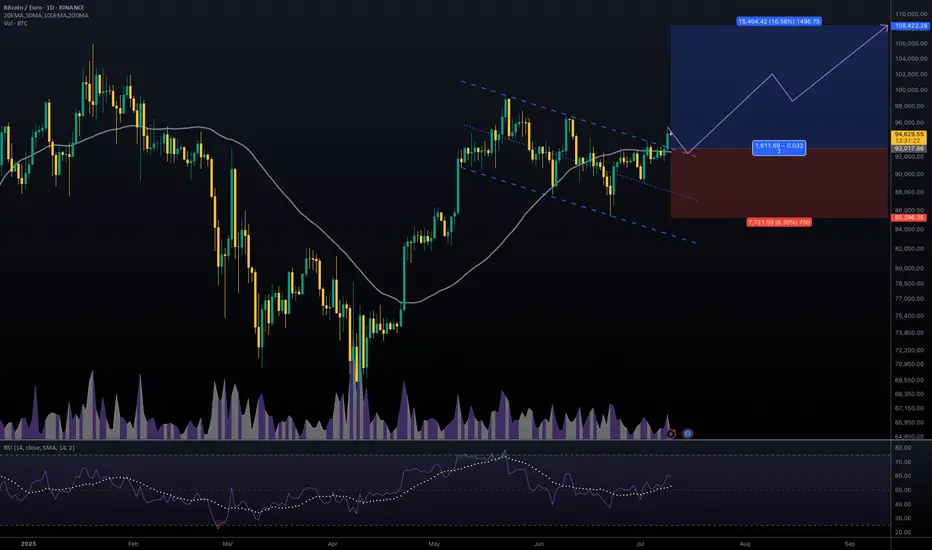
#BTCEUR #1D (Binance) Bull-flag breakout and retestBitcoin looks very good for bullish continuation after regaining 50MA support on daily, against the Euro.
⚡️⚡️ #BTC/EUR ⚡️⚡️
Exchanges: Binance
Signal Type: Regular (Long)
Amount: 12.0%
Entry Targets:
1) 93017.86
Take-Profit Targets:
1) 108422.28
Stop Targets:
1) 85296.36
Published By: @Zblaba
CRYPTOCAP:BTC BINANCE:BTCEUR #Bitcoin #PoW bitcoin.org
Risk/Reward= 1:2.0
Expected Profit= +16.6%
Possible Loss= -8.3%
Estimated Gaintime= 1-2 months
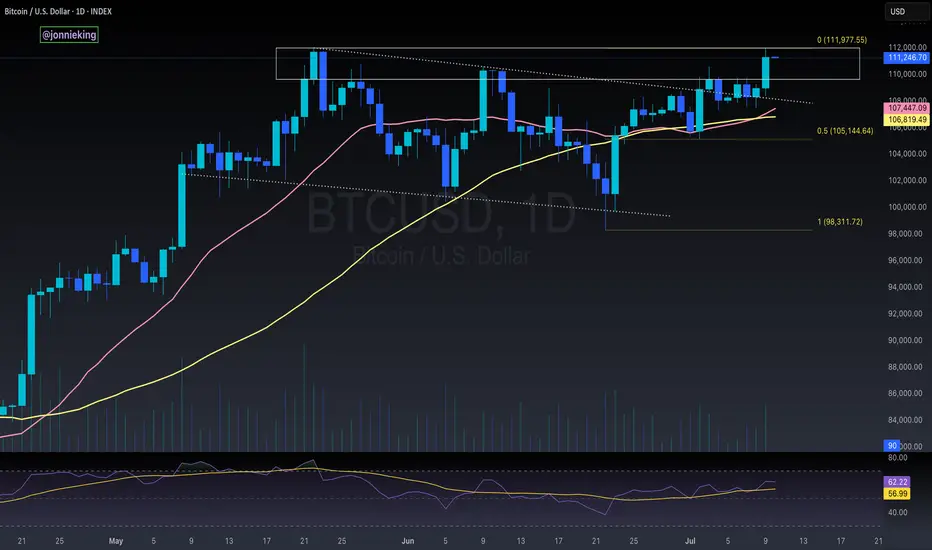
$BTC Tapping ATH - Is this REAL!?YUUUGE Daily Close today for CRYPTOCAP:BTC
Bullish cross on the 20/50MA.
Appears to have broken out of a bull flag.
Need PA to stay within this POI in order to confirm another leg up.
ETH Just Reached the Floor — This Is the Starting Line.This isn’t hopium, it’s structure.
Using my custom 4 EMA setup, you can see how ETH spent weeks coiling around the thickest dark purple line which I treat as the macro floor. ETH dropped below it briefly, retested it, and now we’re reclaiming that level again.
Whenever these EMAs start to compress and flatten, we usually get sideways chop, pressure build, breakout.
Zoom out and you’ll notice:
• We’re not extended.
• We’re not overbought.
• We’re not in price discovery.
We’re just getting back to the floor after compression.
If this is the top, it’s doing a great job pretending it’s still early.

Broadcom Ltd Quote | Chart & Forecast SummaryKey Indicators On Trade Set Up In General
1. Push Set Up
2. Range Set Up
3. Break & Retest Set Up
Notes On Session
# Broadcom Ltd Quote
- Double Formation
* (Diagonal Shift)) At 95.00 USD | Completed Survey
* (A+ SIgnal)) - *Swing High(Developing) | Subdivision 1
- Triple Formation
* (P1)) / (P2)) & (P3)) | Subdivision 2
* (TP1) = a / Long Consecutive Range
* (TP2) = b / Short Consecutive Pullback | Subdivision 3
* Daily Time Frame | Trend Settings Condition
- (Hypothesis On Entry Bias)) | Regular Settings
- Position On A 1.5RR
* Stop Loss At 242.00 USD
* Entry At 277.00 USD
* Take Profit At 330.00 USD
* (Uptrend Argument)) & No Pattern Confirmation
- Continuation Pattern | Not Valid
- Reversal Pattern | Not Valid
* Ongoing Entry & (Neutral Area))
Active Sessions On Relevant Range & Elemented Probabilities;
European-Session(Upwards) - East Coast-Session(Downwards) - Asian-Session(Ranging)
Conclusion | Trade Plan Execution & Risk Management On Demand;
Overall Consensus | Buy

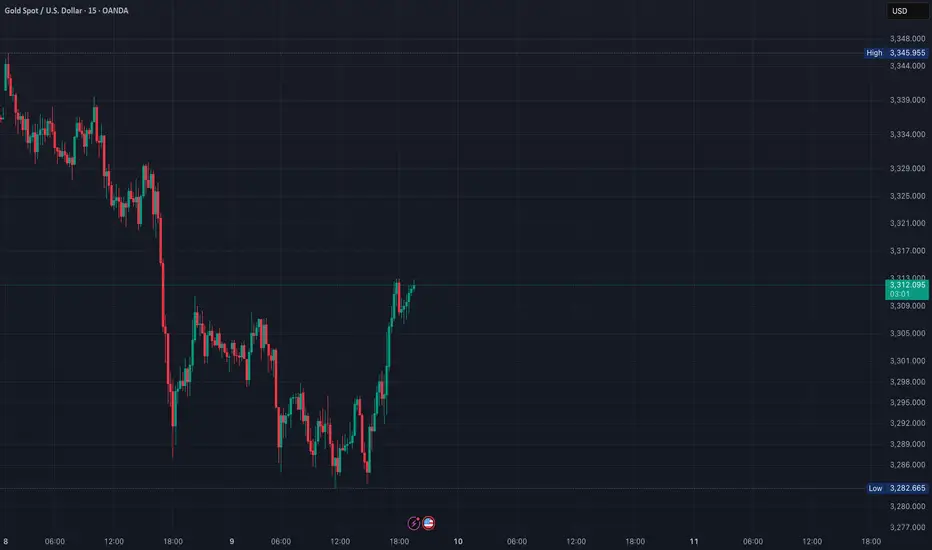
XAUUSD – Watching the 3318 Resistance for Potential Reversal
Currently monitoring Gold (XAUUSD) after a short-term bullish push toward the 3318 resistance zone. This area is significant due to:
Confluence with the upper Bollinger Band
Previous horizontal resistance level
Loss of momentum shown on MACD and other lower timeframes (15m–1h)
Price action is slowing as we approach the overbought territory. If price fails to break above 3318 and prints a clear reversal candlestick (e.g., pin bar or bearish engulfing) on the 1H chart, I’ll be looking for a short setup.
Disclaimer:This analysis reflects my personal view and is shared for educational purposes only. It does not constitute financial advice or a recommendation to enter any trade. Always do your own research and manage your risk accordingly. ⚠️
Cable One | CABO | Long at $130.82Cable One NYSE:CABO is a leading broadband communications provider under the Sparklight brand, offering high-speed internet, cable TV, and phone services across 24 U.S. states.
Book Value: $315.50.
Positive:
Strong liquidity: Quick ratio 1.47 (above industry avg ~1.0).
Undervalued vs. industry (1.91x).
Large customer base: ~1.1M customers, 2.8M data subscribers.
Stable revenue: Broadband focus in non-metropolitan markets.
Insiders buying over $1 million in share recently while also being awarded options.
Recent change in leadership.
Negatives:
Medium-high bankruptcy risk: Altman Z-Score 1.36 (below industry ~2.5).
High leverage: D/E 1.78 (above industry ~1.0).
Weak earnings: Negative margins, declining profitability.
Suspended dividend.
Classify this one as a risky investment, but it is very undervalued at this price and the upcoming decline in interest rates may have a very positive effect on the company's stock (at least short-term: 5 million float, 19% short interest). Regardless, not one to put your life savings into. From a technical analysis perspective, I foresee a potential drop between $115 and $120 in the near-term and rise from there. It all depends on the upcoming earnings, so label this one a "gamble" with high bankruptcy risk.
Regardless of bottom predictions, NYSE:CABO is in a personal buy zone at $130.82 for a swing trade.
Targets into 2027:
$190.00 (+45.2%)
$250.00 (+91.1%)

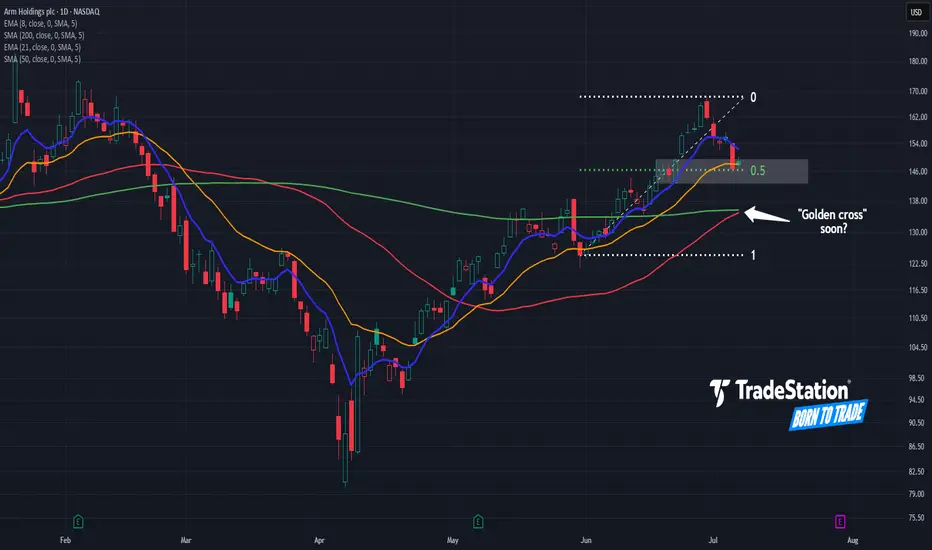
Arm Pulls BackArm Holdings rallied sharply last month, and now the AI chip stock has pulled back.
The first pattern on today’s chart is the advance from May 30 through June 30. ARM retraced half that move and is trying to bounce, which may confirm its upward direction.
Second, prices have retested their rising 21-day exponential moving average (EMA). The 8-day EMA is also above the 21-day EMA. Those signals may be consistent with short-term bullishness.
Third, the 50-day simple moving average (SMA) is nearing a potential “golden cross” above the 200-day SMA. That could reflect longer-term bullishness.
Finally, a four-session consolidation zone formed in late June between roughly $143 and $149. Will it now emerge as new support?
Check out TradingView's The Leap competition sponsored by TradeStation.
TradeStation has, for decades, advanced the trading industry, providing access to stocks, options and futures. If you're born to trade, we could be for you. See our Overview for more.
Past performance, whether actual or indicated by historical tests of strategies, is no guarantee of future performance or success. There is a possibility that you may sustain a loss equal to or greater than your entire investment regardless of which asset class you trade (equities, options or futures); therefore, you should not invest or risk money that you cannot afford to lose. Online trading is not suitable for all investors. View the document titled Characteristics and Risks of Standardized Options at www.TradeStation.com . Before trading any asset class, customers must read the relevant risk disclosure statements on www.TradeStation.com . System access and trade placement and execution may be delayed or fail due to market volatility and volume, quote delays, system and software errors, Internet traffic, outages and other factors.
Securities and futures trading is offered to self-directed customers by TradeStation Securities, Inc., a broker-dealer registered with the Securities and Exchange Commission and a futures commission merchant licensed with the Commodity Futures Trading Commission). TradeStation Securities is a member of the Financial Industry Regulatory Authority, the National Futures Association, and a number of exchanges.
TradeStation Securities, Inc. and TradeStation Technologies, Inc. are each wholly owned subsidiaries of TradeStation Group, Inc., both operating, and providing products and services, under the TradeStation brand and trademark. When applying for, or purchasing, accounts, subscriptions, products and services, it is important that you know which company you will be dealing with. Visit www.TradeStation.com for further important information explaining what this means.
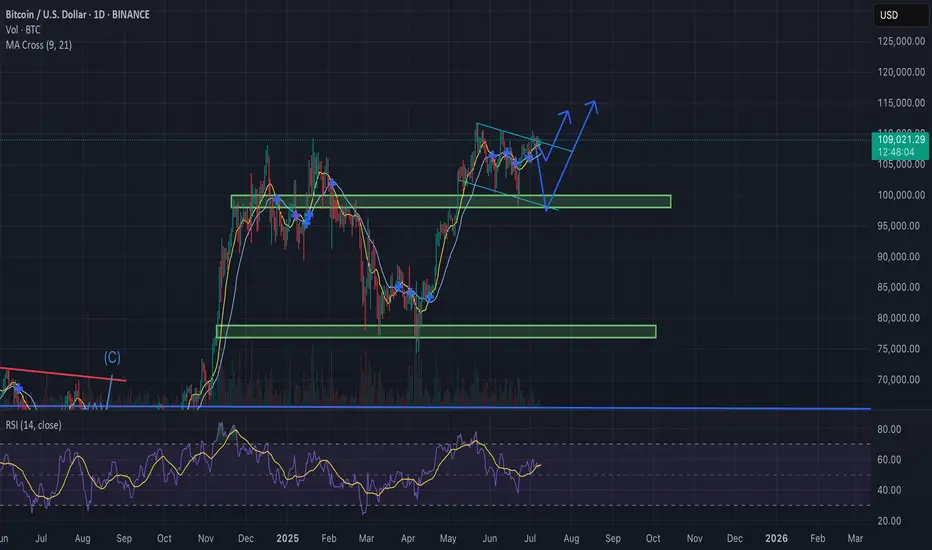
Bitcoin Update – Bullish Falling Wedge in Play?BTC/USD is currently trading near $108.8K, compressing within a falling wedge formation — historically a bullish continuation pattern, especially after a strong uptrend.
Why the Bias Remains Bullish:
Bullish MA Cross: Short-term MAs (9/21) are aligned for upside momentum.
Falling Wedge: Price compressing with lower highs and lows, coiling for a breakout.
RSI Strength: RSI (purple) remains elevated, supporting continued upside pressure.
Fundamental Catalysts:
Trump delays trade war announcements, reducing global uncertainty.
FOMC meeting in late July: Trump pushes for rate cuts, potentially bullish for risk assets like BTC.
If BTC breaks out above the wedge resistance with convincing volume:
Retest likely at ~$110K
Targets : $115K → $120K+
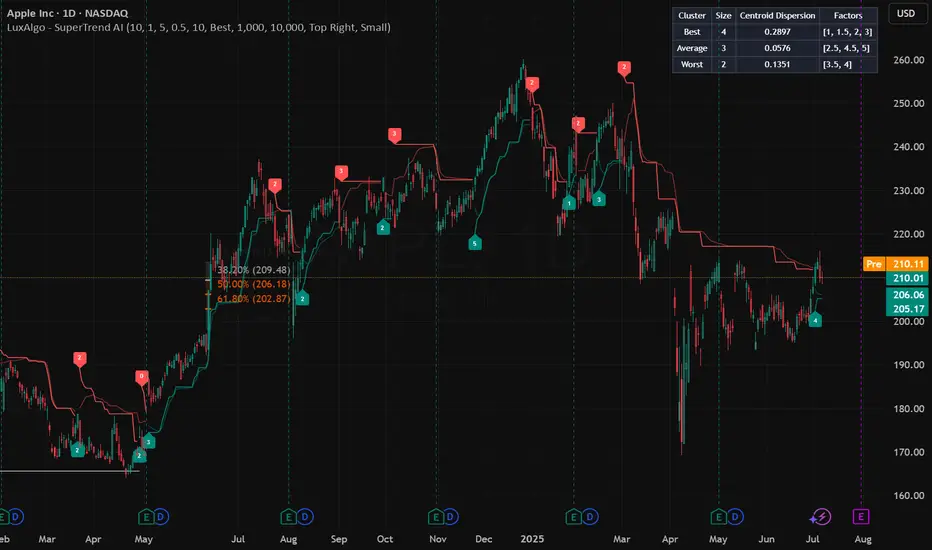
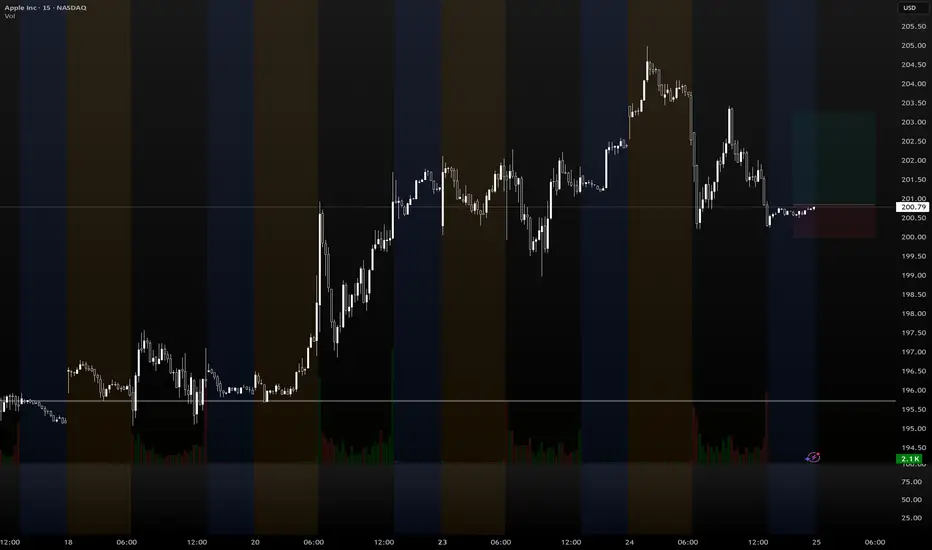
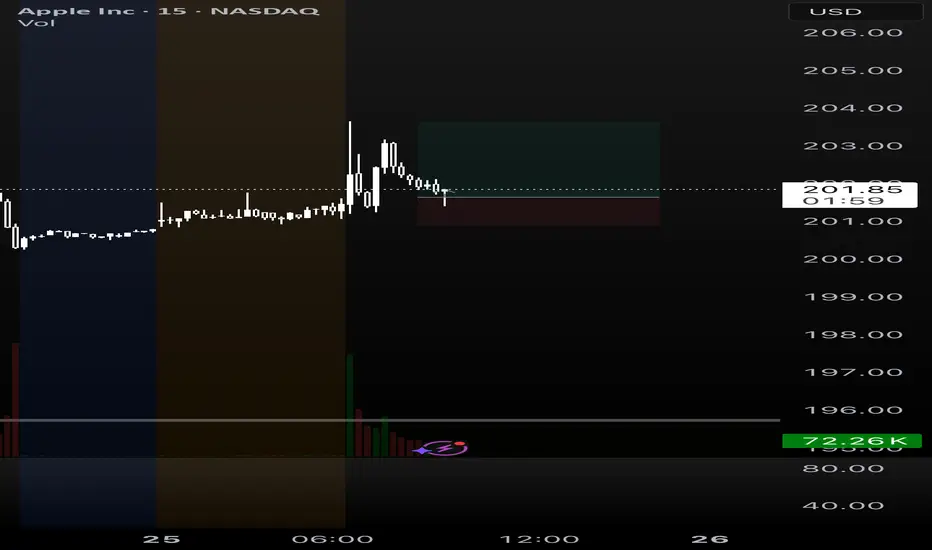
AAPL – Long Bias SetupWhy I’m Watching the Long Side:
✅ Clean Bounce from $190 Zone
That \$190–195 level has held multiple times since April. Last two dips got scooped with solid demand = solid base forming.
✅ Break of Recent Lower Highs
Stock finally pushed through prior resistance around $205–208. Structure shift. Possible start of a trend reversal.
✅ Buy Signal Triggered (Green "4")
Chart printed a buy signal near lows with follow-through = momentum may be shifting.
✅ Holding Above Short-Term Moving Level
Price is now holding above the short-term EMA (teal line), showing trend momentum flipping bullish.
✅ Vol Picking Up
Volume on the green days has increased, signaling interest from bigger players.
---
Trade Plan:
• Entry Zone: \$208–211
• TP1: $220 (near previous supply)
• TP2: $230 (gap fill zone)
• TP3: $250
• SL: Just below $204 = exit
---
⚠️ Caution:
Still under red resistance band ($220). Needs real strength to reclaim it.
Watch how price reacts there – could stall or squeeze.
📅 Next earnings 3 weeks out. Could build up into it.
---
💬 Setup looks constructive. Playing the reversal with tight risk. Not chasing, just reacting. Trade your plan.
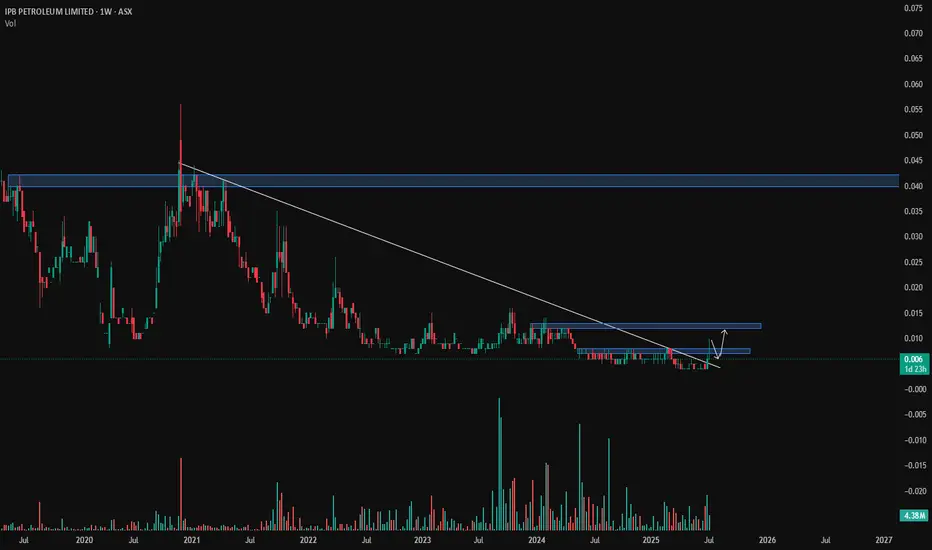
IPB - volume breakout LONGBroken out of 2 year trend on volume now looking to backtest area.
Awaiting news
Fartcoin to the moon again !!!!Fartcoin: Eyeing a Rebound to $1.20 USDT 🤑
🚀🚀🚀
Technical indicators suggest Fartcoin (FARTCOIN/USDT) could be poised for a significant price recovery, potentially reaching $1.20 USDT. After a period of consolidation between $0.95 and $1.05 USDT, signs of accumulation are emerging.
Key Technical Signals:
•RSI Reversal: The Relative Strength Index (RSI) is showing a bullish reversal, moving up from oversold conditions, indicating waning selling pressure.
•MACD Crossover: A potential bullish crossover on the MACD (Moving Average Convergence Divergence) suggests growing upward momentum.
•Volume Profile: Accumulation within the current range, with buying interest absorbing selling, points to a potential price floor.
•Fibonacci Target: The $1.20 USDT level aligns with a significant Fibonacci retracement point, making it a plausible target if upward momentum continues.A confirmed breakout from the current consolidation, supported by increased buying volume, would strengthen the case for a rally towards the $1.20 USDT mark !!!

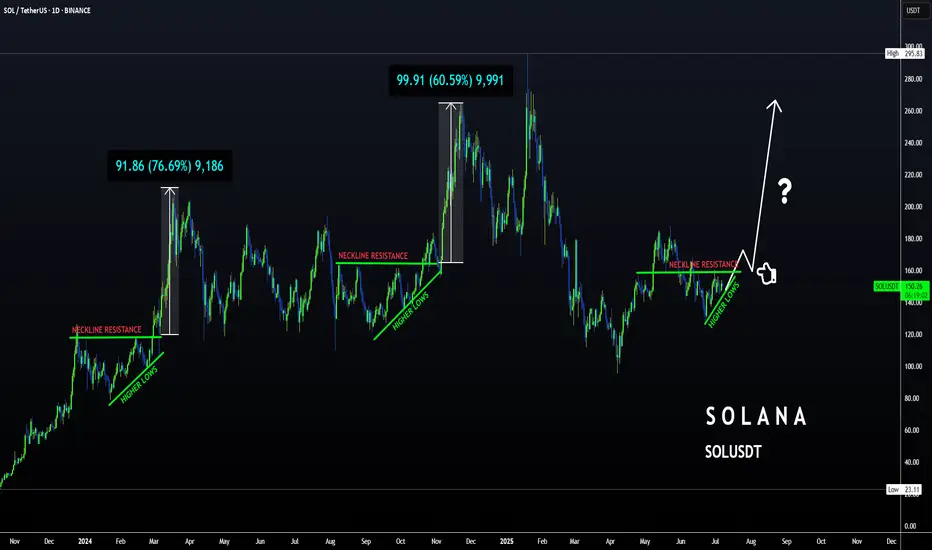
SOLANA Loves THIS Pattern | BULLISHSolana usually increases alongside ETH. Possible because its a big competitor.
We can see SOL follows ETH very closely, with the exception of dipping earlier than ETH by a week:
In the 4h, we see a push to breakout above the neckline resistance:
In the daily timeframe, SOL is just about to break out above the moving averages - which would be the final confirmation of a bullish impulse to come:
Could this pattern be the confirmation of the start of another big pump for SOL?
_______________________
BINANCE:SOLUSDT
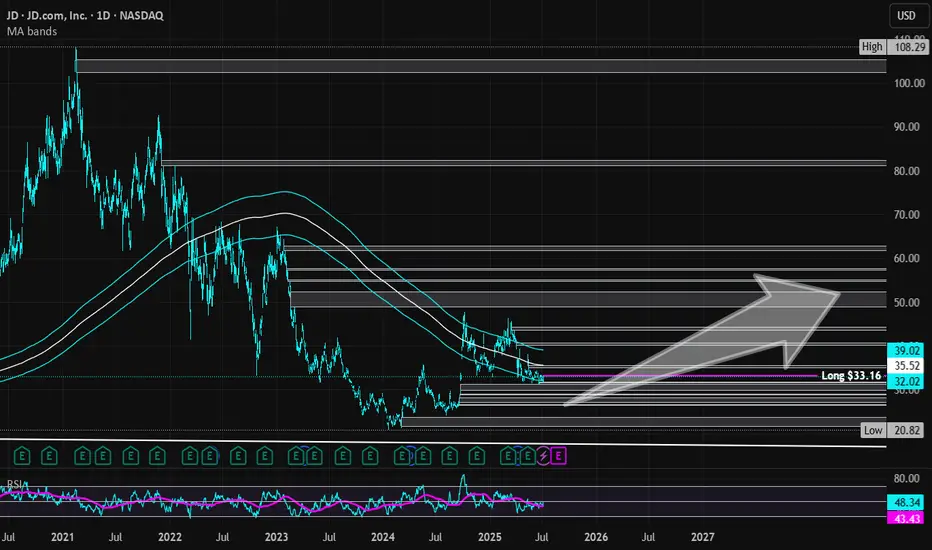
JD.cm | JD | Long at $33.16Like Amazon NASDAQ:AMZN and Alibaba NYSE:BABA , I suspect AI and robotics will enhance JD.com's NASDAQ:JD automation in warehousing, delivery, and retail. There is some risk here, like other Chinese stocks, that they could be delisted from the US market if trade/war tensions rise. But I just don't think that is likely (no matter the threats) due to the importance of worldwide trade and investment. I could be way wrong, though...
NASDAQ:JD has a current P/E of 8.1x and a forward P/E of 1.2x, which indicates strong earnings growth ahead. The company is healthy, with a debt-to-equity of 0.4x, Altmans Z Score of 2.6, and a Quick Ratio of .9 (could be better).
From a technical analysis perspective, the historical simple moving average (SMA) band is still in an overall downtrend but starting to level out (accumulation of share area). It is possible, however, that the price may drop into the $20s to close out the existing price gaps on the daily chart as tariff threats arise. But that area is another personal entry zone if fundamentals hold.
Thus, while it could be a bumpy ride and the risk is there for delisting, NASDAQ:JD is in a personal buy zone at $33.16 (with known risk of drop to the $20s in the near-term).
Targets into 2028:
$44.00 (+32.7%)
$52.00 (+56.8%)
O'Reilly Automotive Quote | Chart & Forecast SummaryKey Indicators On Trade Set Up In General
1. Push Set Up
2. Range Set Up
3. Break & Retest Set Up
Notes On Session
# Oreilly Automotive Quote
- Double Formation
* (A+ SIgnal)) At 65.00 USD | Completed Survey
* (Zone Feature)) At 99.00 USD | Subdivision 1
- Triple Formation
* (P1)) / (P2)) & (P3)) | Subdivision 2
* (TP1) = a / Long Consecutive Range
* (TP2) = b / Short Consecutive Pullback | Subdivision 3
* Daily Time Frame | Trend Settings Condition
- (Hypothesis On Entry Bias)) | Regular Settings
- Position On A 1.5RR
* Stop Loss At 85.00 USD
* Entry At 91.00 USD
* Take Profit At 100.00 USD
* (Uptrend Argument)) & No Pattern Confirmation
- Continuation Pattern | Not Valid
- Reversal Pattern | Not Valid
* Ongoing Entry & (Neutral Area))
Active Sessions On Relevant Range & Elemented Probabilities;
European-Session(Upwards) - East Coast-Session(Downwards) - Asian-Session(Ranging)
Conclusion | Trade Plan Execution & Risk Management On Demand;
Overall Consensus | Buy

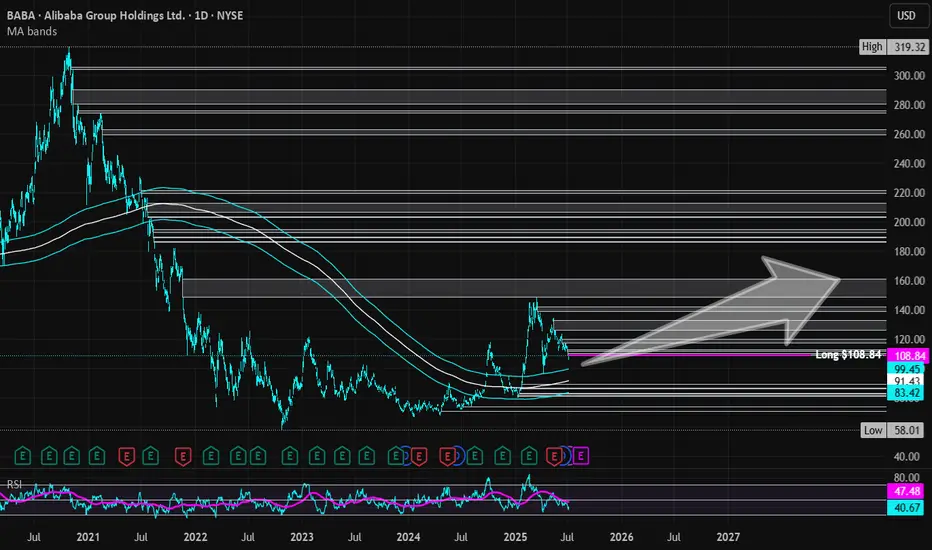
Alibaba | BABA | Long at $108.84Like Amazon, I suspect AI and robotics will enhance Alibaba's NYSE:BABA e-commerce, logistics, and cloud computing operations. There is some risk here, like other Chinese stocks, that they could be delisted from the US market if trade/war tensions rise. But I just don't think that is likely (no matter the threats) due to the importance of worldwide trade and investment. I could be way wrong, though...
NYSE:BABA has a current P/E of 14.2x and a forward P/E of 2x, which indicates strong earnings growth ahead. The company is very healthy, with a debt-to-equity of 0.2x, Altmans Z Score of 3.3, and a Quick Ratio of 1.5. If this were a US stock, investors would have piled in long ago at the current price.
From a technical analysis perspective, the historical simple moving average (SMA) band has started to reverse trend (now upward), indicating a high potential for continued (overall) price movement up. It is possible, however, that the price may reenter the SMA band in the near-term - the $80s aren't out of the question - as tariff threats arise. But that area is another personal entry zone if fundamentals hold.
Thus, while it could be a bumpy ride and the risk is there for delisting, NYSE:BABA is in a personal buy zone at $108.84 (with known risk of drop to the $80s in the near-term).
Targets into 2028:
$125.00 (+14.8%)
$160.00 (+47.0%)
(Daytrading) APPL going upH1 chart is respecting the uptrend.
Price has retested the 50 SMA on the H1 timeframe.
Price also touched the Ichimoku Cloud on H1.
→ Based on the risk-to-reward ratio, I’m expecting a Call position.
(Daytring) APPL quickly trade1. Premarket created a support line
2. Sma 200,50 is here
3. Price goes up in the moring just pull back to retest.
=> entry. Take profit whenever i feel good
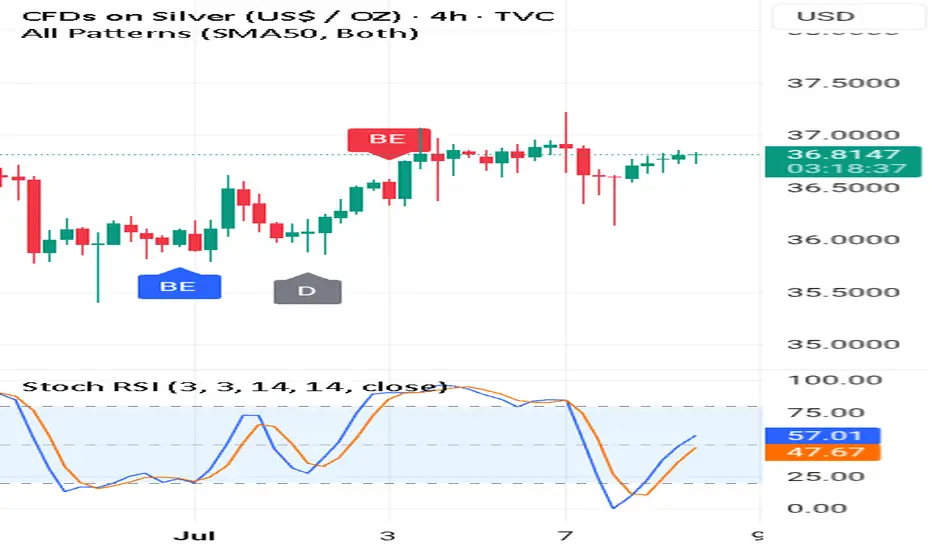
#1 Breaking News: Silver The Bullet Price Am listening to a podcast online this podcast mainly focusses on :
1-Gold
2-Silver
3-Mining Stocks
I always wondered what is it about these sectors that makes them "special"
Well I have recently mastered how to trade the double or triple tops.
And I can see why the experts in this commodity industry love double tops and triple tops.
Silver is hitting a top and has bounced from the neckline.
This is very important for you to understand.Also am using the 🚀 Rocket Booster strategy.
This strategy helps me pick the strength of the price trending.
It can also be used as a stop loss.This means you can use the moving averages for risk management.
Now I dont want you to worry too much about the technicals in this article but I just want us to have a conversation.
Sometimes technical analysis ca be boring but you will learn from conversations such as podcasts as well.
Rocket Boost This Content To Learn More.
Disclaimer ⚠️ Trading is risky please learn more about risk management and profit taking strategies and feel free to use a simulation trading account before you use real money.
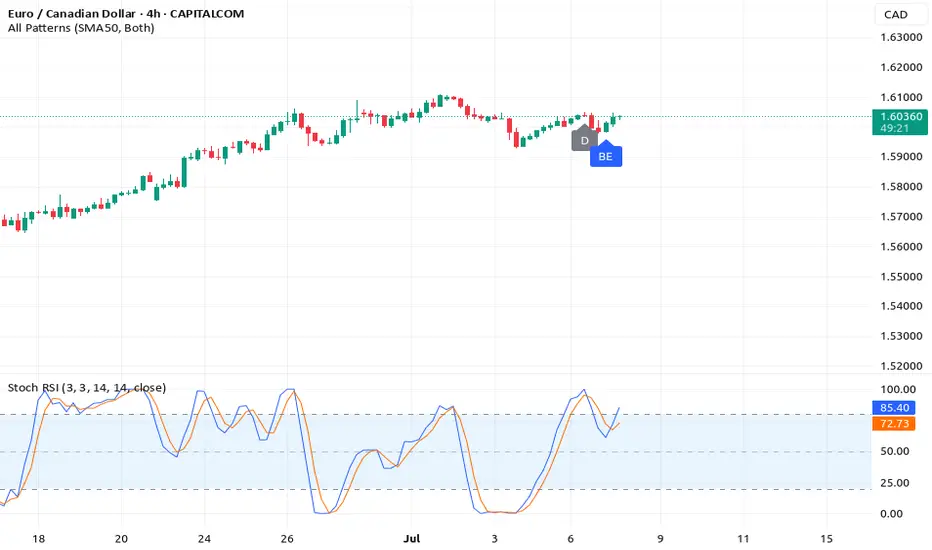
How a Triple Breakout and Daily Reversal Signal Point to a 25%..How a Triple Breakout and Daily Reversal Signal Point to a 25% Bullish Opportunity on EURCAD
Introduction
A strong bullish signal has formed on the EURCAD currency pair, capturing the attention of traders using a combination of
breakout confirmation and daily chart reversal signals. With a clear confluence across the 4-hour, daily, and weekly timeframes,
this technical setup offers a well-supported case for a buy position with an estimated 25% upside, targeting the 1.6100 level.
Whether traded intraday or held for a few days, the structure of this trade offers exceptional technical clarity and reward
potential.
✅ Key Technical Highlights
🔹 4-Hour Breakout Confirmation
The EURCAD pair has broken decisively above a recent range high on the 4-hour chart. This breakout occurred on increased volume,
which validates the move as more than a false spike. Price action shows bullish momentum building as candles close strongly above
the 50-period EMA, indicating short-term strength.
🔹 Weekly Chart Breakout Structure
Zooming out, the weekly chart reveals that EURCAD has cleanly broken through a key resistance zone, which had previously
capped price several times. The breakout aligns with the long-term trend shift, reinforcing the bullish narrative from a macro
perspective. Support now sits firmly below at previous resistance.
🔹 Daily Chart Reversal Signal
The daily chart offers the most critical insight: a strong reversal pattern, potentially a bullish engulfing or morning star, has
formed near the breakout area. This suggests a change in sentiment and invites buying pressure as traders react to the clear
reversal signal after a recent pullback. This reversal provides
timing precision for the trade.
🎯 Take-Profit and Target Projection
The price target is placed at 1.6100, which corresponds to:
A previous structural high
A Fibonacci extension zone
A round psychological number respected historically
The move to this level offers a potential 25% profit window, depending on entry price and lot size. This makes it attractive for both day traders and short-term swing traders.
🕒 Trade Duration Outlook
While this breakout setup is forming across the weekly and daily charts, the 4-hour entry makes it highly suitable for day trading.
Traders who prefer intraday execution can look for a pullback to breakout support for entry, followed by momentum confirmation
from RSI or volume spikes.
Swing traders may hold the position over several days, aiming for the full stretch to the 1.6100 target, while trailing stops to lock in profits.
⚠️ Risk and News Awareness
Traders must remain cautious of:
Oil price movements, which directly impact CAD strength
Economic data from the Eurozone or Canada (GDP, employment, interest rate updates)
Central bank speeches that may introduce volatility
Risk should be limited by placing stop-loss orders just below the 4-hour breakout level or the low of the daily reversal candle.
📌 Why This EURCAD Setup Matters
This setup is more than just a breakout—it combines:
Multi-timeframe confirmation
Momentum breakout on the 4-hour chart
Weekly structure validation
Daily chart reversal timing
These factors build a strong technical case for bullish continuation and provide high confidence for experienced and new traders alike.
Conclusion
EURCAD presents a powerful trading opportunity backed by clear technical signals across major timeframes. With a 25% upside and
precise entry timing from a daily reversal pattern, this is the kind of setup traders seek for both fast profits and well-structured
trades. Whether approached as a day trade or a swing play, the EURCAD breakout is one to watch.
Disclaimer: This content is for educational and informational purposes only. It does not constitute financial advice or a
recommendation to buy or sell any financial instrument. Use a simulation trading account before you trade with real money and learn risk management and profit taking strategies.
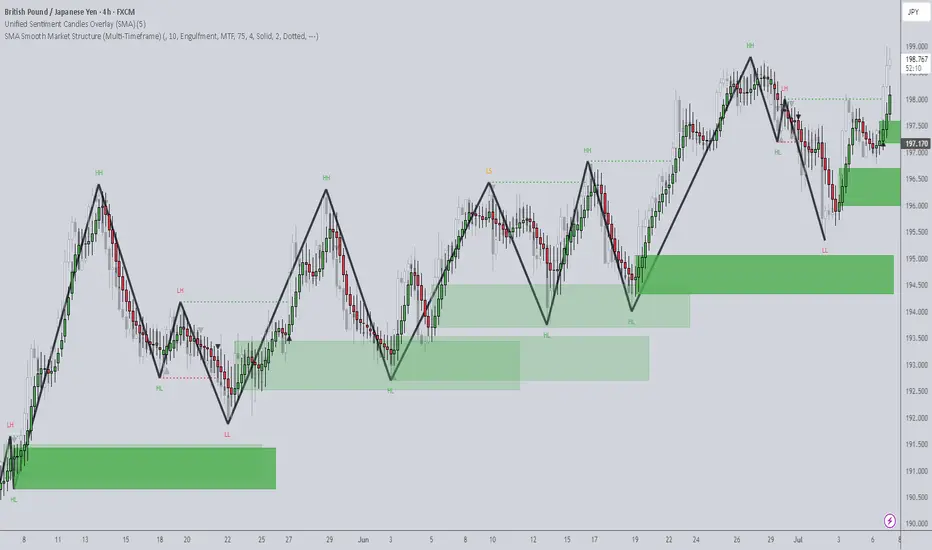
Timeframes: Why They’re Fundamentally Flawed (And What To Do)When analyzing price action, timeframes serve as a convenient lens through which traders attempt to make sense of the market. They help us categorize price movement — bullish , bearish , ranging , trending , and so on — within a structured framework. But here’s the reality: candlesticks themselves aren’t real . Much like clocks or calendars, they’re simply man-made constructs — tools we've invented to measure and scale something intangible: time . I know that might sound a bit abstract, but stay with me.
While traders commonly rely on standard timeframes like the Daily, 4H, 1H, 15M , etc., it’s important to recognize that price doesn’t conform to these rigid intervals. The market moves continuously, and the “spaces between” those timeframes — like a 27-minute or 3-hour chart — are just as real . These non-standard timeframes often offer better clarity depending on the speed and rhythm of the market at any given moment.
This begs the question: How do we keep up with this ever-shifting pace? Do we constantly toggle between similar timeframes to recalibrate our analysis? Do we measure volatility? Amplitude? Period length? There’s no clear consensus, which leads to inefficiency — and in trading, inefficiency costs.
In my view, the solution lies in blending multiple nearby timeframes into a single, adaptive framework . We need a representation of price action that adjusts automatically with the speed of the market. And the answer is surprisingly simple — literally . It’s called the Simple Moving Average (SMA) .
Think an SMA is just a line representing past highs, lows, or closes? It’s much more than that. When used creatively, the SMA becomes a dynamic lens that filters noise, reveals trend clarity, and smooths out irregularities in price behavior. Rather than relying on a single metric, we can combine multiple SMA variations — highs, lows, opens, closes — into one composite view of the market . This gives us a continuously adjusting snapshot of average price action.
Once we adopt this approach, everything starts to click.
• Engulfing patterns become more reliable
• Liquidity sweeps occur less frequently
• Supply and demand zones become more precise
• Market structure begins to make consistent sense
With SMA-based price action , our strategies don’t just become clearer — they become smarter .
Want to See It in Action?
If you’re interested in applying this concept to your own trading strategy, check out my TradingView profile: The_Forex_Steward . There, you’ll find the SMA Price Action indicator used in the examples shown, as well as tools that apply this methodology to:
• Supply and Demand
• Market Structure
• Market Balance Levels
• Velocity & Momentum
• And more to come!
If you found this idea helpful, be sure to follow the page. I’ll be releasing more exclusive indicators and trading concepts soon — so stay tuned!
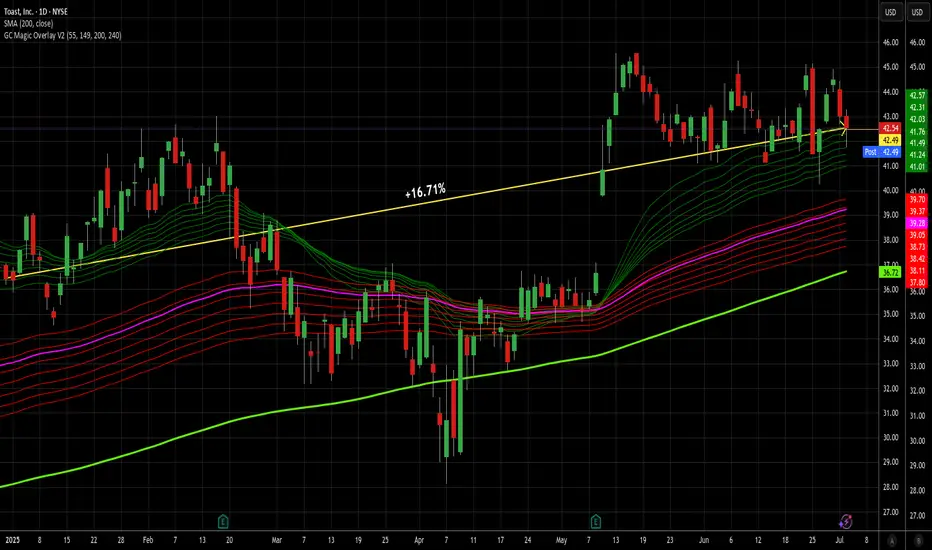
Hard to find a "butter" trade than TOST - long at 42.49This is my first actual trade of TOST. No particular bias against it, just haven't traded it before. But looking at its paper results, I wish I had been.
Since the first of the year, it has outperformed QQQ more than 2:1 on a B/H basis, which I always like to see, but don't always get in a trade. But its 16.71% return pales compared to what I'd have gotten had I been trading it. It generated 16 signals since Jan 1.
The summed (non-compounded) return on those trades, collectively, would have been +49.2% and that includes an open signal that is down almost 5% right now. The average trade lasted 9 days (increased by one trade that lasted 56 days). The average gain in those 9 days was 3.08% (.33%/day or almost 8x the avg market return and 5x that of the QQQ so far this year). The median results were even better: +2.64% in 4.5 days (+0.59% per day held).
As a bonus here, the stock is well above its 200d MA and is at the upper edge of the GC overlay bullish ribbon (also a good sign of strength). Like Monday's idea, none of this guarantees success, but it ups the odds.
While I don't do price targets, the 1 open buy signal was triggered 4.77% above where the stock is now, so I expect that to be eventually taken out. But, it's been 6+ weeks since that signal already, so how soon is anyone's guess. I will likely take my profits when my profit taking signal clicks, be that in one day or in weeks. Maybe I'll get lucky and it will take out that 4.77% level in a hurry. 5 of the 16 trades so far this year have eclipsed that level, so it's not out of the question. We shall see.
The win is all I seek. What the market gods deign to give me in terms of magnitude and time required is up to them. I will accept it.
As always - this is intended as "edutainment" and my perspective on what I am or would be doing, not a recommendation for you to buy or sell. Act accordingly and invest at your own risk. DYOR and only make investments that make good financial sense for you in your current situation.
$CLOV - Bullish Divergence 30MClover has had strong downtrend movement on no news. Bullish divergence is forming on the 30M. If divergence confirms possible test of 50 SMA and consolidation before we see the next the next trend. Retail trader discovery of Counter Part Health's partnerships with Humana through subdomains could put a potential bottom and reverse the trend prior to earning. But will retail be enough to reverse course? Institutions want to see $2.20, $1.91
