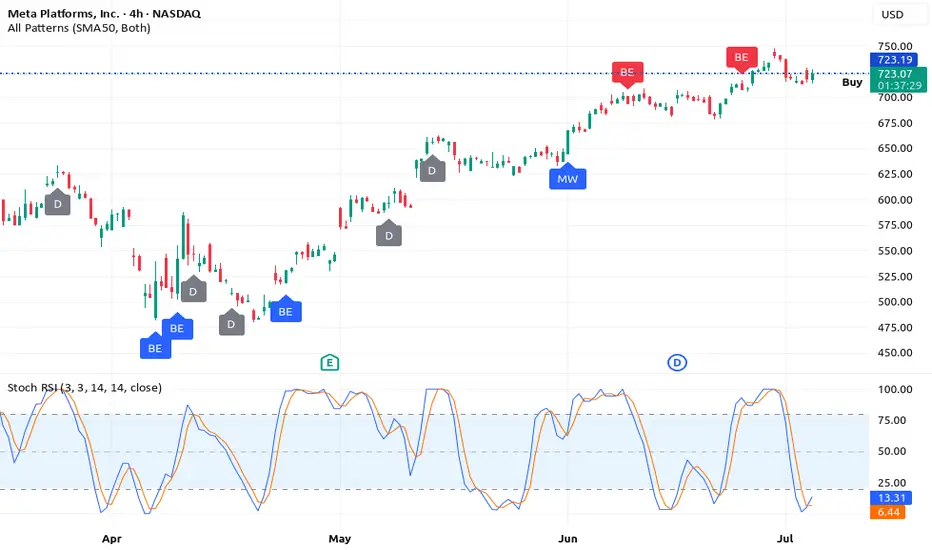
3 Reasons the Meta (META) Double Top Is a Buy Signal3 Reasons the Meta (META) Double Top Is a Buy Signal – Rocket Booster Strategy Explained
Meta Platforms Inc. (META) recently printed what looks like a double top pattern on the 4-hour chart.
Many traders are expecting a reversal. But from my perspective, this setup could actually be a trap for early short-sellers. Here's why.
The overall trend remains bullish. Price is still trading above the 50 EMA and the 200 EMA, which confirms that the long-term and
short-term momentum is still upward. When a double top appears in a strong uptrend but fails to break the neckline, it often
becomes a fakeout. Instead of reversing, the price consolidates, shakes out weak hands, and then breaks higher. This is where my
strategy comes in.
I call it the Rocket Booster Strategy. It works like this:
1. First, the price must be above both the 50 EMA and 200 EMA. This confirms we’re in an active uptrend.
2. Then, if a bearish pattern like a double top appears but the neckline does not break, that’s a sign of a trap.
3. We wait for price to bounce near the neckline or break above the recent top. That’s the ignition point – the rocket is ready to fire.
In this Meta setup, if price holds above the neckline or quickly reclaims the recent high, it becomes a strong buying opportunity.
The pattern fakeout acts like fuel, giving bulls the momentum to push price even higher.
This is a high-probability setup because many traders get caught
in the trap, expecting a sell-off, and their stop-losses become buy fuel for the next rally.
Trade idea:
Entry: near neckline bounce or breakout above second top
Stop loss: below the neckline or under the 50 EMA
Target: new highs and above
Final thoughts:
Don’t fall for surface-level patterns. In strong uptrends, failed double tops are often just launchpads. The Rocket Booster
Strategy helps us spot the fakeout and ride the breakout.
How 3 Simple Conditions Turn a Double Top Into a Buy Signal
Most traders see a double top and expect a reversal. But in strong uptrends, this pattern can fail — and when it does, it often sets up
a high-probability buying opportunity. Traders who use the Rocket Booster Strategy understand how to spot these traps and trade them in the direction of the trend.
Here’s how the strategy works — and why some double tops become launchpads, not ceilings.
1. Price Above Both 50 EMA and 200 EMA
When price remains above the 50 EMA and 200 EMA, it confirms strong bullish momentum in both the short and long term. In
these conditions, many reversal patterns like the double top often fail. Instead of selling off, price consolidates and continues higher.
Traders using this strategy only look for buy setups when both EMAs are pointing up and price stays above them.
2. Bear Trap Setup
A double top often attracts sellers. These traders place their stop-losses just above the highs. If price fails to break the neckline and
instead rallies above the top, those stop-losses are triggered, creating a surge in buy orders. This becomes a trap — not a
reversal — and the breakout can be fast and aggressive. The Rocket Booster Strategy takes advantage of this liquidity burst.
3. Entry After Confirmation, Not Assumption
Instead of shorting the pattern, traders using the Rocket Booster Strategy wait for one of two bullish confirmations:
A bounce off the neckline without breaking below it
A breakout above the second top after the trap is set
At that point, the trend is considered intact, and momentum is ready to continue. The "rocket" is refueled, and the strategy shifts
into entry mode.
Trade Setup Example:
Entry: Near neckline bounce or breakout above second top
Stop Loss: Below neckline or under the 50 EMA
Target: New highs and above the pattern top
Final Thoughts
In strong trends, failed double tops are not warning signs — they’re opportunities. The Rocket Booster Strategy filters out weak signals by requiring clear alignment:
price above both EMAs, pattern failure, and bullish confirmation. When these conditions align, a pattern that looks bearish on the surface becomes a fuel source for the next breakout.
Disclaimer: This article is for educational purposes only and not financial advice. Always do your own research.
Moving Averages
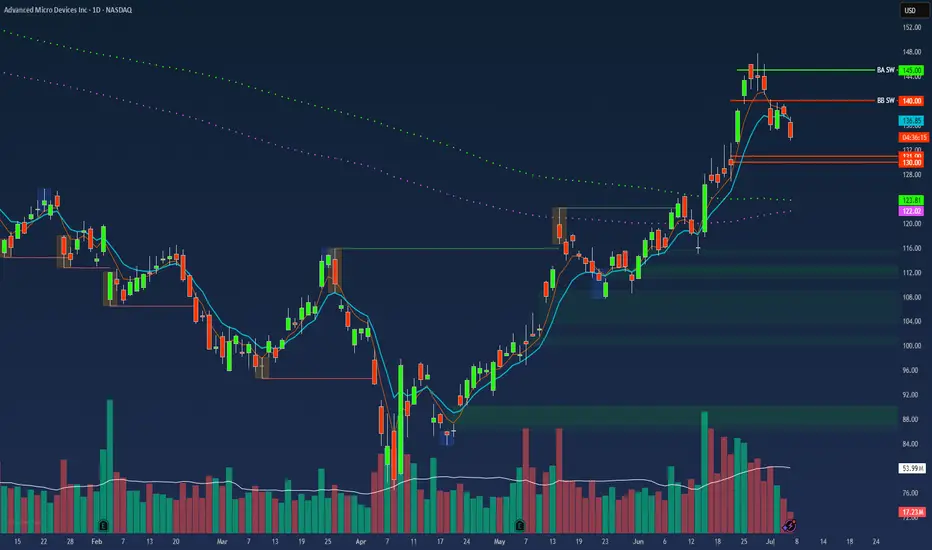
$AMD Swing Trade – Put Debit Spread Setup🔻 NASDAQ:AMD Swing Trade – Put Debit Spread Setup (Jul 18 Exp)
📅 Trade Opened: July 3, 2025
🛠 Strategy: Buy to Open (BTO) Put Debit Spread
📉 Strikes: $31 / $30 (Jul 18 Expiration)
💵 Cost (Premium Paid): $0.21
🎯 Trade Thesis
This setup aims to capture short-term downside in NASDAQ:AMD via a low-cost, defined-risk spread. The trade fits within my broader portfolio of OTM spreads under $0.25.
Key Drivers:
🔻 Semi sector under pressure – NASDAQ:AMD showing relative weakness.
📉 Breakdown below key support near $31 and rejection at VWAP.
🧾 Weak momentum – MACD trending down, RSI near 44.
🔄 Trade enters into earnings season volatility.
📊 Technical Setup (Daily)
EMA(4) < EMA(8) < EMA(15): Bearish structure fully intact.
VWAP: Price rejected from 30-day VWAP zone.
MACD/RSI: Momentum still fading, no signs of bullish divergence.
⏳ Strategy Notes
Max loss: $0.21
Max gain: $0.79
Risk/reward structured for a drop into or below $30
Expiration: July 18
🧠 Journal Note
Most of my trades are swing-based using OTM debit spreads with tight risk control. No same-day entries — setups must have defined technical compression and short-term catalysts.
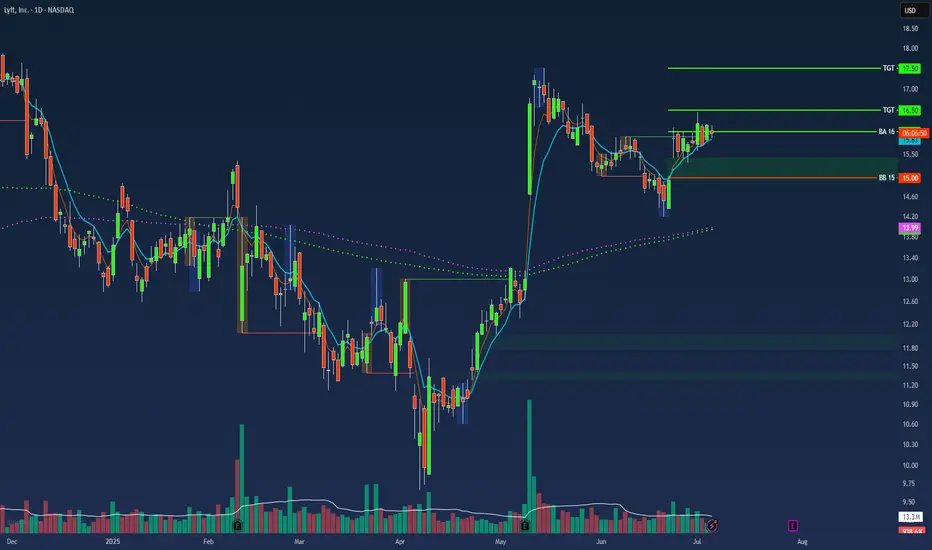
$LYFT Swing Trade – Low-Cost Call Debit Spread Setup🚗 NASDAQ:LYFT Swing Trade – Low-Cost Call Debit Spread Setup (Jul 18 Exp)
📅 Trade Opened: July 3, 2025, 2:53 PM
🛠 Strategy: Buy to Open (BTO) Call Debit Spread
📈 Strikes: $16.5 / $17.5 (Jul 18 Expiration)
💵 Cost (Premium Paid): $0.25
🎯 Trade Thesis
This swing trade targets a short-term bullish move in NASDAQ:LYFT based on improving fundamentals and favorable technical setup. The structure uses a low-cost OTM call spread to define risk and limit exposure while capturing directional potential.
Catalysts supporting the move:
🚙 Autonomous vehicle rollout beginning this summer (Atlanta) and expanding to Dallas (2026) via Mobileye partnership.
🗳 Activist investor Engine Capital pushing for governance changes and strategic alternatives.
💵 Gross bookings at record levels, with net income and free cash flow turning positive.
📈 Analyst upgrade from TD Cowen with a $21 target (+30% upside from entry).
📊 Technical Setup (Daily Chart)
📉 EMA(4) < EMA(8) < EMA(15): Bearish alignment beginning to flatten – potential compression signal.
⚖ VWAP (30‑day): Price consolidating near long-term VWAP – watching for reclaim.
🔄 MACD: Bullish crossover emerging.
📉 RSI: ~36 – approaching oversold territory, setting up possible reversal.
⏳ Strategy Notes
Position type: OTM vertical call debit spread.
Risk defined: Max loss = $0.25 per contract.
Max gain: $0.75 if LYFT closes at or above $17.5 by expiration.
Timeframe: 2-week swing through July 18, ahead of Q2 earnings (~Aug 6).
🧠 Journal Note
This position aligns with a broader strategy focused on OTM spreads priced under $0.25, using technical compressions and fundamental tailwinds. Trade was opened not on an entry signal day - this avoids front-running momentum shifts.
NOV Inc. Stock Quote | Chart & Forecast SummaryKey Indicators On Trade Set Up In General
1. Push Set Up
2. Range Set Up
3. Break & Retest Set Up
Notes On Session
# NOV Inc. Stock Quote
- Double Formation
* (Downtrend Argument)) + Diagonal Shift At 20.00 USD | Completed Survey
* (EMA Settings)) - *100 EMA
- Lower Band Feature | Subdivision 1
- Triple Formation
* (P1)) / (P2)) & (P3)) | Subdivision 2
* (TP1) = a / Long Consecutive Range
* (TP2) = b / Short Consecutive Pullback | Subdivision 3
* Daily Time Frame | Trend Settings Condition
- (Hypothesis On Entry Bias)) | Regular Settings
- Position On A 1.5RR
* Stop Loss At 14.00 USD
* Entry At 13.00 USD
* Take Profit At 11.00 USD
* (Downtrend Argument)) & No Pattern Confirmation
- Continuation Pattern | Not Valid
- Reversal Pattern | Not Valid
* Ongoing Entry & (Neutral Area))
Active Sessions On Relevant Range & Elemented Probabilities;
European-Session(Upwards) - East Coast-Session(Downwards) - Asian-Session(Ranging)
Conclusion | Trade Plan Execution & Risk Management On Demand;
Overall Consensus | Sell

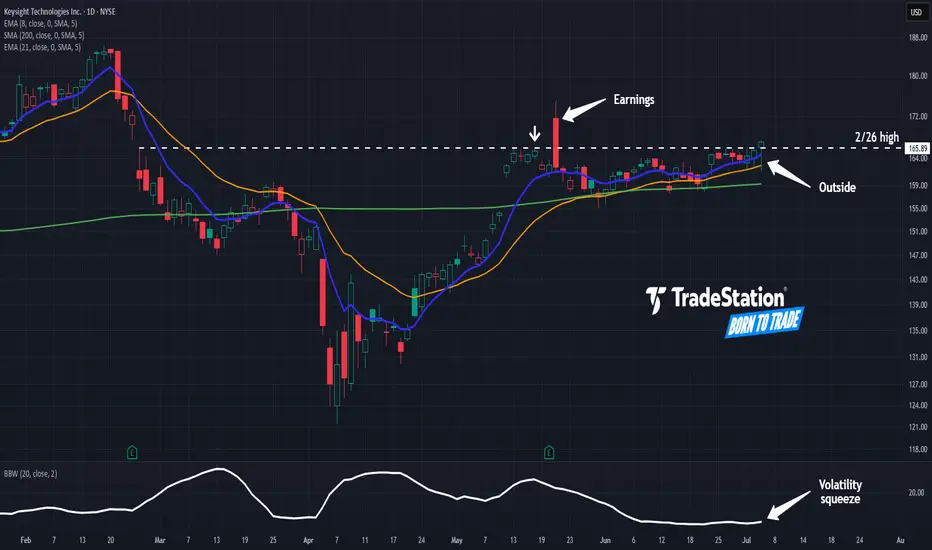
Keysight May Be Attempting a BreakoutKeysight Technologies has been stuck in a range, but some traders may think a breakout is coming.
The first pattern on today’s chart is the $165.89 level. It was the intraday high on February 26 as the broader market began a slide to the downside. The technology stock stalled near the same level in late May, even after a strong quarterly report.
KEYS ended above it on Thursday, July 3. It was the highest weekly close since February. (The stock also formed a bullish outside candle.)
Bollinger Band Width narrowed during the period of limited movement. Could that price compression give way to expansion?
Next, the 8-day exponential moving average (EMA) is above the 21-day EMA. Prices have also found support above the 200-day simple moving average, which is gently rising. Those signals may reflect bullishness in the short- and long-term periods.
Finally, KEYS noted increased demand for its network-testing equipment as data centers grow. Could investors come to view it as an overlooked AI play?
Check out TradingView's The Leap competition sponsored by TradeStation.
TradeStation has, for decades, advanced the trading industry, providing access to stocks, options and futures. If you're born to trade, we could be for you. See our Overview for more.
Past performance, whether actual or indicated by historical tests of strategies, is no guarantee of future performance or success. There is a possibility that you may sustain a loss equal to or greater than your entire investment regardless of which asset class you trade (equities, options or futures); therefore, you should not invest or risk money that you cannot afford to lose. Online trading is not suitable for all investors. View the document titled Characteristics and Risks of Standardized Options at www.TradeStation.com . Before trading any asset class, customers must read the relevant risk disclosure statements on www.TradeStation.com . System access and trade placement and execution may be delayed or fail due to market volatility and volume, quote delays, system and software errors, Internet traffic, outages and other factors.
Securities and futures trading is offered to self-directed customers by TradeStation Securities, Inc., a broker-dealer registered with the Securities and Exchange Commission and a futures commission merchant licensed with the Commodity Futures Trading Commission). TradeStation Securities is a member of the Financial Industry Regulatory Authority, the National Futures Association, and a number of exchanges.
TradeStation Securities, Inc. and TradeStation Technologies, Inc. are each wholly owned subsidiaries of TradeStation Group, Inc., both operating, and providing products and services, under the TradeStation brand and trademark. When applying for, or purchasing, accounts, subscriptions, products and services, it is important that you know which company you will be dealing with. Visit www.TradeStation.com for further important information explaining what this means.
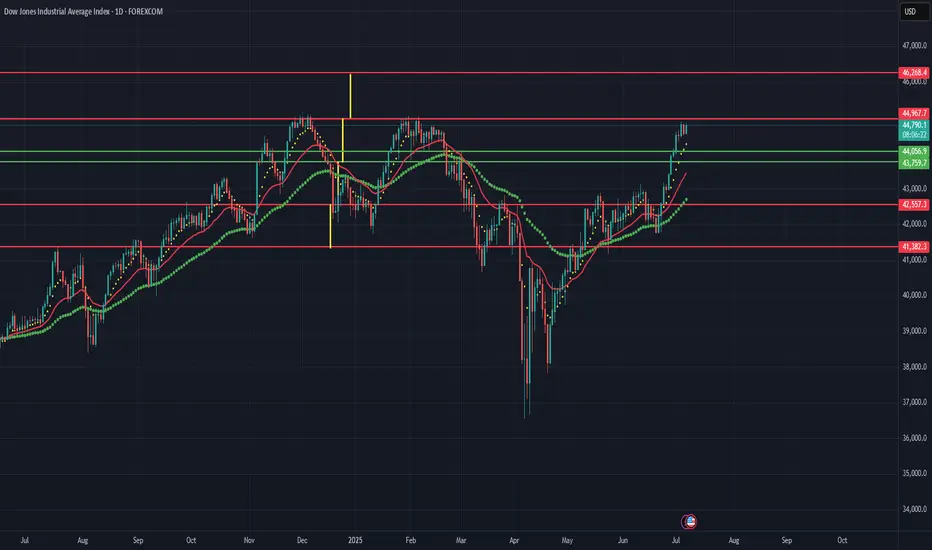
US30 // There is a strong resistance point at 44.967 level. In case you consider short trading at the level I mentioned, our take profit point is 8 ema.
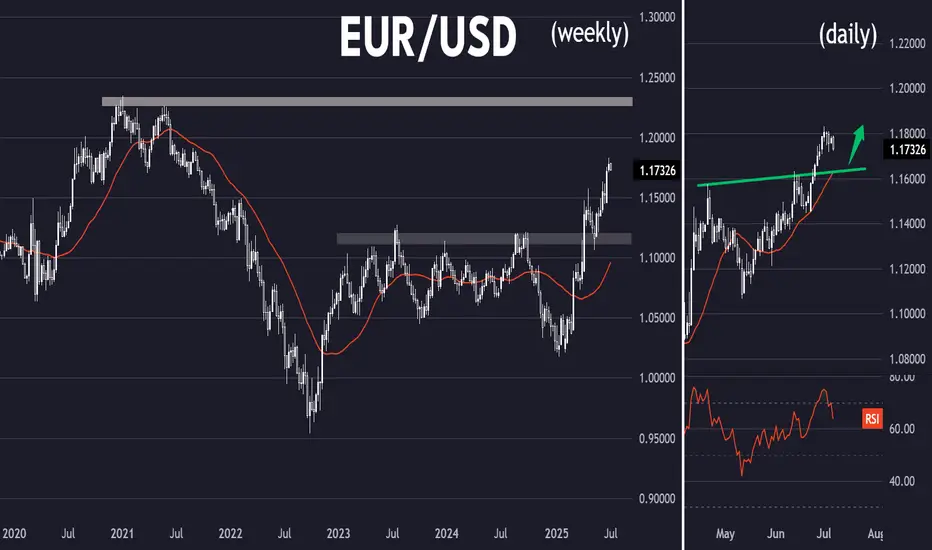
Where the coffee is strong (EUR/USD)Setup
EUR/USD is in a strong uptrend and recently broke above multi-year resistance just under 1.16. The pair looks to be targeting long term resistance at 1.23.
Signal
RSI is dropping back from overbought territory on the daily chart, offering a possible dip-buying opportunity above resistance-turned-support at 1.16.
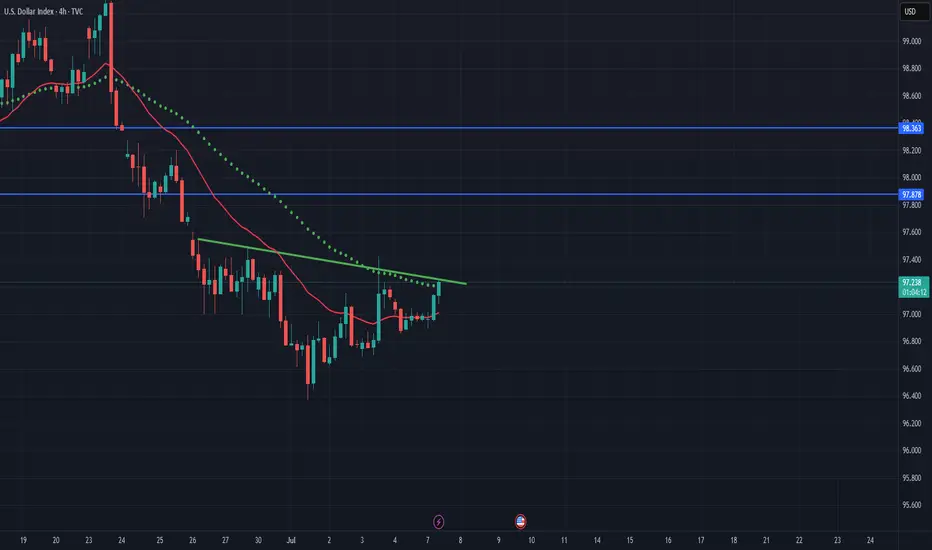
DXY // Inverted head and shoulders formationIf we can see closings above the green line, the first target exit is 97.878, which corresponds to Fibo 1.414, and the main target is 98.363.
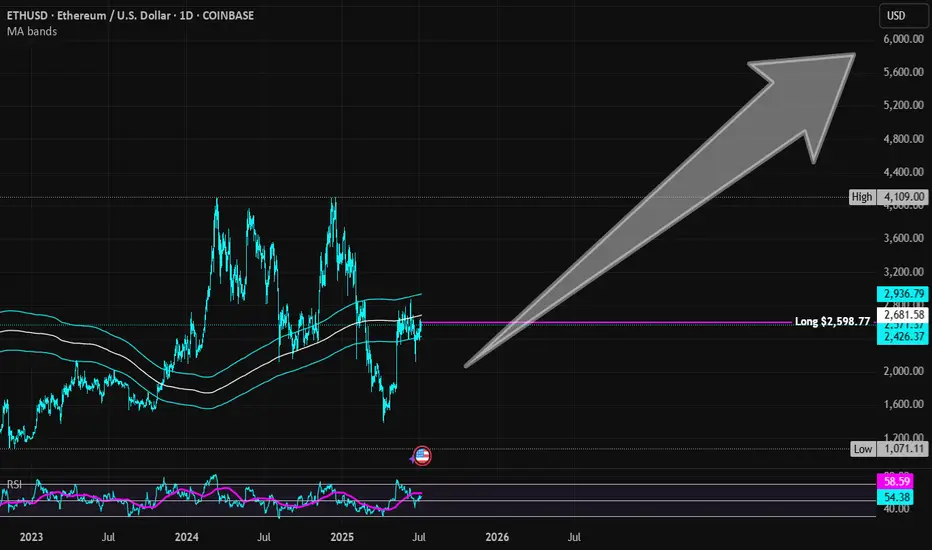
Ethereum | ETH | Long at $2,598.77Currently within my historical simple moving average area and consolidating. I suspect a move up is imminent, but 100% speculation. Crypto "bros" know more than I do.
Targets into 2028:
$4,000 (+53.9%)
$5,500 (+111.6%)
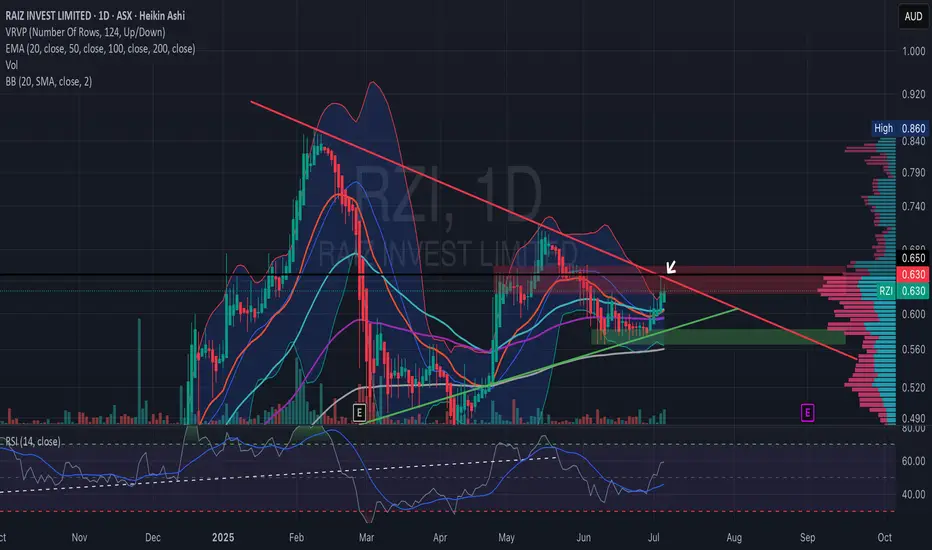
RZI Bullish BreakoutThe price is currently testing resistance around 0.63, after rising from 0.575. The volume profile indicates high activity around 0.58-0.62, showing strong interest.
The EMAs reflect a bullish shift, with the 20 EMA approaching a crossover above the 50 EMA.
After a period of squeeze inside the triangle, the bands are beginning to open.
The RSI is neutral to bullish, trending upward around 50. Overall, the chart suggests a potential breakout. No clear over-bought yet, there is room to run if bulls stay in control.
Key Scenarios
Bullish Breakout: A daily close above the red trendline + A$0.63–0.65 resistance zone would confirm.
First target: A$0.70–0.72 (next volume-profile “valley” and previous swing highs)
Secondary: A$0.80+ (upper Bollinger band confluence from the Feb top)
False Break / Rejection:
Look for a swift pullback into the green ascending line (~A$0.60) or the broader support box around A$0.57–0.58.
Watch EMAs for signs of rolling over (20 EMA crossing back below 50 EMA would turn neutral-to-bearish).
BTC/USD (4H): Classic FRL short setup unfoldingTrading = capital management under uncertainty.
Bitcoin is trading inside a clear descending channel on H4.
Price recently tested the upper boundary of this channel while forming a bearish divergence on MACD. This divergence hints at a weakening upward phase, signaling a possible phase shift according to Fractal Reversal Law (FRL).
Why is this a classic FRL setup?
✅ Phase Identification:
The prior local upward phase within the descending channel is weakening.
✅ Reversal Pattern:
A double top / wedge has formed at the upper boundary with a bearish divergence.
✅ Neckline:
The neckline aligns with the MA100 cluster on H4, now acting as a horizontal rubicon.
✅ Confirmation:
We wait for a full candle close below the neckline on H4 to confirm the phase shift.
✅ Targets:
– TP1: Mid-channel grey zone.
– TP2: Lower boundary of the channel.
✅ Stop:
Above the recent highs or channel top, depending on your risk management.
Plan:
Wait for H4 close below neckline → enter short.
Use the channel structure for target planning.
Manage risk with a tight, structure-based stop.
This is a clean FRL textbook scenario:
Phase → Pattern → Neckline → Confirmation → Target.
It aligns with the larger market structure, using the combination of price action, divergence, and structure clarity to guide your trade decisions.
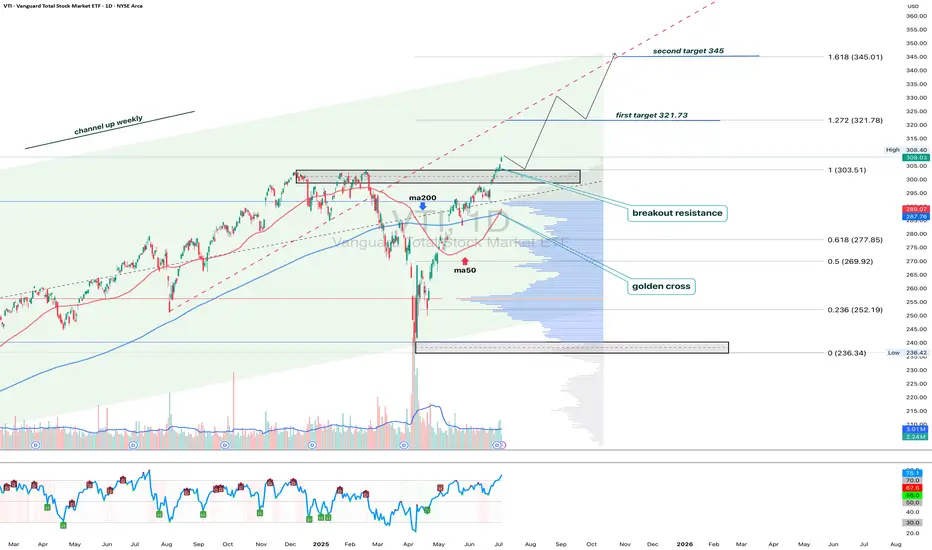
VTI 1D: breakout on the daily within a long-term weekly uptrend On the daily chart, VTI (Vanguard Total Stock Market ETF) has broken through the key $303.5 resistance level with strong volume. This breakout occurs within a larger weekly uptrend channel, highlighting a continuation of the long-term bullish structure.
Volume profile shows a clear path ahead: $321.7 (1.272 Fibo) and $345 (1.618 Fibo). The golden cross (MA50 crossing MA200 from below) further supports the bullish case.
Fundamentally, VTI represents the entire U.S. equity market - large to small caps - and benefits from economic resilience, declining inflation, and passive inflows. It’s a logical macro play for trend continuation.
Tactical plan:
— Entry by market or after retest $303.5
— TP1: $321.7
— TP2: $345
— Invalidation below $300
The whole market breaking out? That’s not noise — it’s the signal.
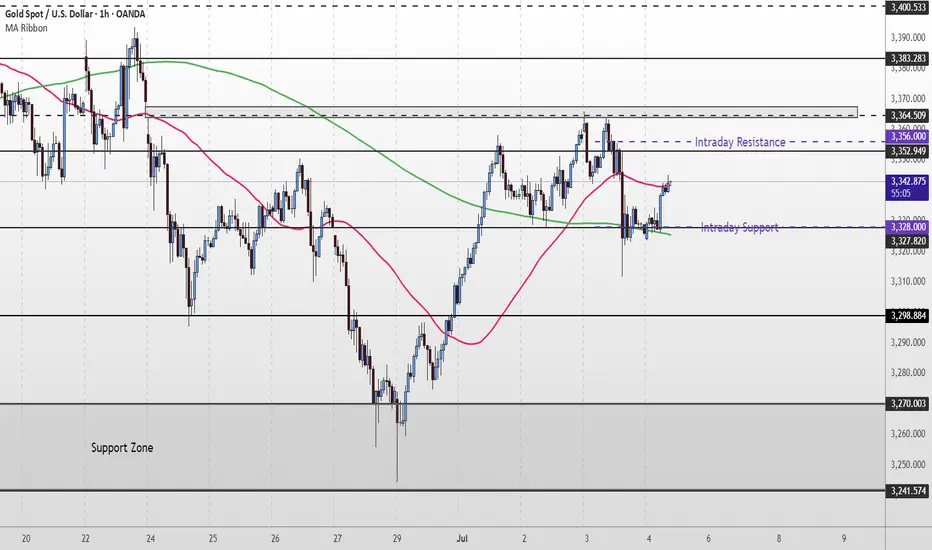
Gold Short Term OutlookIn yesterday’s analysis, we highlighted that the $3,327–$3,328 support zone needed to hold for bulls to maintain momentum. Price respected that level, bouncing off intraday support and is now attempting a recovery.
Currently, the 50MA is acting as dynamic resistance, and we need to see a clean break above the $3,352–$3,356 resistance zone for bulls to challenge higher levels.
However, if price fails to break above this resistance cluster, we may see a pullback toward the $3,327 support once again. A break below that would likely expose price to a deeper retracement toward $3,298.
📌 Key Resistance:
‣ $3,352
‣ $3,356
‣ $3,364
‣ $3,383
📌 Key Support:
‣ $3,328
‣ $3,298
‣ $3,270
🧠 Fundamental Focus:
With U.S. markets partially closed today, expect low liquidity and increased volatility.
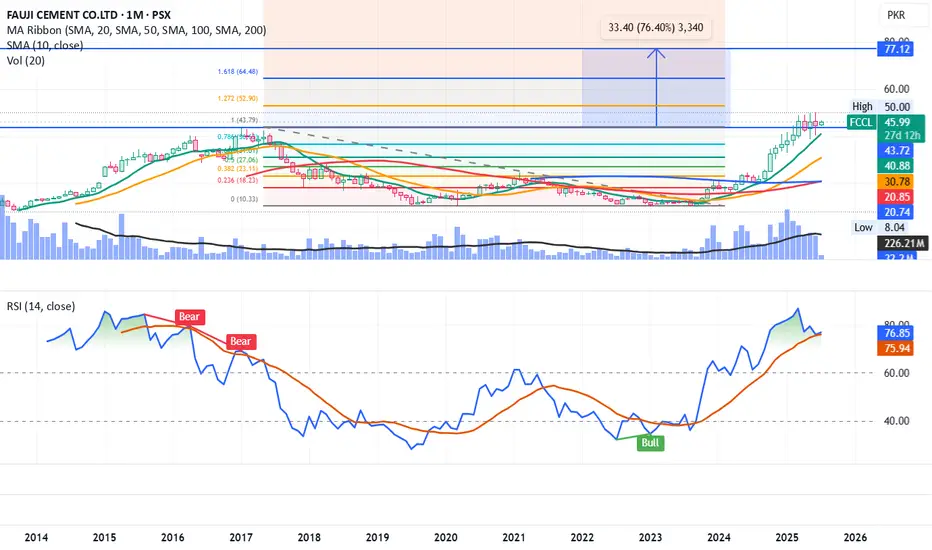
FCCL LongGolden cross on weekly time frame. RSI has cooled down and is ready to take off again.
Possible target is 77.
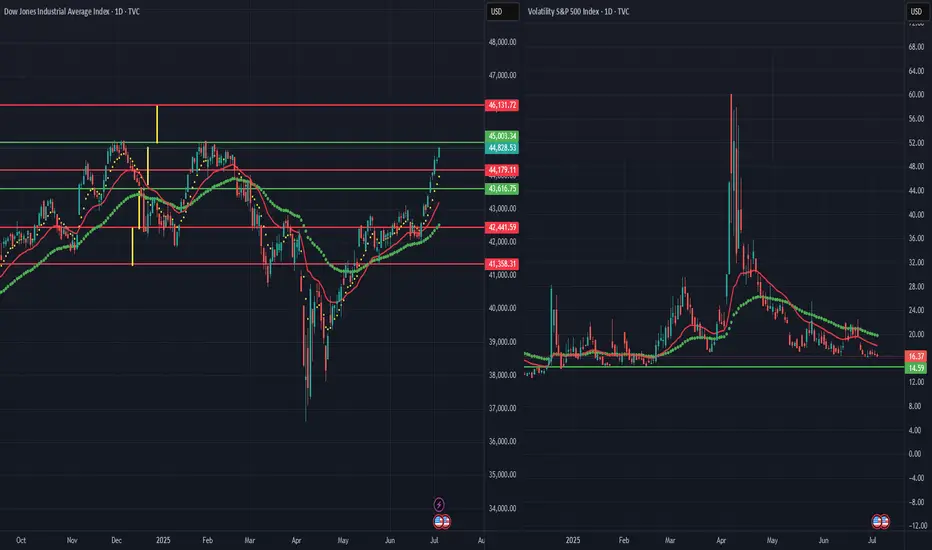
VIX-DJI // In case of an upward movement in the VIX fear index from the 14-16 band, DJI can be pressured at the 45003 level. In case of a sale, 8 ema is our take profit point.
Aeroflex looking good to go Up direction There is a good signal moving average exponential shows that its treand changing down to up and the pole and flag pattern where when its berak the flag and retest we got a big move . Where we can enter at the point of 209 with the stop loss 196 our targets are 215 , 230 260, 280

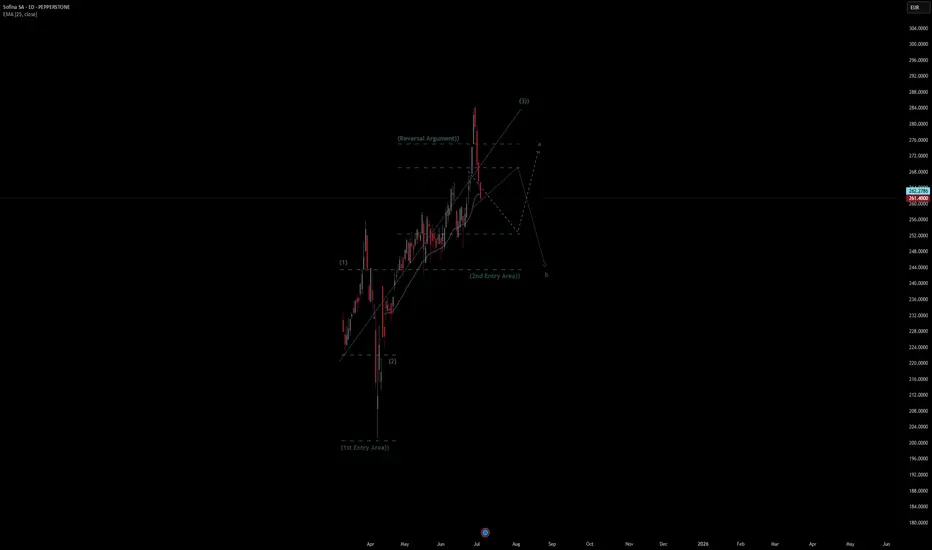
Sofina SA Quote | Chart & Forecast SummaryKey Indicators On Trade Set Up In General
1. Push Set Up
2. Range Set Up
3. Break & Retest Set Up
Notes On Session
# Sofina SA Quote
- Double Formation
* (1st Entry Area)) | Completed Survey
* (Reversal Argument)) | Subdivision 1
- Triple Formation
* (P1)) / (P2)) & (P3)) | Subdivision 2
* (TP1) = a / Long Consecutive Range
* (TP2) = b / Short Consecutive Pullback | Subdivision 3
* Daily Time Frame | Trend Settings Condition
- (Hypothesis On Entry Bias)) | Indexed To 100
- Position On A 1.5RR
* Stop Loss At 106.00 EUR
* Entry At 113.00 EUR
* Take Profit At 124.00 EUR
* (Uptrend Argument)) & No Pattern Confirmation
* Ongoing Entry & (Neutral Area))
Active Sessions On Relevant Range & Elemented Probabilities;
European-Session(Upwards) - East Coast-Session(Downwards) - Asian-Session(Ranging)
Conclusion | Trade Plan Execution & Risk Management On Demand;
Overall Consensus | Buy
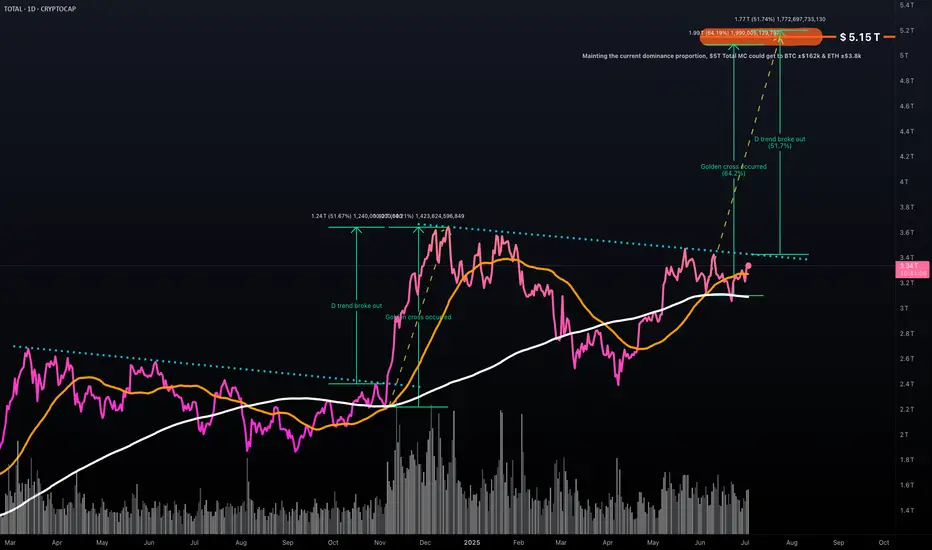
Crypto Tide Rising: Will TOTAL Market Cap surf past $5T?In November 2024 the crypto ocean was calm, hovering near $2.25T . Then, in a short time, fresh capital poured in, daily volume spiked, and the tide lifted us to $3.65T by mid-December .
Two bullish buoys popped up:
▶️ The daily down-trend snapped on Nov 4th, triggering a 51 % climb;
▶️ The 50-day MA (orange) crossed above the 200-day MA (white) on Nov 7th, after a 64 % rally.
Fast-forward to June 4th 2025 . Another Golden Cross has just flashed, and price is again nudging that descending trend-line. If History rhymes: the line breaks and momentum matches 2024’s move, the TOTAL MC could vault toward $5T .
Keeping today’s dominance ratios, that target implies roughly $162 k BTC and $3.8 k ETH . Add rising Global M2 and stablecoin liquidity, a supportive macro backdrop, and we may be staring at the next great crypto swell.
Will the market catch this wave or will macro headwinds keep the tide in check?
Not financial advice. DYOR, Arrr!
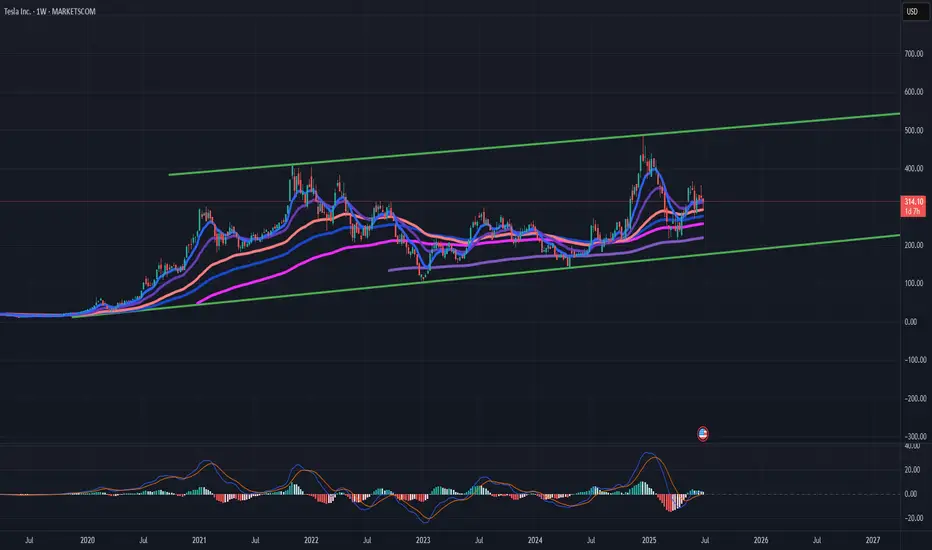
TESLA // Fibonacci numbers are used in the chart. The movement of prices within the channel should be monitored.
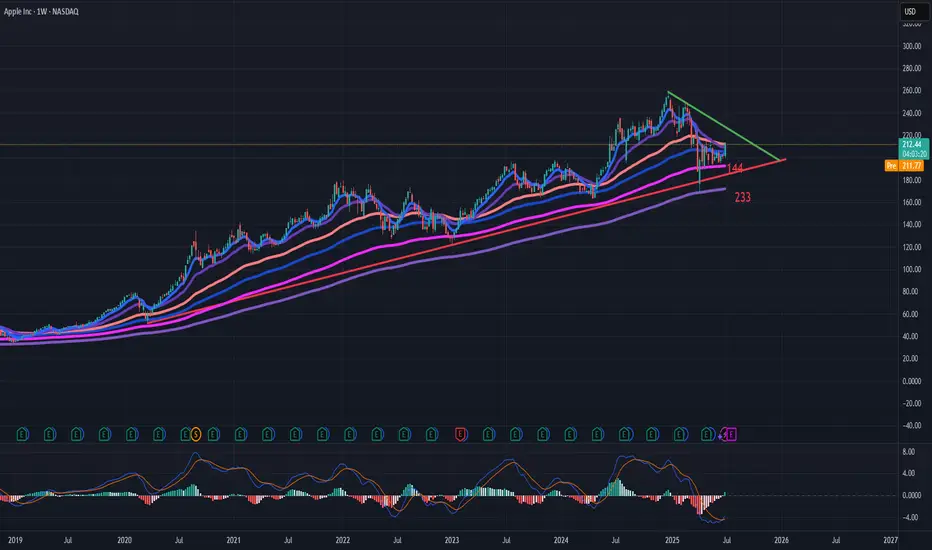
AAPL // I used Fibonacci numbers. 144 is our ema support point. Let's look for closings above the green line for the trend.
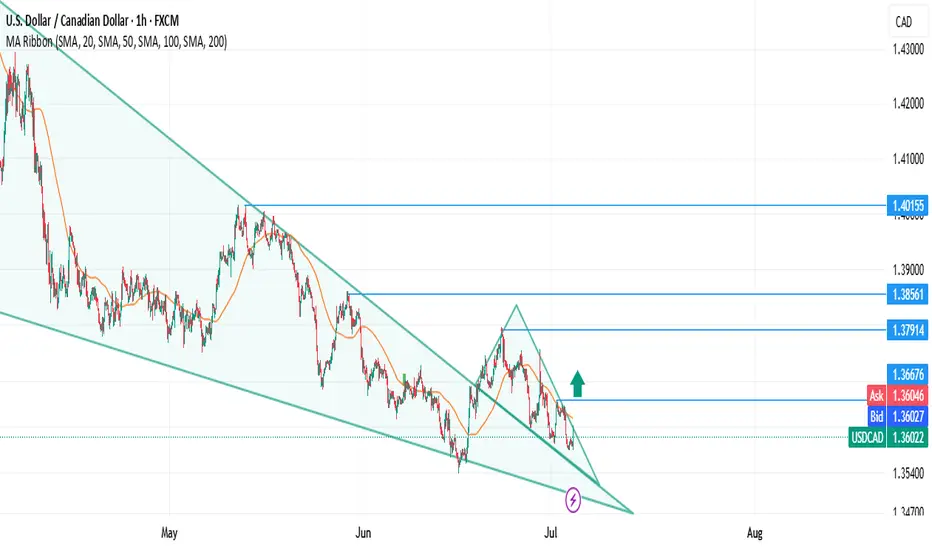
Two Wedges on USD/CAD: Waiting for the FRL ConfirmationWe have two descending wedges on USD/CAD across different timeframes:
H1: Clean falling wedge structure since March, price near the lower boundary.
H4: Same wedge structure, aligning with the larger phase.
FRL Entry Confirmation:
Following the Fractal Reversal Law (FRL), we do not enter immediately.
We wait for:
✅ A full candle close above the neckline of the local double bottom,
✅ Where the neckline on H1 aligns precisely with the 100 SMA.
This confirms phase reversal and removes noise, making the entry safe.
🎯 Targets:
1️⃣ 1.36676 – First take profit, retesting the neckline break.
2️⃣ 1.37914 – Mid-term target, wedge mid-level.
3️⃣ 1.38561 – 1.40155 – Full wedge top, long-term objective.
Why This Matters:
✅ Positive US unemployment data supports USD strength.
✅ The wedge is 3+ months wide, adding reliability to the breakout.
✅ Alignment with 100 SMA increases the accuracy of FRL signals.
✅ The trade offers a clear Risk/Reward above 1:2.5.
Trading is capital management under uncertainty.
The red horizontal zone is uncertainty; the neckline is the Rubicon where the market becomes clear. Don’t fear uncertainty. Wait for clarity.
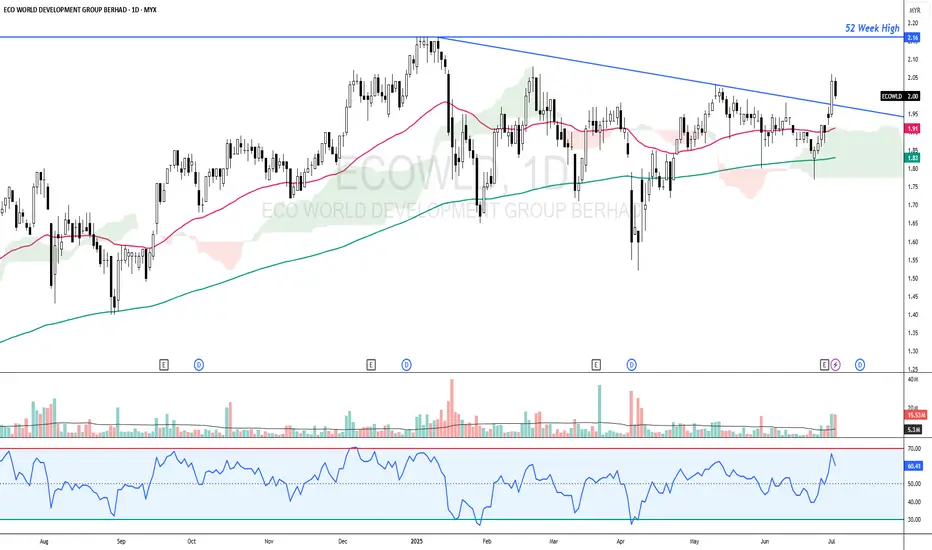
ECOWLD - Heading towards 52 WEEK HIGH ?ECOWLD - CURRENT PRICE : RM2.00
ECOWLD broke out a 6 month down trendline on 01 JULY 2025 with high trading volume indicating strong bullish momentum. The stock is bullish as the price is above both 50 and 200 EMAs. Furthermore the share price is near 52 Week High. RSI is above 50 and below 70 indicating stock is bullish and not considered overbought yet. Nearest target will be RM2.16 (52 Week High resistance) and then if the trend resume, it may propel higher to hit next target at RM2.28. Support level is the low of 23 JUNE 2025 candle - RM1.77.
ENTRY PRICE : RM1.99 - RM2.02
TARGET : RM2.16 and RM2.28
SUPPORT : RM1.77
Notes : On 26 JUNE 2025 the company announced its increasing QUARTERLY EARNINGS. May visit company website or TheEdge for get more information.
XAUUSD — July 3rd, 2025: Is the Downtrend Finally Over?Gold (XAUUSD) opened today with a bullish gap, and continued the momentum from Tuesday’s breakout above the major downtrendline that had capped the market for weeks. This technical breakout was long-awaited by many traders, and it's now leading us into a potential trend reversal phase — but not without resistance.
Price has now reached a critical resistance zone at 3366, which previously acted as a strong supply area during the last leg of the downtrend. If this level is broken decisively (ideally with a 4H candle close and follow-through), it may signal a clean shift toward a mid-term uptrend, with upside targets at 3379, 3403, and even 3430.
That said, rejection at 3366 has already triggered a minor pullback. We’re now watching the 3343–3351 zone as a potential support and an optimal buy entry area. If this zone holds, it could provide the fuel needed for bulls to continue their push.
🟢 Suggested Trade Plan
BUY LIMIT 3343–3351
Stop Loss 3325
Take Profit 1 3379
Take Profit 2 3403
Take Profit 3 3430
(Alternatively, consider a BUY STOP above 3370 in case of direct breakout)
📌 Market Structure
Resistance 3 3430
Resistance 2 3403
Resistance 1 3382
Pivot 3366
Support 1 3342
Support 2 3322
Support 3 3305
⚠️ Important Macro Alert
Today’s session is highly risky due to the early release of Non-Farm Payrolls (NFP) data, which is scheduled today instead of Friday because of the U.S. Independence Day (July 4) holiday tomorrow.
This brings a major volatility spike risk during the New York session. Manage your position size wisely, avoid emotional trades, and wait for solid confirmations.
Discipline beats prediction. Trade what you see — not what you feel.
Keep healthy so we can keep trading and we can keep on profiting.
