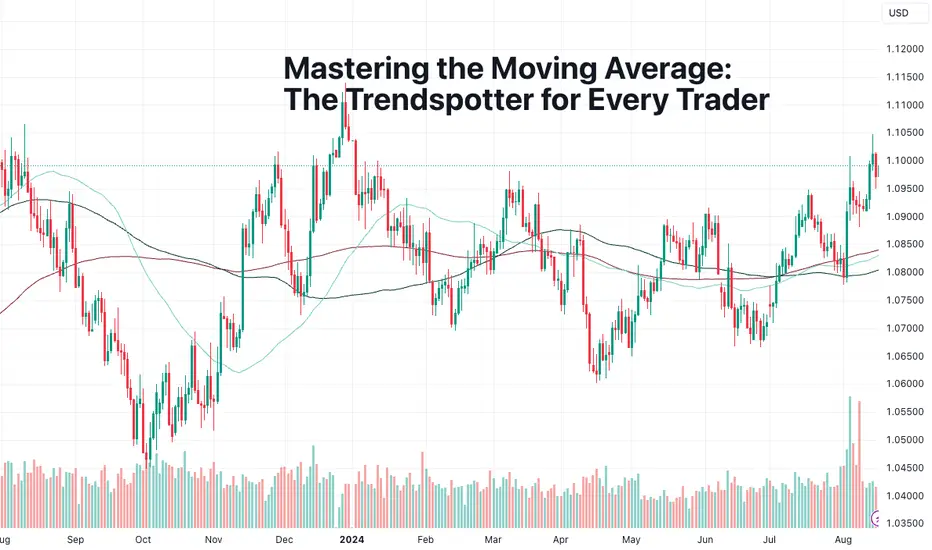
Mastering the Moving Average: The Trendspotter for Every TraderTradingViewers, this one will take you back to basics. In this Idea we visit a tool that’s as essential as your morning coffee — the Moving Average (MA). This indicator is the market’s smoothing instrument, ironing out the noise and letting you see the trend for what it really is.
What’s a Moving Average?
Think of the Moving Average as the market’s highlight reel. It averages out price action over a specific period, showing you where the market’s been and giving you a clue about where it might be headed.
It’s the ultimate trendspotter, cutting through the daily chatter to reveal the bigger picture. Day traders and scalpers, don’t fret — it works on intraday time frames, too.
Types of MAs
Simple Moving Average (SMA): The old-school classic. It’s as straightforward as it gets — just an average of days you specify — 7, 9, 21, 50, 100, or even 200 days — that’s called “length”. This tool might be simple, but it’s a mainstay indicator for professional traders, institutional investors, and other big-shot money spinners.
Exponential Moving Average (EMA): The turbocharged version of the SMA. It gives more weight to recent prices, meaning it reacts quicker to the action. If the SMA is a steady cruise, the EMA is a sports car with a little more kick.
How to Use Moving Averages
Spotting Trends : The Moving Average is your trend-checking buddy. Prices above the MA? We’re in bull territory. Prices below? Looks like the bears are in control. Slap it on any time frame — it’s the same rules regardless of the time horizon.
Support and Resistance : MAs are like the guardrails of the market. They often act as support during uptrends and resistance during downtrends. When price bounces off an MA, it’s like a boxer bouncing off the ropes — watch for the counterpunch!
The Golden Cross & Death Cross : Now we’re talking setups that get traders buzzing. When a short-term MA crosses above a long-term MA, you get a Golden Cross – the market’s flashing a buy signal party. But when the opposite happens, it’s a Death Cross, and the bears start licking their lips.
Moving Average Crossover : Want some trading action? Watch for crossovers between short and long MAs. For example, throw in your chart a 50-day moving average and then top it up with a 100-day and a 200-day line. If they all cross over to the upside, you can expect a swing higher. And if they cross over to the downside, you can anticipate a swing lower.
Pro Tip: Tune Your Moving Average
Jot these numbers down — 20, 50, 100, 200 — these are the MA settings you’ll see most, but don’t be afraid to tweak them. A shorter MA (20 or 50) reacts quicker but can whipsaw you. A longer MA (100 or 200) is steadier but might be slower to catch reversals. It’s all about finding the balance that suits your trading style.
Bottom Line
The Moving Average isn’t about predicting the future — it’s about seeing the present more clearly. It’s the difference between getting lost in the noise and riding the trend with confidence. Whether you’re trend-following or looking for a noiseless entry, the MA is your go-to indicator.
So slap that Moving Average on your chart and let it take you beyond the clutter. Because when the market’s moving fast, it pays to have a steady hand guiding your trades. And as essential as MAs are, don't limit your analysis to just one tool: apply several indicators on your chart to spot trends more effectively and enhance your research with data from the economic calendar , screeners, heatmaps, and all kinds of tools available on TradingView to have a bigger picture of market activities.
Are you already using MAs in your charting and trading? Let us know in the comments below!
Movingaveragestrategy
Bitcoin Must Show Decisive in its Move before im excitedHi guys. So i posted recently some crypto related stock ideas. I felt like i should do a BTC update as they are directly related. When BTC goes up, all related crypto assets move up.
So lets jump right in.
This is a 1 week analysis.
So we have established a consolidation range. Consolidation ranges is just a price range between which an asset moves up and down in.
The key is to observe a confirmation of a breakout either ABOVE or BELOW it.
The Key lvls are:
1. $61,000 as support
2. $71,000 as Resistance
FOr our Bull market to continue and move into the final supercycle phase of the crypto market we need a DECISIVE BREAK ABOVE 71,000.
This will in a short time print a blowoff top and end Bull market.
I have up a bunch of Moving averages in different colors.
What i'd love to see is from ascending order:
Purple 1st
Green 2nd
Blue 3rd
Red at the bottom
This order signifies that a Bull market is going on.
STOCH RSI has also crossed BUllish above the 20 lvl. If you look left, everytime we've done so We've moved higher.
_________________________________________________________________________________
Thank you for taking the time to read my analysis. Hope it helped keep you informed. Please do support my ideas by boosting, following me and commenting. Thanks again.
Stay tuned for more updates on BTC in the near future.
If you have any questions, do reach out. Thank you again.
DISCLAIMER: This is not financial advice, i am not a financial advisor. The thoughts expressed in the posts are my opinion and for educational purposes. Do not use my ideas for the basis of your trading strategy, make sure to work out your own strategy and when trading always spend majority of your time on risk management strategy.

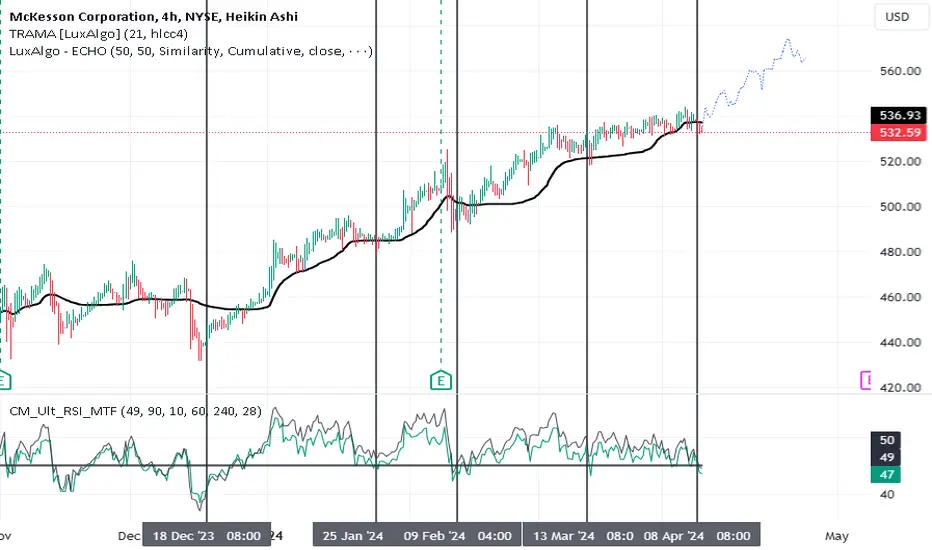
MCK a large cap medical supply company LONGMCK is a large cap medical supply company- it has experienced respectable earnings reports
and steady growth as medical entities including surgery centers and hospitals are busy catching
up on electric surgeries from the COVID era. It is rising ar or under the second upper VWAP
line. The dual time frame RSI indicator ( by Chris Moody) shows that every time the faster
RSI ( 1 hour) RSI drops down to the 50 level it rebounds with a corresponding price move up.
These episodes are shown as thin black vertical lines. One of them is at present. The
forecasting algorithm of Lux Algo predicts a further rise to the level of 575 in the next six
weeks. The last earnings was quite solid with the next earnings in 4 weeks.
I will take a long trade here. I will add to the position for any dips to or below the
running EMA 9 but not reaching the EMA100.
I will take a partial profit at 560 and cut the position down to 25% the day before earnings for
purposes of good risk management. If price crosses under the running EMA100 I will
close the trade and collect the unrealized profit.
Is the rest for AMZN short-lived LONGAMZN on the 60 minute chart since earnings shows the jump and the sideways consolidation
after that. Here the RSI is superimposed on the chart within its own 0-100 scale. It is currently
in what should be considered deep undervalued territory and at RSI support /demand. The
William's Alligator set of moving averages shows MA compression and so convergence.
AMZN's price is now in a tight range with volatility likewise compressed especially compared
with that at earnings. In short price is coiled, the potential energy is ready to get converted
to kinetic for those who have an understanding of classical physics.
All that said, I see AMZN as ready to roll. I will take long trades in shares and options as
AMZN is ready to hit the ground running.

Learn 4 Proven Methods of Applying Moving Average Indicator
Hey traders,
The moving average is one of the most popular technical indicators.
It is applied in stocks/forex/crypto trading and proved its high level of efficiency.
There are hundreds of trading strategies based on MA.
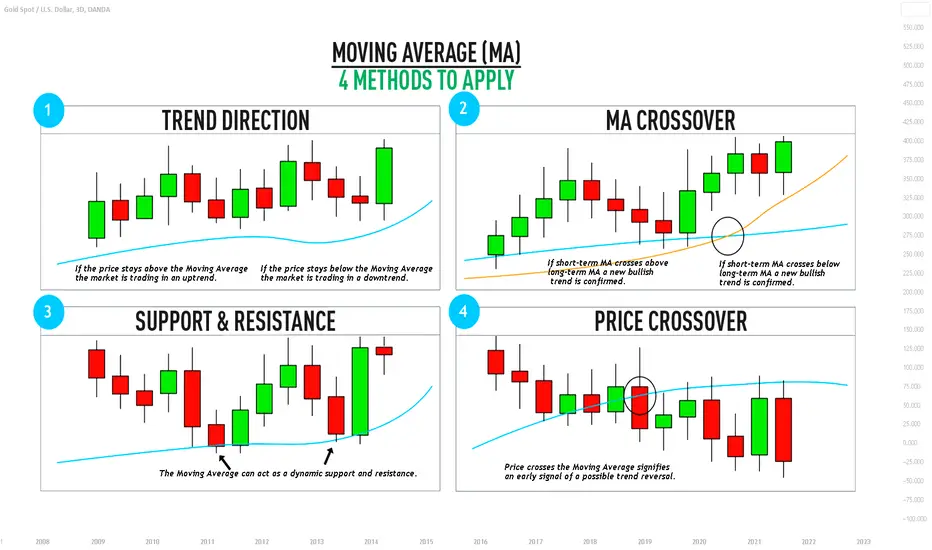
In this post, we will discuss the 4 most popular ways to apply the moving average.
1️⃣The first method is applied to identify the market trend.
While the price keeps trading above the MA, one considers the trend to be bullish and looks for buying opportunities.
Once the price starts trading below the MA, the trend is considered to be bearish and a trader is looking for shorting opportunities.
In the example above, Moving Average is applied for showing the identification of the market trend. Its upward climb signifies that the market is trading in a strong bullish trend.
2️⃣The second method applies the combination of 2 MA's: preferably a long-term one and a short-term one.
The point is that once a short-term moving average crosses above a long-term MA, with high probability, it signifies the initiation of a bullish trend.
Alternatively, a crossover of short-term and long-term MA's to the downside indicates a start of a bearish trend.
In the example above, there are 2 Moving Averages: short term and long term ones. Their cross signifies the bullish trend violation and initiation of a bearish trend.
3️⃣The third method applies MA as a structure.
While the moving average is lying above the price, it is considered to be a dynamic resistance.
Staying below the price, it serves as a strong dynamic support.
Perceiving MA as the structure, one applies that for trade entries.
In the picture above, Moving Average is applied as support on GBPJPY and the price starts growing after its test.
4️⃣The fourth method is aimed to track the crossover of the moving average and the price.
The idea is that a bullish violation of the MA by the price gives an early signal for a possible trend reversal.
While a bearish breakout of the MA by the market indicates a highly probable bullish trend violation.
In the example above, the crossover of the moving average and the price is a perfect indicator of coming bullish and bearish movements.
Backtest different MA's inputs and learn to apply that for predicting the future direction of the market and for trading it.
Let me know, traders, what do you want to learn in the next educational post?
📈 4 Ways To Use The Moving Average📍 What Is a Moving Average (MA)?
In finance, a moving average (MA) is a stock indicator commonly used in technical analysis. The reason for calculating the moving average of a stock is to help smooth out the price data by creating a constantly updated average price.
By calculating the moving average, the impacts of random, short-term fluctuations on the price of a stock over a specified time frame are mitigated. Simple moving averages (SMAs) use a simple arithmetic average of prices over some timespan, while exponential moving averages (EMAs) place greater weight on more recent prices than older ones over the time period.
Common moving average lengths are 10, 20, 50, 100, and 200. These lengths can be applied to any chart time frame (one minute, daily, weekly, etc.), depending on the trader's time horizon. The time frame or length you choose for a moving average, also called the "look back period," can play a big role in how effective it is.
An MA with a short time frame will react much quicker to price changes than an MA with a long look-back period. In the figure below, the 20-day moving average more closely tracks the actual price than the 100-day moving average does.
👤 @AlgoBuddy
📅 Daily Ideas about market update, psychology & indicators
❤️ If you appreciate our work, please like, comment and follow ❤️

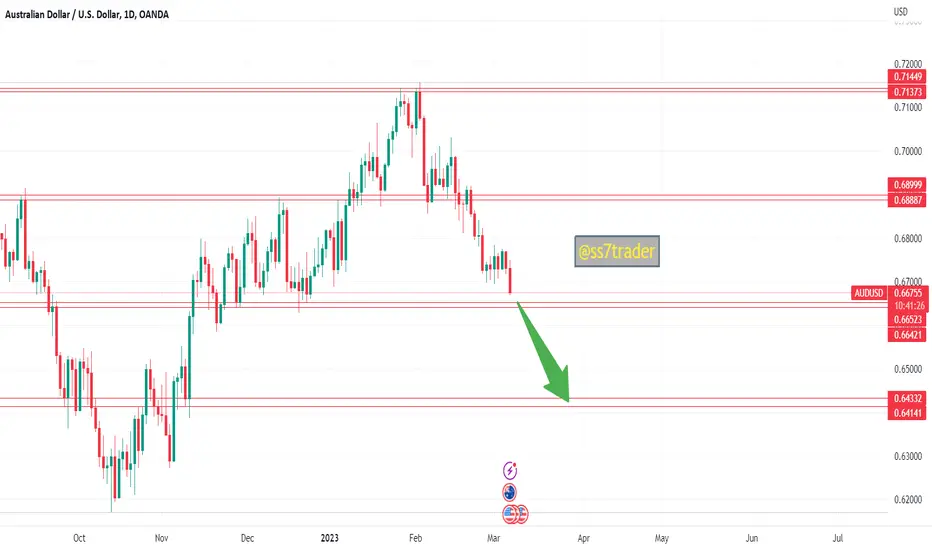
AUD/USD Technical Analysis: Bearish Signals Ahead? 📉📊In my analysis of AUD/USD on TradingView, I have identified several bearish signals that suggest the pair may be headed for a downward trend. The pair has been trading within a descending channel, with lower highs and lower lows. Additionally, the 50-day moving average has crossed below the 200-day moving average, indicating a possible long-term bearish trend. The RSI is also hovering around the oversold territory, adding to the bearish outlook. 📉📊📉
#AUDUSD #TechnicalAnalysis #BearishOutlook #DescendingChannel #MovingAverages #Oversold #ForexTrading
My three favourite Moving Averages on any chartI have three Moving Averages that I plot on any market.
7 MA
21 MA
200 MA
Here is the JSE ALSI 40 with the three moving averages.
In the above daily chart of the JSE you can see I’ve plotted the 7MA (Red), 21MA (Blue) and 200MA (Black).
Now I have two simple rules for when the market is in an uptrend or a downtrend.
Downtrend with the three Moving Averages
You know the market is in a downtrend when the price is below the 200 MA.
Also, 200MA is above the 21 Moving Average.
And the 21 MA is above the 7MA.
In other words.
7MA < 21MA < 200MA.
You can see on the left part of the chart where the trend is down (Red arrow).
This tells me that the momentum is bearish and the market is more likely to fall than rise.
I will then avoid buying the market and instead will only look to short (sell) and profit from a falling market.
Then we have the
Uptrend with the three Moving Averages
What tells me the market is in an uptrend is when the price is above the 200 MA.
Also the 7MA is above the 21MA.
And the 21MA is above the 200MA.
You can see on the right part of the chart where the trend turns up (Green arrow).
This tells me that the momentum is bullish and the market is more likely to continue to rise.
I will then only look for longs (buy) the market and avoid shorting or selling the market.
Now you have my favourite 3 Moving Averages in a bag for you to plot on your chart and master the trends.
Trade well, live free.
Timon
MATI Trader
Connect below with the socials...

Bulls to project first targets.Recent confirmation of leaving the bottom of 40W cycle behind has started fast pace of raise for BTC and other important altcoins.
As drawn on the chart we have got first estimation of local target, mid way of the bull run that has started just now.
By extending moving averages of recently confirmed cycles, we estimated the point where bitcoin should top off and have some retrace before next stage of this 40W.
We estimate the top at 33k by 26th of December along with the top of first 10W cycle.
Of course adding some standard deviation is essential for managing the risk level.
Bitcoin is getting more and more stable along with the influx of huge institutional funds.
It is getting out of being just a speculative asset but a serious instrument so we would not expect some 10k moves but rather a steady up trend.
Then we should see some trace back in January, that would lead us to the proper high of the major 40W cycle somewhere between February and March 23. Precise numbers we can estimate after we top off this first 10W cycle that we are riding now.

GBPUSD ! devaluation is expected to continue.GBPUSD test the level of 1.17500 and show a fall, and it looks like it has broken the level of 1.16800, which was a strong support on the 4-hour chart. Today, GBPUSD will check 1.16800 and continue to fall.

MOVING AVERAGE TRADING | ADVANCED LESSONHello traders 👋
Today im sharing my trading strategy with moving average.
What Is an Exponential Moving Average (EMA)?
An exponential moving average (EMA) is a type of moving average, but it's better than MA(Only my opinion. It is one of the most important things in forex trade. Because this gives you the best direction of the trend.
How to trade And Use moving average. 🧑🏫
When most traders use it moving average crossing. I don't think it's a good strategy. For me, when using it, looks at a trading setup.
1. Looking daily timeframe 👀
This is because you want to find the price action for a longer period and not just some light movement.
2. Draw ✏️
To draw a trend line ( if you don't know how to draw trendline watch my last lesson)
3. Add 50 EMA 📉
4. The Basics of Support and Resistance + key levels ✔️
the concept is applied in order to maximise the chances of winning trades.
5. Looking for entry + risk management 💰
Always wait for confirm example; trend line break + price making lower low + pullback + add indicators.
In this lesson, we expect EURJPY to fall below 134.50. Let's see what happens in the future.
🤲 If you are enjoying the lesson, please hit the like show your support. 🤲

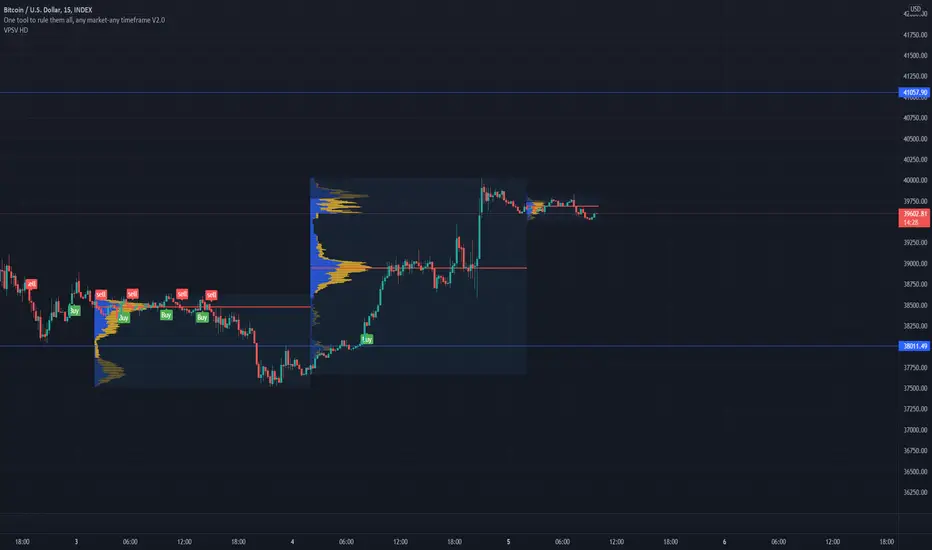
Bullish BTC 05 May 2022We can estimate with a 90% confidence that the volatility for today is going to be below 3.82% based on the last 4267 Daily candles.
Having said that, lets take a look at the support and resistence points from this current position
BOT = 41000
TOP = 38000
From the fundamental point of view, yesterday we had the release of the interest rates, so I believe currently we are in a short relief moment, where we can have for some days/weeks a small bull trend
For today we have no big volatility news, so we cant expect big surprises.
From volume point, we can see that the point of concentration is around 39000-39500.
From technical analysis point, we can see that yesterday on 15min, we had a long entry alert around 38200
At the same time, on 30 min it happened the same around 38700
Lastly on 1h we had as well an entry around 39000.
So overall there is a very confidence that we are going to have a small bull moment period(days, weeks? )