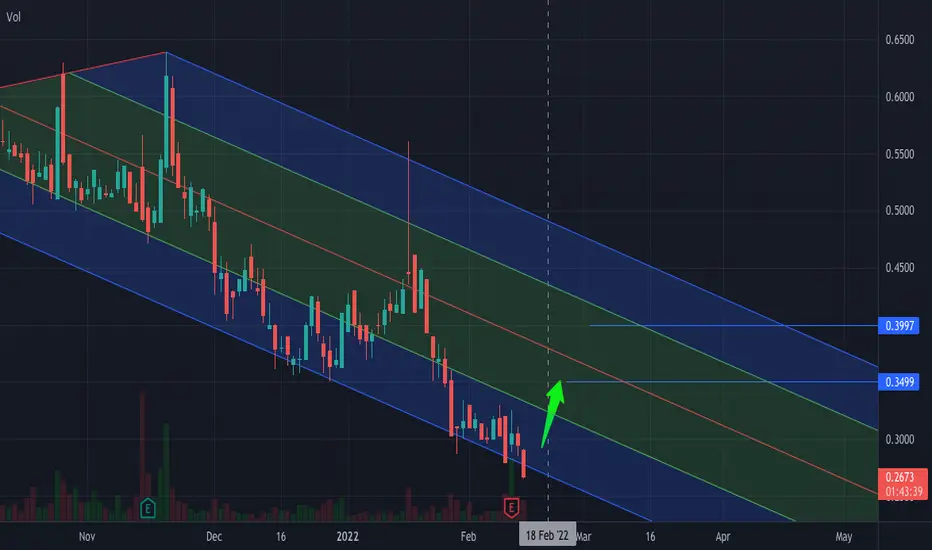
A sharp increase is expectedAccording to the pattern, stock is in the best entry position and two levels of price increase up to 0.35 and possibly 0.4 are foreseen. Highly recommended for Mid-term.
Microsoft (MSFT)
Microsoft (MSFT) | The safest target to climb📍Hello traders, Microsoft in daily timeframe , this analysis has been prepared in daily timeframe but has been published for a better view in 2 day timeframe.
The general structure of this counted wave is unclear and we need more waves to detect it.
Now, according to the count, the main waves 1 and 2 have been formed and now we are inside wave 3.
This wave 3 has formed its wave 4 in such a way that it can not be said that it is complete or this ascent that we are considering is part of wave 4.
In terms of time, wave 4 is normal compared to wave 3.
We are currently waiting for an uptrend that this trend may take place before the 270 range and possibly after this price at which the correction structure will change and possibly end in a leading triangle.
If the canal roof is broken upwards, it is a confirmation to start the upward movement.
🙏If you have an idea that helps me provide a better analysis, I will be happy to write in the comments🙏
❤️Please, support this idea with a like and comment!❤️

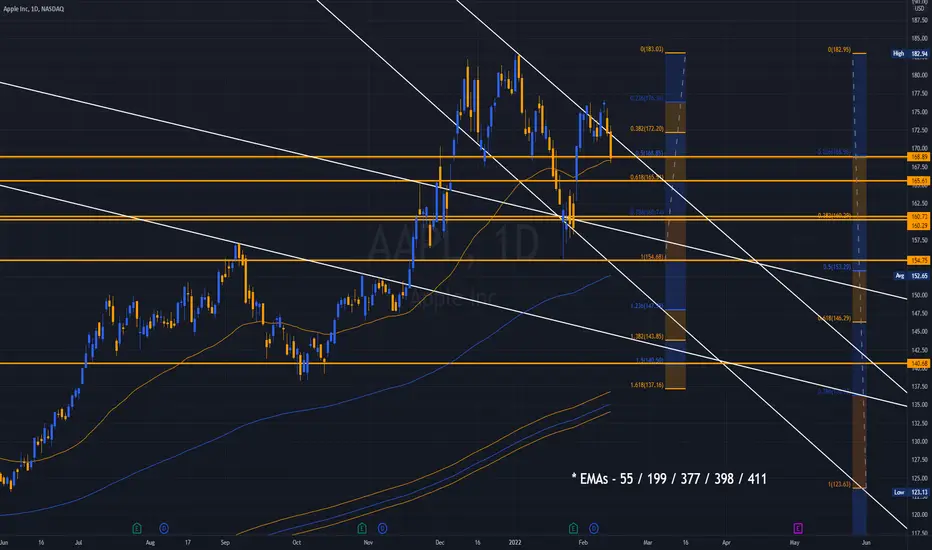
AAPL - Daily / Apple Joins the Death Cross Cult of FANGsApple's Impulse Weakening Impulse Structure has finally broken.
We warned of this on February 6th, the Retracement was concluding
as many of the FANGs were seeing 55/199 Crosses occurring.
2C was a weak retracement, we were looking forward to more, but
it simply was not to be.
Yields crossing 1.691 were our LIS for the cross over 2% and onto 2.06
to and through 2.082 / 2.12 / 2.189 / 2.26 / 2.28 and on to the UTL
with a potential Throw over to 2.5%.
Apple will lead 3A (a powerful move lower to new lows) as its weighting
is sizeable for NQ.
As previously indicated 141s are the Initial Price Objective for 3/5 IT.
We believe it can move lower to the 411 EMA @ ~ 133.4.0.
Apple has lost the Edge in innovation and is unable to complete with the
Google's innovations and breadth of Carrier Market Integration.
After months of research into Global Access - the Edge Google has over
Apple is immense. The Pixel 6 is functionally a very basic, well made
Smartphone.
Where it excels is in AI Integration and Carrier switching.
I have begun converting to Google's Hardware and Service for all lines and
services, consolidating a number of Business Lines for Global use while
traveling outside the United States.
Apple is unable to offer anything remotely competitive, their claims to
developing a true Global Phone with improved carrier switching is quite
distant at this point in time.
Margin compression, Debt, a very Real Lack of Innovation (Share Buybacks
as opposed to CapEx Investment), and Accountants gaming the Future... Unlikely
Apple will ever return to its former Halcyon days as a leading TECH Innovator.
______________________________________________________________________
Instead, APPLE will be the Anchor that drags the NQ to new Lows in 3/5 IT and
then 5/5 for the IT Correction.
5/5 will then take this Overhyped Cult to new ATHs into Q3 of 2022.
From there our price Target remains $35 into 2025.
MICROSOFT UPDATESeems our analysis has come up as true. well done Lungu FX team.
you may place stop losses on profits when market open up again.
like to pervious analysis is given for reference.
msftsdvsdvdsvsdfdsfdsfdsfdsfdsfdsdvsdvdsvsdfdsfdsfdsfdsfdsfdsdvsdvdsvsdfdsfdsfdsfdsfdsfdsdvsdvdsvsdfdsfdsfdsfdsfdsfdsdvsdvdsvsdfdsfdsfdsfdsfdsfdsdvsdvdsvsdfdsfdsfdsfdsfdsfdsdvsdvdsvsdfdsfdsfdsfdsfdsfdsdvsdvdsvsdfdsfdsfdsfdsfdsfds

is it the start of the recession?i think market is about to go in depression stage and in 10 year of bear market like last ones in history.

Corrections are needed to create buying opportunities Refer to my related link below see the similarities in the charts, as you can see overall markets are breaking down on global tensions, inflation and FED interest rate hikes. most stocks have been parabolic for 6 years now, with March 2020 barely putting a dent in the growth.
Can see my limited risk entry points on MSFT. Doesn't mean if markets don't change I'm happy to buy back in until then research.

Possibly a Short Squeeze on the Way!Chart's pattern and its resistance at around current price make a sharp price change foreseeable.
Recommended for Midterm.

How do you enterpret this observation?These are my observations:
1- MSFT correction in January 2022, was the biggest and sharpest correction since March 2020. (Post pandemic)
2- Highest Price-volume ever..(295 Billion) + Biggest negative monthly return since 2016.
3- Making a dome shape Top, after a sharp bullish move in November 2021, Some call this pattern Bump and Run.
The bump and Run chart pattern is a remarkable reversal pattern that will help you spot the end of a trend and the beginning of a new one.
What do you think???
For further information you can read this article: (interesting content, I can not share because of copyright)
Zheng, Yuechu & Si, Yain Whar & Wong, Raymond. (2021). Feature extraction for chart pattern classification in financial time series. Knowledge and Information Systems. 63. 10.1007/s10115-021-01569-1.
Extracting shape-related features from a given query subsequence is a crucial preprocessing step for chart pattern matching in rule-based, template-based, and hybrid pattern classification methods. The extracted features can significantly influence the accuracy of pattern recognition tasks during the data mining process. Although shape-related features are widely used for chart pattern matching in financial time series, the intrinsic properties of these features and their relationships to the patterns are rarely investigated in the research community. This paper aims to formally identify shape-related features used in chart patterns and investigates their impact on chart pattern classifications in financial time series. In this paper, we describe a comprehensive analysis of 14 shape-related features which can be used to classify 41 known chart patterns in the technical analysis domain. In order to evaluate their effectiveness, shape-related features are then translated into rules for chart pattern classification. We perform extensive experiments on real datasets containing historical price data of 24 stocks/indices to analyze the effectiveness of the rules. Experimental results reveal that the features put forward in this paper can be effectively used for recognizing chart patterns in financial time series. Our analysis also reveals that high-level features can be hierarchically composed of low-level features. Hierarchical composition allows the construction of complex chart patterns from features identified in this paper. We hope that the features identified in this paper can be used as a reference model for future research in chart pattern analysis.
You can see the most important support(green line) and resistance (red line) levels.
Best,
Moshkelgosha
DISCLAIMER
I’m not a certified financial planner/advisor, a certified financial analyst, an economist, a CPA, an accountant, or a lawyer. I’m not a finance professional through formal education. The contents on this site are for informational purposes only and do not constitute financial, accounting, or legal advice. I can’t promise that the information shared on my posts is appropriate for you or anyone else. By using this site, you agree to hold me harmless from any ramifications, financial or otherwise, that occur to you as a result of acting on information found on this site.

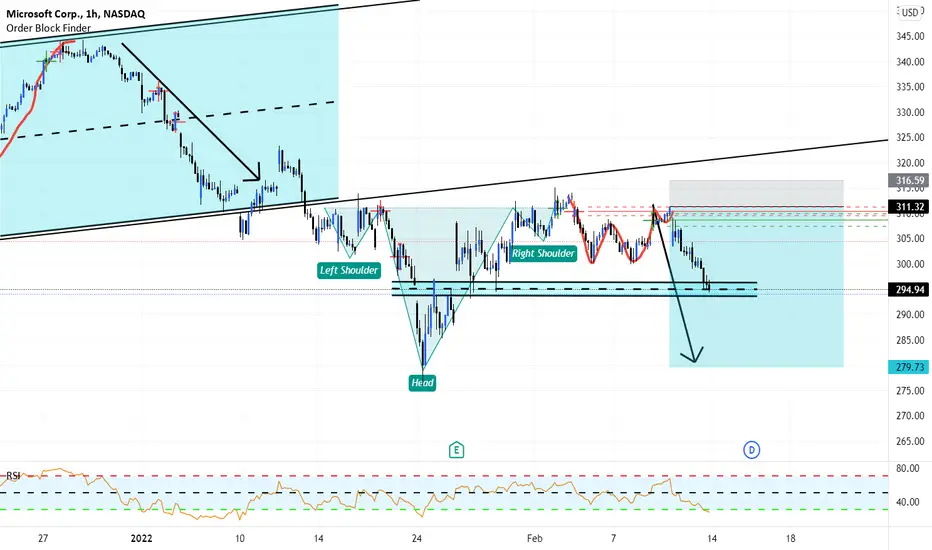
MSFT SELLMICROSOFT IS DEFIENATLY STILL BEAISH.
we noted the completion of the w formation along with retesting support and coming to a bearish order block

Sharp growth expected!Regarding the volume signal and chart position, a sharp price change is expected. Recommended for 2-3 month.

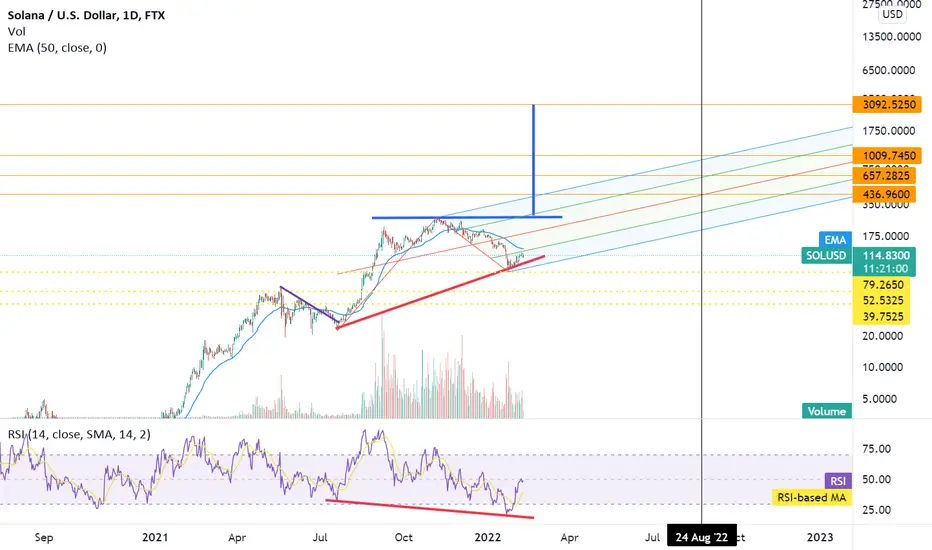
SOL: D & W Hidden Bullish Divergence and Large Wedge FormationSOL is a very strong project with extremely strong fundamentals (user growth, speed, cost) versus competitors. Despite the recent wormhole hack which wasn't an issue of SOL but an issue with a bridge is making headlines, this only provides an opportunity to buy cheaper than normal imho.
SOL will no doubt fix any congestion issues it had in the past as their lead dev devoted an 8 week campaign to bolster the network and solve any issues. These are top programmers from Qualcomm and you can rest assured these sort of programmers are much better than crypto programmers. SOL allows MUCH easier to use programming languages than other rival coins such as ETH which relies solely on Solidity and feedback from top programmers is that Solidity is not easy to use at all. This impact development significantly as the legacy world still has 98% of programmers and if you want your crypto project to grow in the long-run, it's ideal to have the easier programming languages to onboard those 98% to create apps and develop for the best projects.
Lastly, SOL has an asymmetric advantage as it is backed by one of the brightest minds in the space, Sam Bankman-Fried. Sam's pro-regulator clarity stance will make SOL a crowd favorite to overcome any hurdles in the future.
My price targets for SOL are in the mid $400-$500 by mid-year. It sounds lofty but again, SOL is actually onboarding users and is increasing its re-investment into the network and into R&D. It would only infer a $130B market cap which isn't that high compared to what coins like XRP did in the last bull-run in 2017 when there were 10% of the investor pool. XRP achieved $130B market cap in 2017. SOL is about 100x more useful than XRP so as the large wedge formation suggests, SOL's terminal value is likely multi-thousand dollar range. This of course depends on how quickly SOL's programming team develops top products. With SOL Pay just launching on the market a few days ago that provides a direct conversion into USDC upon paying for goods and services, SOL could be at the beginning of yet another impulse wave higher. SOL Pay is a game changer in terms of adoption, and will only quicken major developers to come into the Solana ecosystem, as more of the legacy guys will want to join networks that are headed by legacy programmers.
Lastly, there is strong Hidden Bullish Divergence on the daily and weekly charts - this is a longer term signal that typically plays out over weeks/months.
If you own a big bag of ETH or DOT, it would be wise to diversify a bit into SOL for your long-term bags here.
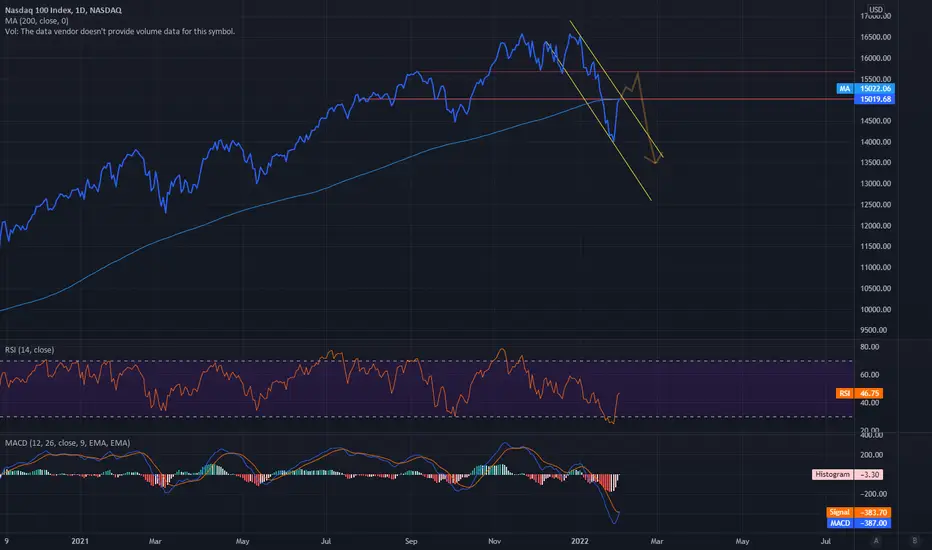
Nasdaq Earnings RallyBased on nothing else but more speculation, the Nasdaq may rally. Let's see how this plays out for February since the Feds QE taps are closing this month. Will they reverse and pump more 0% funny money? I don't think they'll reverse until there is a major downtrend which will happen after this earnings rally. The two resistance levels are marked, although tomorrow 2/2 the Nasdaq should break through.
I still hold strong to a bear market based on countless economic issues from:
Inflation
Poor Retail
Pending Home Sales Decline
Tapering Ending in Feb
Balance Sheet Reduction
Raising Rates
0.1% Q1 GDP estimate by Atl Fed.
When the Fed pumps, logical news doesn't matter. Good news is good, and bad news is good. This alone tells you this a bubble, where equities no longer react because retail investors influence has become smaller and smaller in equities. Retail investors are but a drop in the bucket compared to $120 Billion in 0% QE money.
Entery Position.This is what is mostly expected to happen for IO. (it may also be much sharper as a result of a Short Squeeze, no share for short)
Not recommended for Long term BUT it's awesome for Mid term!

FAANG Dead? The NEW Tech Stock Leaders!With the disasterous earnings of Netflix NASDAQ:NFLX and Facebook NASDAQ:FB this past month it may be time to call for a new acronym of the still bullish and strong Tech Stock leaders of the market: Micosoft NASDAQ:MSFT - Apple NASDAQ:AAPL - Google NASDAQ:GOOG - Amazon NASDAQ:AMZN

Microsoft (MSFT) | The safest target to climb📍Hello traders, Microsoft in daily timeframe , this analysis has been prepared in daily timeframe but has been published for a better view in 2 day timeframe.
The overall identity of this counted wave is unclear and we need more waves to detect it
Now, according to the count, the main waves 1 and 2 have been formed and now we are inside wave 3
This wave 3 has formed its wave 4 in such a way that it can not be said that it is complete or this ascent that we are considering is part of wave 4.
However, according to our calculations, the trend has an upward phase that may go to the end of wave 3
If the 278 range is broken down, the correction structure is changed and the ascending phase is performed in the lower range.
🙏If you have an idea that helps me provide a better analysis, I will be happy to write in the comments🙏
❤️Please, support this idea with a like and comment!❤️
