Microsoft (MSFT) Stock Hits a 4.5-Month HighMicrosoft (MSFT) Stock Hits a 4.5-Month High
On 31 October, our analysis of Microsoft (MSFT) stock highlighted:
→ The price is forming a long-term upward channel, illustrated in blue.
→ The channel’s lower boundary serves as a significant support level.
On Friday, MSFT stock climbed to $445, its highest level since mid-July, buoyed by news that OpenAI may grant Microsoft access to key AI-related technologies.
Will the Price Continue to Rise?
There are reasons to suspect that the bullish momentum may not sustain.
Technical analysis of MSFT’s chart today suggests:
→ The price is near the median of the long-term channel, and this median could act as resistance. This is hinted at by the long upper shadows on Thursday and Friday’s candles.
→ The emerging bullish breakout above the September high around $441 might prove to be a false breakout, similar to the false bearish breakout of early October support near $408 (highlighted with arrows).
Additionally, Microsoft’s stock has underperformed compared to market indices, which are at historic highs. This could mean the price may retrace to $430 or lower, aligning more closely with average autumn levels.
Analysts, however, remain optimistic about MSFT’s prospects. According to TipRanks:
→ 26 out of 29 analysts recommend buying MSFT stock.
→ The average 12-month price target for MSFT is $497.
This article represents the opinion of the Companies operating under the FXOpen brand only. It is not to be construed as an offer, solicitation, or recommendation with respect to products and services provided by the Companies operating under the FXOpen brand, nor is it to be considered financial advice.
Microsoft (MSFT)

Stock Market Analysis | TSLA NVDA AAPL AMZN META GOOGL MSFTStock Market Analysis | TSLA NVDA AAPL AMZN META GOOGL MSFT

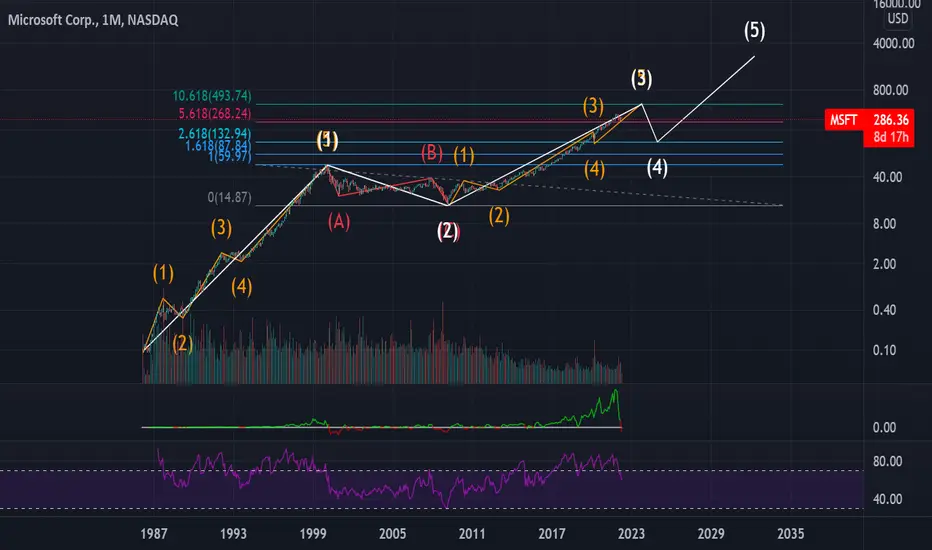
Microsoft Macro BullMSFT is currently in grand wave 3/5!
PT: ~$500
Lengthening cycles & diminishing returns!
2nd Great Recession - Corrective Grand Wave 4 - 60-80% correction
Roaring 20s after - liquidity for final grand wave 5!
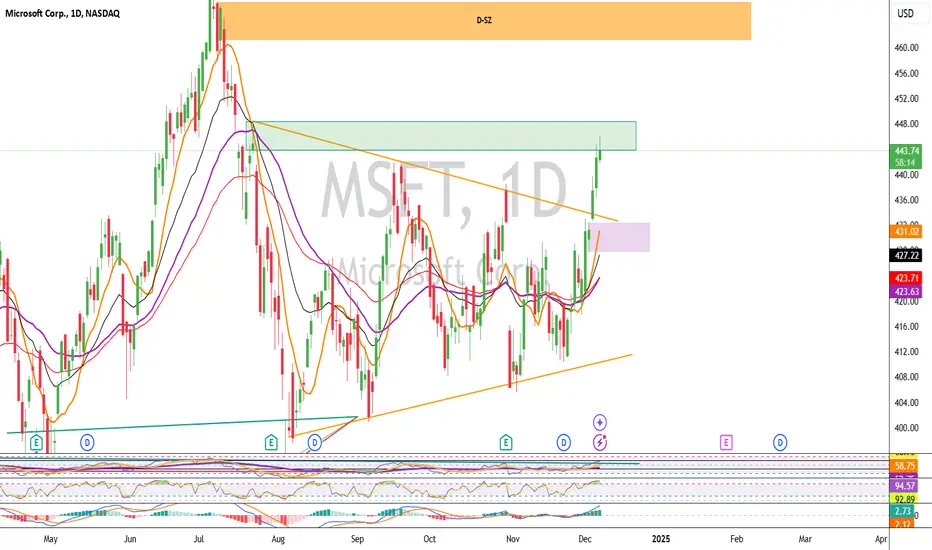
MSFT MORE UPSIDE EXPECTED DEC 6 2024MSFT should go deeper and should break this tested supply and should ultimately go near orange box.
If you have any doubts feel free to leave a comment.
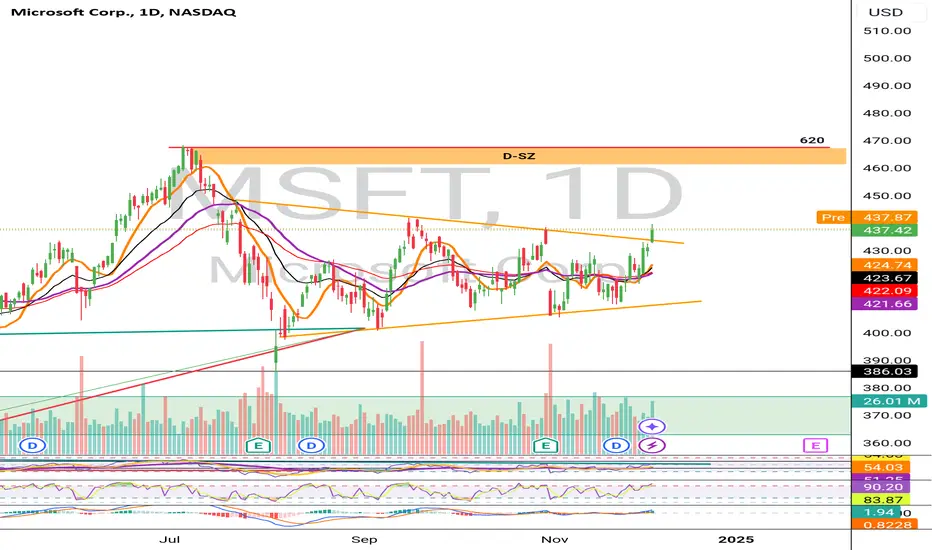
Microsoft - Breaking TradeThere was a great breakout trade opportunity on Microsoft's stock, enhanced by a refined entry strategy. The red zone highlights a key resistance level where the price struggled to break through. A breakout occurred with a strong bullish candlestick, confirming buyers' strength.
Thank you for reading! If you found this content helpful, don’t forget to like, comment, and share the idea. Follow me on TradingView!

MSFT GREEN CANDLE EXPECTEDMsft can easily do 460 from here. I notified msft last mont near it's ER. Feel free to leave a comment if you have any doubts
MSFT Update: Potential ABC Correction
o The weekly chart suggests the completion of a 5-wave impulse to the upside.
o Currently, the price is forming an ABC corrective structure:
o Wave A is complete and has tested the previous demand zone.
o Wave B appears to be forming a rising wedge (bearish continuation pattern).
o Wave C is anticipated to move lower, targeting deeper demand zones (374-360).
o The RSI on the 4H timeframe shows bearish divergence at recent highs, aligning with the corrective wave outlook.
"Be fearful when others are greedy, and greedy when others are fearful." – Warren Buffett
"The goal of a successful trader is to make the best trades. Money is secondary." – Alexander Elder
Stay disciplined and adhere to your risk management rules!
Disclaimer
This idea is for educational purposes only and does not constitute financial advice. Always conduct your own research and consult a financial advisor before trading. Past performance is not indicative of future results.

SNPS LOOKING GOOD TO GO LONG DEC 3 2023SNPS is looking good to go long at cmp. Again current market price trades have a big SLs always.
I will go long for targets of $613
If you have doubts feel free to message me.

Delusional Bulls? $QQQIt's really hard to ignore this. People screaming new highs!! Like what?! This is basic no? We'll find out on the next episode of Dragonball Z.

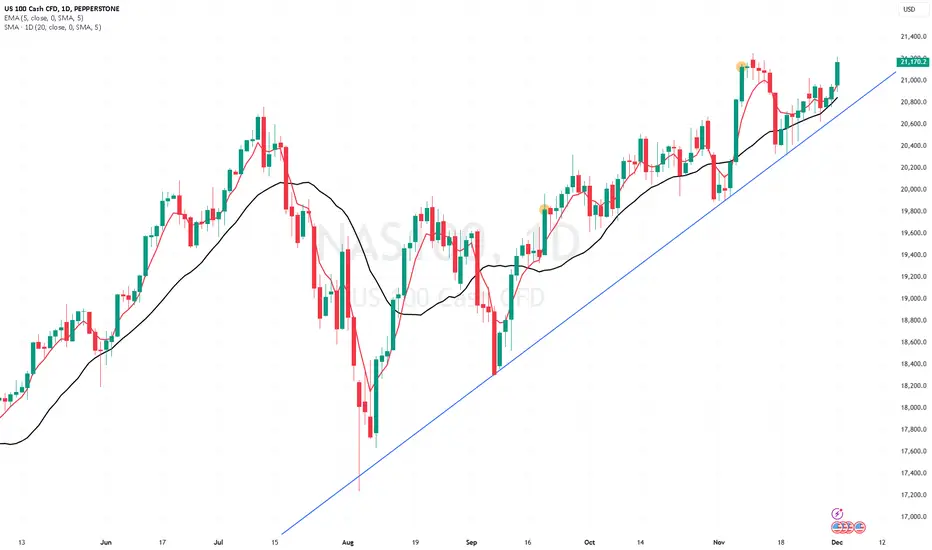
MAG7 breaks to new highs with the NAS100 outperforming The reaction in markets is what interests the most, and on the day, despite US Treasuries finding form, we’ve seen broad USD strength, the S&P500 has pushed to its 55th new all-time high in 2024, while gold and crude are largely unchanged. We also see sizeable dispersions in the daily returns in the crypto space, with XRP and Chainlink arguable the standout plays, with 23% and 41% gains respectively on the day.
In the volatility (vol) space, we see the VIX trading lower at 13.5% - the lowest level since July and at levels more aligned with S&P500 20-day realised vol. Equity hedges have been unwound, which speaks to a market confident of a grind higher into year-end. Another way to visualise the subdued equity vol is in the daily high-low trading ranges, and on the day the S&P500 has tracked a meagre 18-handle range – one of the lowest high-low ranges of the year, and well below the 5-day average of 34-handles.
Removing downside hedges makes sense given the largest drawdown in the S&P500 in Q4 has been 3.1%, and hedges cost money and subtract from performance if equity is moving higher. On the day we’ve seen a solid bid in comms services names (Meta & Alphabet), tech and consumer discretionary – said another way, the MAG7 index (+1.9%) has broken out to a new ATH, with all 7 MAG7 constituents rising on the day. Microsoft and Meta would be my picks that lead us higher from here, with MSFT filling the gap from the 31 Oct, where a break of $432.23 would suggest a continuation rally into $440.
Naturally, when tech and the big discretionary plays are firing up, it’s the NAS100 which has outperformed, and we see NAS100 futures 120p from testing the former ATH at 21,340.
We’ve seen solid moves in European equity too, and notably in the German DAX which is in beast mode and doing everything right technically – happy to hold longs here until the index has a daily close below the 5-day EMA.
French equity is the exception, with the CAC40 closing unchanged, which is quite a solid result given the brewing political angst. Certainly, we’ve seen the political risk expressed in the EUR, which is lower on the day against all G10 currencies, and notably vs the JPY and USD. We can add negative revisions to the French and German manufacturing PMIs, which make for sobering viewing, and the upshot has been broad EUR selling.
EURUSD hit a low of 1.0461 before the buyers stepped in – we can attribute a degree of the move lower to an improved US ISM manufacturing report (at 48.4 vs 47.5 eyed), although we did see some modest USD selling late in the session as Fed gov Waller signalled that he is leaning on a December rate cut and that rates are still “some distance from neutral”. US interest rate swaps now price at 79% chance the Fed cut by 25bp on 18 Dec.
Equity and bond vol may be headed lower, but FX vol is alive and well with EURUSD 1-month implied vol at 8.66% and the 92nd percentile of the 12-month range. Buying EUR vol certainly made sense given the uncertainty of the ECBs (and the Fed’s) next move and the French political risk premium. CAD vols also screen well, with options traders seeing increased movement in USDCAD and AUDCAD.
On the subject of movement, we can always find it in the crypto markets, and while Bitcoin (-2.5%) and Ethereum (-2.7%) take a backseat, it’s XRP that’s getting the lion’s share of trader attention with its punchy 23% rally on the day. The daily chart looks ridiculous and highlights the explosive 450% gain seen since the US election. XRP Volumes are tracking north of SEED_TVCODER77_ETHBTCDATA:5B on the day, which is higher than what’s traded on BTC, with the gains taking its market cap to $134b – the third biggest coin in the crypto sphere.
Grossly overbought, and with a 10-day volatility of 150%, chasing XRP upside from here comes with significant risk and the fact I’m focused on it suggests we’ve likely hit peak sentiment – but as know what is overbought can stay overbought for some time.
Looking ahead, we see a largely positive open for Asia with the ASX200 set to outperform with the index set to open nicely above 8500 and to new highs. Event risk in the session ahead comes in on the light side, with Swiss CPI and US Job openings (JOLTS) the key events on the radar.
Microsoft - Short Term Top Formation!Microsoft ( NASDAQ:MSFT ) could create a short term correction:
Click chart above to see the detailed analysis👆🏻
Almost for the entire year of 2024, Microsoft has been moving sideways and respecting the upper channel resistance trendline. It is quite likely that we will see a correction, considering that buyers are still weak, before we then see the overall trend continuation.
Levels to watch: $350
Keep your long term vision,
Philip (BasicTrading)

Microsoft $MSFT - About to go on another run? 19% UpsideMicrosoft - NASDAQ:MSFT 🖥️
Microsoft with a big statement today for themselves and the MAG7! The runs not over! All MAG7 names are moving higher today and carrying the market.
Is this the beginning of the next leg up for BIG TECH?
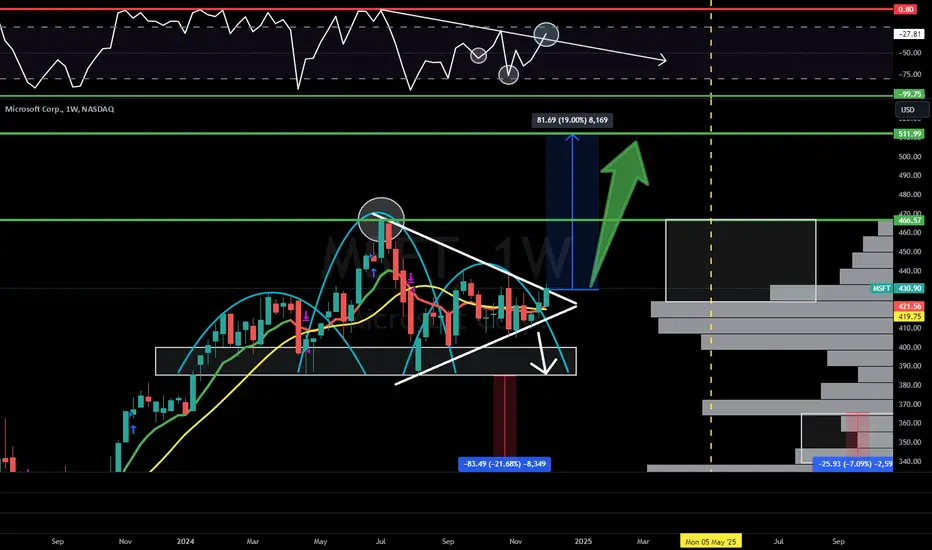
Microsoft was forming a nasty H&S on the charts but has formed a Symmetrical Triangle pattern at then same time and is currently breaking out. They also broke out of the WR% downtrend and are launching off the AVP shelf to make a push back to ATH's.
Finally the H5 indicator is pointing upward and working on flipping back to GREEN.
🎯$466 📏$512 ⏳ May2025
NFA
Looking for a breakout on MSFT! 🔉Sound on!🔉
Thank you as always for watching my videos. I hope that you learned something very educational! Please feel free to like, share, and comment on this post. Remember only risk what you are willing to lose. Trading is very risky but it can change your life!

Stock Market | TSLA NVDA AAPL AMZN META GOOGL MSFTStock Market | TSLA NVDA AAPL AMZN META GOOGL MSFT
Nvidia Stock NVDA Forecast Technical Analysis

Stock Market Analysis| TSLA NVDA AAPL AMZN META GOOG MSFTStock Market Analysis| TSLA NVDA AAPL AMZN META GOOG MSFT

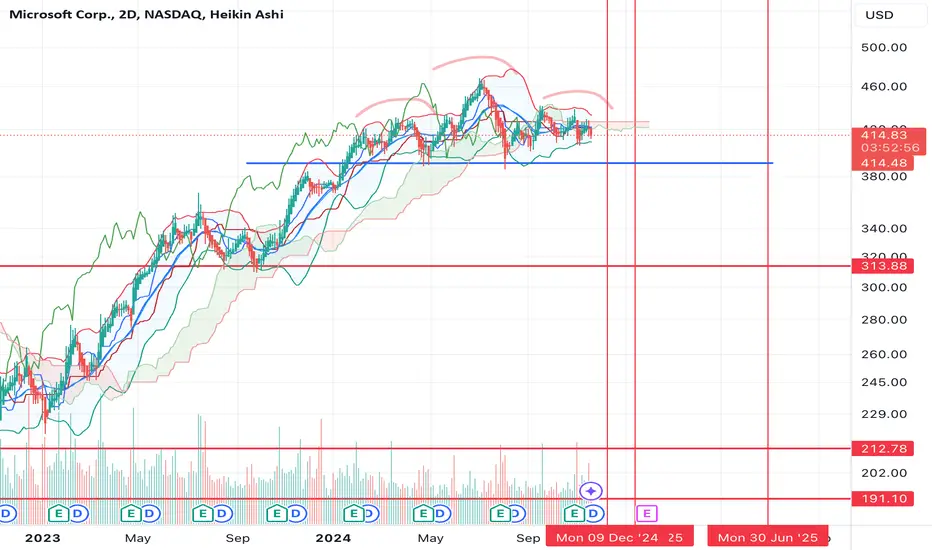
$MSFT H&S top? Large downside move incoming?NASDAQ:MSFT is one of the worst looking tech charts out there.
There's a large H&S top that has formed and if it breaks below that blue trend line it's going to get ugly quickly.
I think it's possible we see a 20%+ decline over the coming months back to that $312-316 level.
1D, 2D, and 1W Heikin Ashi candles are all bearish. It would take a miracle for this stock to turn around.
Let's see if we get a H&S top confirmation.
Stock Market TSLA NVDA AAPL AMZN META GOOG MSFT AnalysisNvidia Stock NVDA Forecast Technical Analysis
Apple Stock AAPL Forecast Technical Analysis
Microsoft Stock MSFT Forecast Technical Analysis
Google Stock GOOGL Forecast Technical Analysis
Amazon Stock AMZN Forecast Technical Analysis

MICROSOFT: Channel Down bottomed. Bullish wave starting to 540.MSFT is neutral on its 1D technical outlook (RSI = 48.171, MACD = -0.910, ADX = 23.585) as since the September 6th Low it has been ranging sideways. Despite the lack of trend, this price action still hit the bottom of the long term Channel Up and technically the new bullish wave should start. The conditions for that are perfect as the 1D MACD just formed a Bullish Cross. The last bullish wave touched the HH trendline of the Channel Up after surpassing the 1.786 Fibonacci extension. That is our current target (TP = 540).
See how our prior idea has worked out:
## If you like our free content follow our profile to get more daily ideas. ##
## Comments and likes are greatly appreciated. ##

Stock Market TSLA NVDA AAPL AMZN META GOOG MSFT AnalysisNvidia Stock NVDA Forecast Technical Analysis
Apple Stock AAPL Forecast Technical Analysis
Microsoft Stock MSFT Forecast Technical Analysis
Google Stock GOOGL Forecast Technical Analysis
Amazon Stock AMZN Forecast Technical Analysis

Microsoft Head & Shoulders, $MSFTMicrosoft, the third largest company by weight continues to struggle since July. The troublesome part is that it appears to be building up a massive head and shoulders pattern all of this year. Additionally, the third shoulder is also looking like a huge bear flag and remains weak compared to the overall market.

Microsoft: Progress!The Microsoft stock has now successfully completed wave B in turquoise at $444.95. So, now we locate the price in the subsequent wave C, which is set to finalize the overarching three-part wave in dark green. This suggests further declines, with an ideal low just below $400. Following the low of the overarching wave , Microsoft should initiate a new upward impulse. While there’s a 25% chance that wave alt. in dark green has already hit its low, this alternative scenario will only be confirmed if the stock breaks above $469.55.

MICROSOFT has bottomed. Dont miss this once/year buy opportunityMicrosoft (MSFT) has been trading within a Fibonacci Channel Up since the October 2022 market bottom following the Inflation Crisis. Since the August 05 2024 Low on the 1W MA50 (blue trend-line), the stock has struggled to get detached from it and stage a sustainable rally.
This prolonged volatility can be seen however on both previous Lows of the Channel Up, while the price was attempting to price a bottom. Technically it is around the same levels as February - March 2023 (again below the 1W MA50).
As you can see, this kind of buy opportunity emerges roughly once a year on MSFT and posts a rise or roughly +50% from the bottom, with the last Higher High priced on the 1.5 Fibonacci extension.
As a result, our long-term Target is now set at $550.
-------------------------------------------------------------------------------
** Please LIKE 👍, FOLLOW ✅, SHARE 🙌 and COMMENT ✍ if you enjoy this idea! Also share your ideas and charts in the comments section below! This is best way to keep it relevant, support us, keep the content here free and allow the idea to reach as many people as possible. **
-------------------------------------------------------------------------------
💸💸💸💸💸💸
👇 👇 👇 👇 👇 👇

IS THIS MAG7 DARLING ABOUT TO CRASH?!NASDAQ:MSFT
🔥 IS NASDAQ:MSFT ABOUT TO FALL OVER 21%?! 🔥
Let's not panic yet, but Microsoft's weekly charts are flashing some intriguing signals. Here’s the lowdown:
As long as NASDAQ:MSFT stays within its symmetrical pattern, we’re in the clear. But if it breaks downward, we’re looking at a potential 6% drop from the Volume profile shelf and possibly a dangerous 22% plunge, breaking the 2024 Head & Shoulders pattern. Enter the "Low Five Setup"—the bearish counterpart to my "High Five Setup."
Key factors to watch:
- Williams %R: Lower High
- MACD: Dangerously close to crossing below the zero line (BEARISH)
- RSI: Below RSI MA with lower highs, at 46—lots of room before oversold
- Trend: Lower high, red through yellow downward move indicating a downtrend on the weekly chart
Microsoft has been Wall Street’s golden goose, untouched by the FUD that hit the MAG7 stocks. Apple had China FUD, Tesla faced the ELON BAD FUD, Google with AI SEARCH FUD, Amazon with spending and margins FUD, Meta with metaverse spending FUD, and Nvidia with growth concerns FUD.
But as Willy Wonka taught us, every golden goose lays a bad egg sometimes. This is a weekly chart setup, so it will take time to play out. No one's immune to Wall Street’s FUD wrath, not even Microsoft. We shall see what happens...
P.S. I’m not in this name yet—just putting it on your radar. We’re early to the party, just like I always am with my setups. If you’re still here, you value solid, well-thought-out market analysis. Props to you!
Have a great Sunday, friends! 👊
Not Financial Advice #HighFiveSetup #LowFiveSetup
