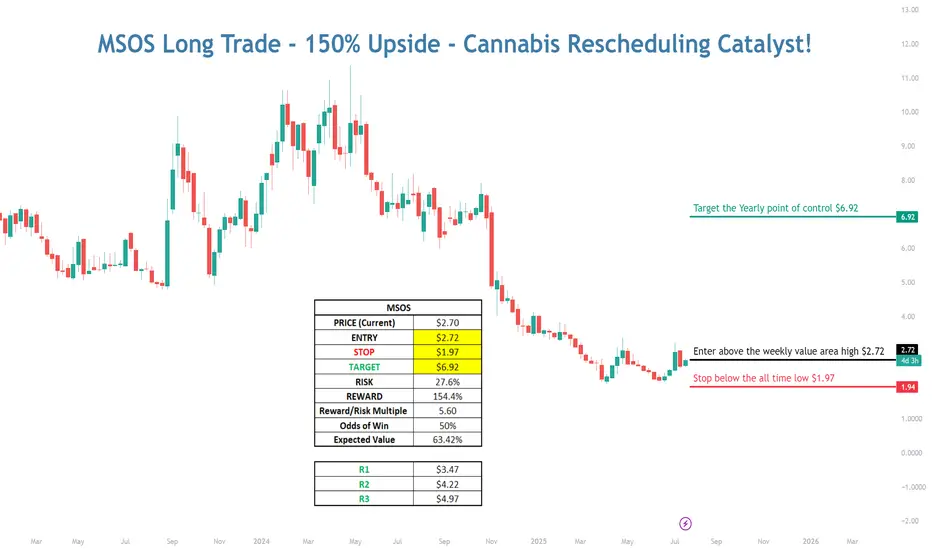
MSOS Long with 150% Upside - Cannabis Rescheduling Catalyst💠 Catalyst : Cannabis is currently classified as a schedule I drug alongside heroin, bath salts, and synthetic opioids that kill thousands every year — all while being safer than Tylenol and legal in over half the country. Cannabis is likely to be rescheduled to a schedule III drug soon after Terry Cole is confirmed as the head of the DEA. The vote to confirm him is expected to take place...TODAY
As a schedule I drug, cannabis companies can’t deduct regular business expenses for tax purposes, have limited access to banking, must transact with customers in all cash, and US multi-state operators are unable to list on the major US exchanges.
Terry Cole will be confirmed as the new head of the DEA, and when he is confirmed, the stalled process to reschedule cannabis from a schedule I to a schedule III drug should resume. If cannabis is rescheduled, that will pave the way for further research, destigmatize it, and open the door to banking and uplisting of US multi-state operators to the major exchanges in the near future.
This trade capitalizes on the fact that investors are not positioned for reform and further positive catalysts. The worst-case scenario is priced into the MSOS ETF, and when good news on rescheduling hits the tape, that should start a NEW Bull market in the MSOS cannabis stocks.
💠 Technical Setup:
Bear Market
• Multi-year bear market throughout the entire Biden administration on promises to reschedule that were never followed through on
• Capitulation when Trump won the election on the prospect of potentially another 4 years of no reform
Bearish to Bullish Technical Transition!
• LT Stage 1A Bottom Signal (Price > 50D SMA)
• ST Stage 2A Breakout (First day Price > 10D EMA and 20D SMA)
• Hourly Chart – Breaking out above Weekly Value Area
• Daily Chart – Trading above the Monthly Value Area
• Overlapping prior monthly value areas in sight!
• VPOC in sight!
• Weekly Chart – Targeting a retest of the Yearly POC
💠 Trade Plan
ENTRY: $2.72 (Break above weekly value area high)
STOP: $1.97 (Below the prior all-time-low)
TARGET: 6.92 (A retest of the yearly point of control from 2024)
RISK: 27.6%
REWARD: 154.4%
R/R Multiple: 5.6X
Probability of Win: 50%
Expected Value: 63.42%
MSOS

MSOS Long with 150% Upside - Cannabis Rescheduling Catalyst💠 Catalyst: Cannabis is currently classified as a schedule I drug alongside heroin, bath salts, and synthetic opioids that kill thousands every year — all while being safer than Tylenol and legal in over half the country. Cannabis is likely to be rescheduled to a schedule III drug soon after Terry Cole is confirmed as the head of the DEA. The vote to confirm him is expected to take place...TODAY
As a schedule I drug, cannabis companies can’t deduct regular business expenses for tax purposes, have limited access to banking, must transact with customers in all cash, and US multi-state operators are unable to list on the major US exchanges.
Terry Cole will be confirmed as the new head of the DEA, and when he is confirmed, the stalled process to reschedule cannabis from a schedule I to a schedule III drug should resume. If cannabis is rescheduled, that will pave the way for further research, destigmatize it, and open the door to banking and uplisting of US multi-state operators to the major exchanges in the near future.
This trade capitalizes on the fact that investors are not positioned for reform and further positive catalysts. The worst-case scenario is priced into the MSOS ETF, and when good news on rescheduling hits the tape, that should start a NEW Bull market in the MSOS cannabis stocks.
💠 Technical Setup:
Bear Market
• Multi-year bear market throughout the entire Biden administration on promises to reschedule that were never followed through on
• Capitulation when Trump won the election on the prospect of potentially another 4 years of no reform
Bearish to Bullish Technical Transition!
• LT Stage 1A Bottom Signal (Price > 50D SMA)
• ST Stage 2A Breakout (First day Price > 10D EMA and 20D SMA)
• Hourly Chart – Breaking out above Weekly Value Area
• Daily Chart – Trading above the Monthly Value Area
• Overlapping prior monthly value areas in sight!
• VPOC in sight!
• Weekly Chart – Targeting a retest of the Yearly POC
💠 Trade Plan
ENTRY: $2.72 (Break above weekly value area high)
STOP: $1.97 (Below the prior all-time-low)
TARGET: 6.92 (A retest of the yearly point of control from 2024)
RISK: 27.6%
REWARD: 154.4%
R/R Multiple: 5.6X
Probability of Win: 50%
Expected Value: 63.42%
$MSOS long term buy hereAMEX:MSOS hit my long term downside target yesterday of $2.46 and I entered a starter position down there. It's up 9% today.
There is still the possibility that we get a final capitulation move from here down to $1.55 or so, and if we get it, I'll add a much heavier position. But basically from here, I think we've bottomed long term and should see a very healthy bull market start which can take us to $29 as a first target and then potentially much higher in the future.
I think this is at least a 10X from a long term hold perspective and potentially much more.

MSOS - Buy The DripLooking to add to my #MSOS position in the event it reaches the .5 Fib. If it breaks lower, would take the loss and average into a longer swing trade position on daily consolidation. The strength of the breakout pivot is impressive. Aggressive bulls will be delighted with broader market strength. AI driving the market, so eyes are there for indications of trend changes.

MSOS - Buy The Dip?MSOS looks poised on a Cup and Handle pattern for a potential breakout. Stop Loss @ 20% in a smaller position size to start. Need to see it play out, but bullish divergence in RSI looks good. .5 Fib - Orange - is a BUY. #MSOS

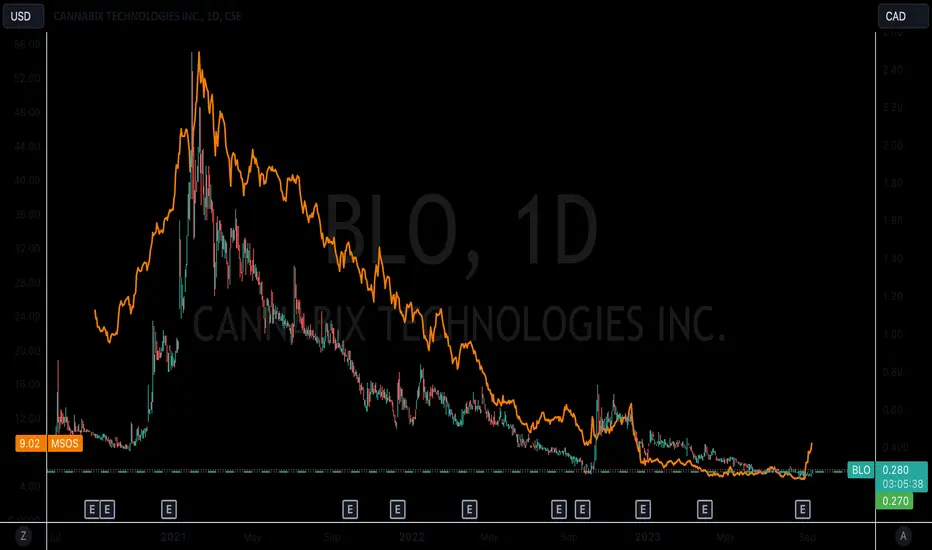
Marijuana Stocks Running, is BLO next?Marijuana stocks have been ripping lately.
There's a correlation between MSOS and Cannabix Technologies.
Will the next boom happen with the marijuana breathalyzer stock?
MSOS wanna get HIGH?erf you find this information inspiring/helpful, please consider a boost and follow! Any questions or comments, please leave a comment! Also, check out the links in my signature to get to know me better!
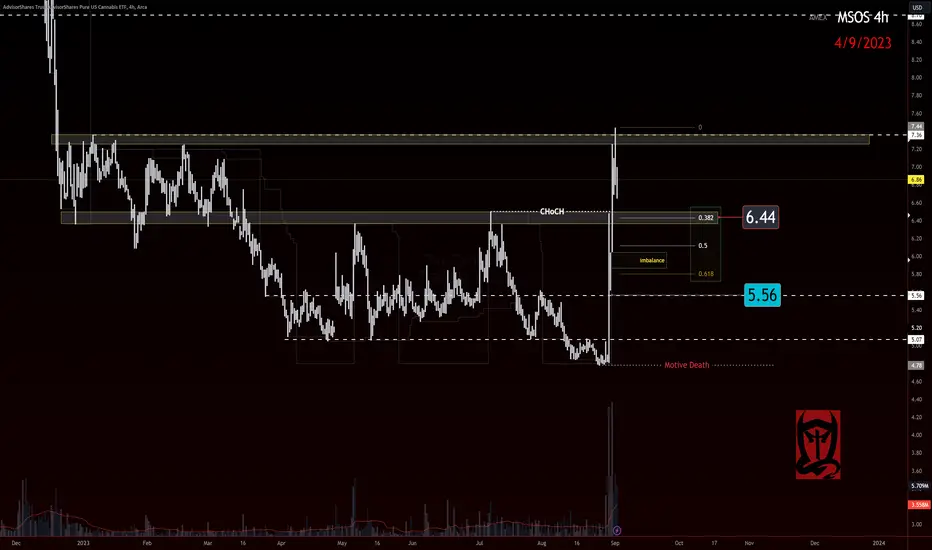
MSOS News pump, so a short based off of past trends could be warrented, but watching for a nice correction and some reactions off of these levels starting at 6.44 and 5.56.
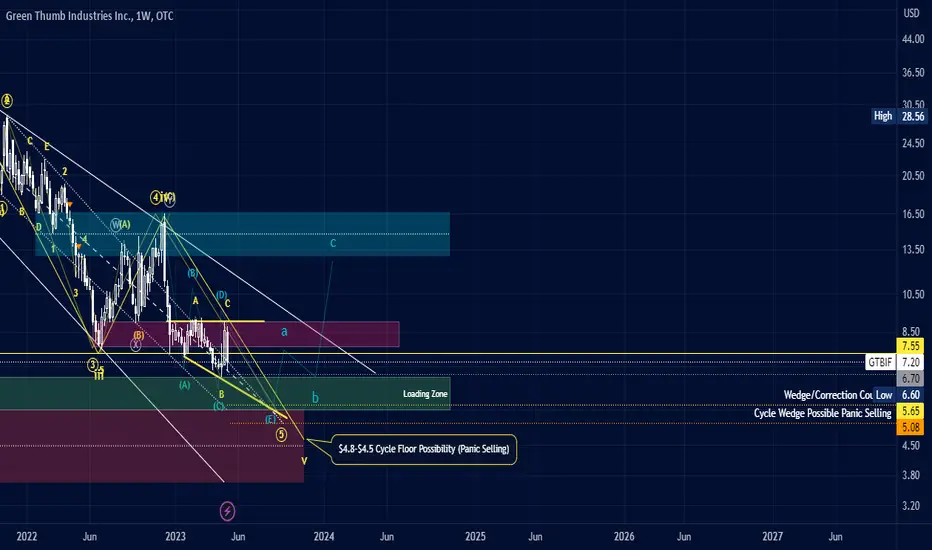
GTBIF - Green Thumb Industries | Pot Stocks Cycle Correction With the recent pump and dump on the Safe Banking rally, it has become visible that most of the pot stocks sector is in a corrective state, setting up for a cycle correction. GTBIF appears to be in a triangle and will look to correct this triangle in the coming weeks/months.
For the most part, I would be alerting myself in the "loading zone" with a potential timeline of mid-late summer.
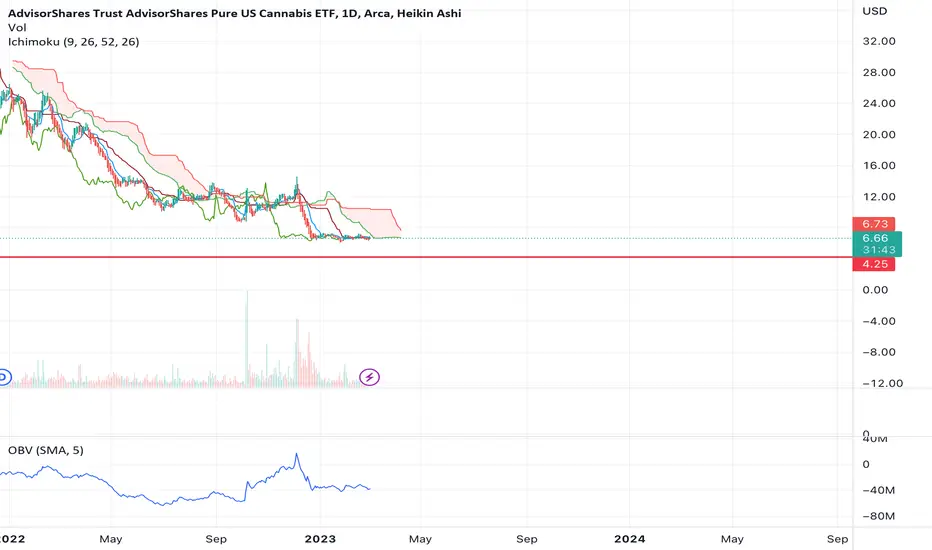
Long $MSOS at $4.25?I've been waiting for $MSOS to bottom because the upside looks amazing once it does. But I think we'll see another leg down before we see the final capitulation.
The reason being the cloud on the 1D timeframe. With that thick of a cloud, almost no chance that price will break through it, and it leads me to think that the next move is likely lower.
Looking at the chart, I think the bottom will be $4.25. I'll likely wait for price to get down to that region, see how it reacts, and if we see a bounce, take a long term position.
Potential break of weekly downtrend on those MJ stocksMJ etf is looking like it broke the weekly downtrend after weekly bullish divergence. However, the week is early and it doesn't mean it can't go lower and retest the trendline under 6 dollars again - it can.
Regardless, MJ stocks might be in a bottoming "area" and are worth a watch. Targets as of now 8.50 and 10.50 on the MJ etf.

MJ stocks - the rally bongTLRY breakout with daily bull divergences and now others catching a bid. Watch the MJ sector for out performance if the stock market has that rally to 4100. Enjoy

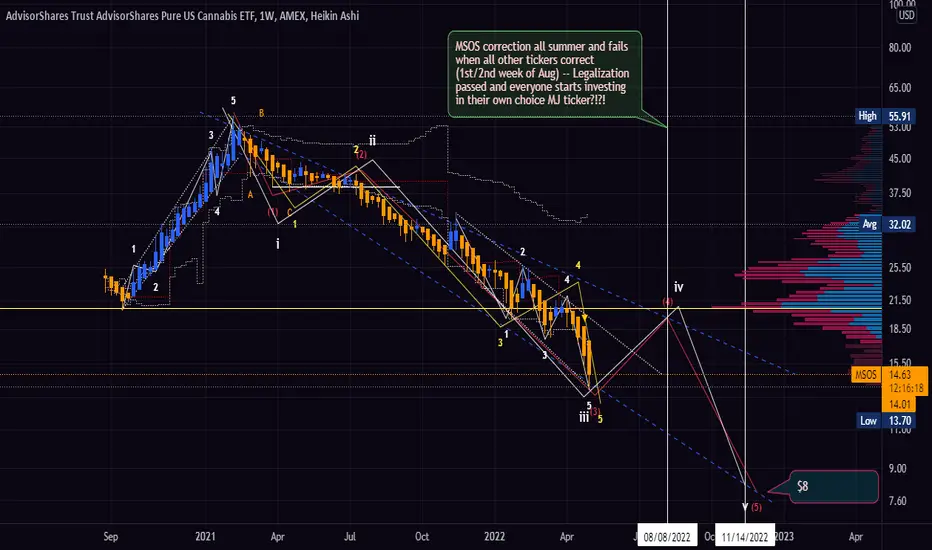
$MSOS - AdvisorShares Pure US Cannabis ETF Chart July 2022AsvisorShares Pure US Cannabis ETF (MSOS) has been on a rampage and never shying away of selling off more than expecting, leaving pretty much the whole cannabis sector carrying the dead weight of a massive basket of synthetic weight, expelling a lot of investors and leaving the rest holding major bags from a short attach which started almost over 2 years ago now.
I believe we are on the last leg down on the current cycle and should see price action levels of $9.24 - $8.30 - $8.04 PT - As mentioned in prior published chart, I see 8/08 - 8/15 being pivotal dates that either will show signs of cycle correction that could lead into impulse or very may be an extension that continues to sell off (starts another 4-5 wave) for another setup around Nov. (which if that fails, rinse and repeat for Jan. and again in April...etc)
If the correction is to turn impulse right now, MSOS would need to close over $13.90 - $14.50, but unlikely event. After the 4th-5th leg down, if the cycle correction is present, there needs to be positive volume bids to close over $1140ish - $11.70(?) after our leg down. That should let the investor(s) know bull trap is likely broken and impulse will proceed. I remain cautious...
I see no let up or difference in the last two months of selling per vol profile. Each month prior averages 30M vol. and nearly 3 weeks of each month shows the volume reaching the 20 day average. The MACD on the daily appears to want to go north and grows closer to crossing the zero-line. But, is still far and below via weekly timeframe. The OBV doesn't show any weekly divergence, something to watch for when getting close to cycle correction.
The last two times I charted MSOS it each time if completely knifed and oversells on the 4th down into the 5th with some of the quickest bull traps, so let's see how this one plays out.

MJ's may be taking out the rally bong soonAll in the video, nothing to buy yet, but there are some signs of strength this week even with the market tanking. Tickers covered - MJ, CGC, TLRY, CRON, MSOS

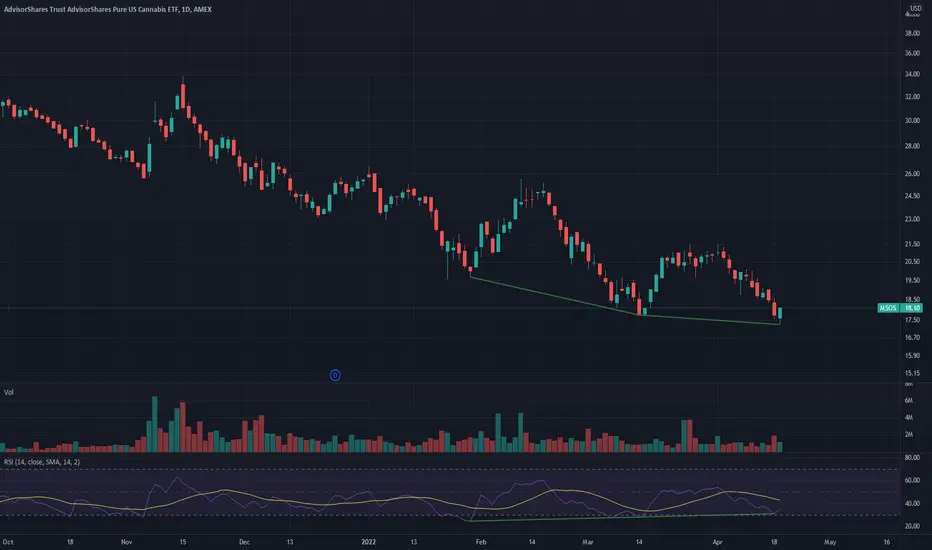
AdvisorShares Pure US Cannabis ETF - $MSOS Chart (Cont.)At the start of the week I hit my weekly semi-cycle 3rd leg and on Tuesday, my interval daily cycle hit the 5th wave. I was looking for a semi-correction, but instead was surprised by Thursday (yesterday) price action sell even more. So, I went back to the drawing board and calculated some more data -- This might be way too early to call, but here we go.
$15.13 was my price target for the start of a semi-correction, selling down to $13.70 was unexpected, but with new data, I think I see what's going on here and makes it a very interesting oversell action.
I believe we will see a summer correction through the next few months, north +$18 to and depending on the force of the correction, it could kiss $20 before finally selling off for the 5th leg, which could see $8 by next year.
With this is motion, I believe while most individual ticker appears to want to correct around the Aug timeframe, MSOS looks to start the sell off of the 4th wave, which I suspect will be the end of the ETF in general as August will bring legalization and allow anyone/everyone to start investing in which ever stock they want, no longer needing such basket holding cannabis tickers. Could be wrong though 🤷♂️
MSOS Bullish Divergence$MSOS bullish divergence on the daily. Need immediate follow-through on this bounce for more conviction.
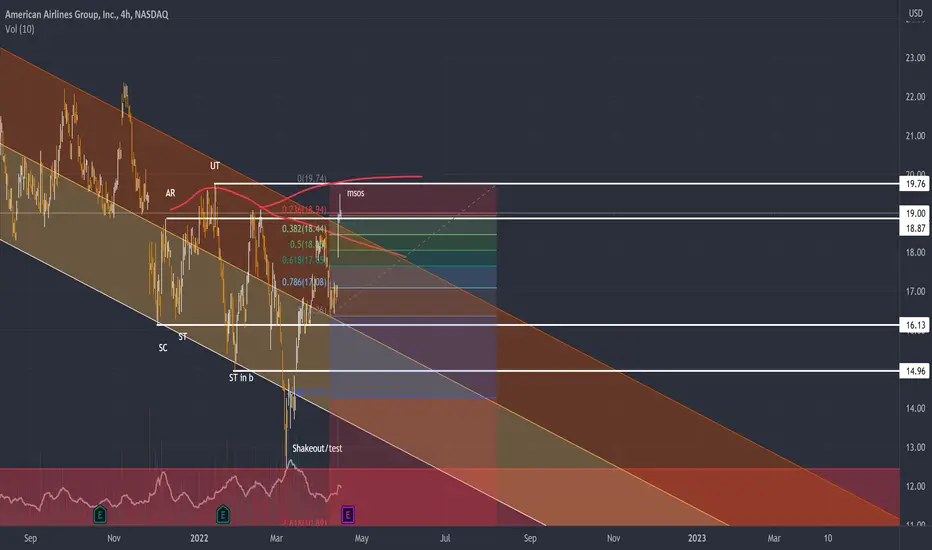
American AirlinesBullish Features on AAL, Showing a minor SOS and creates a probable LPS and continuation upward. Looking for a retracement somewhere on the Fibonacci retracement. maybe around 0.618 and take off upwards
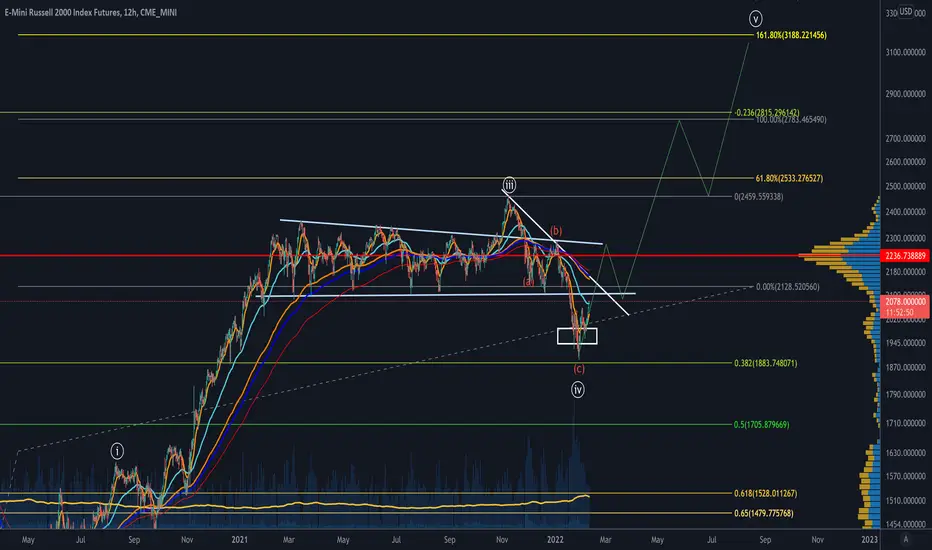
1 to 1 correction complete on IWM, looking for a 5th wave and 3kSo many growth stocks look similar in that we see large flat 3 wave corrective action that appears complete to me. This could be the blow off beginning. Typical for 12 months from tightening to top. Maybe its faster this time we shall see.
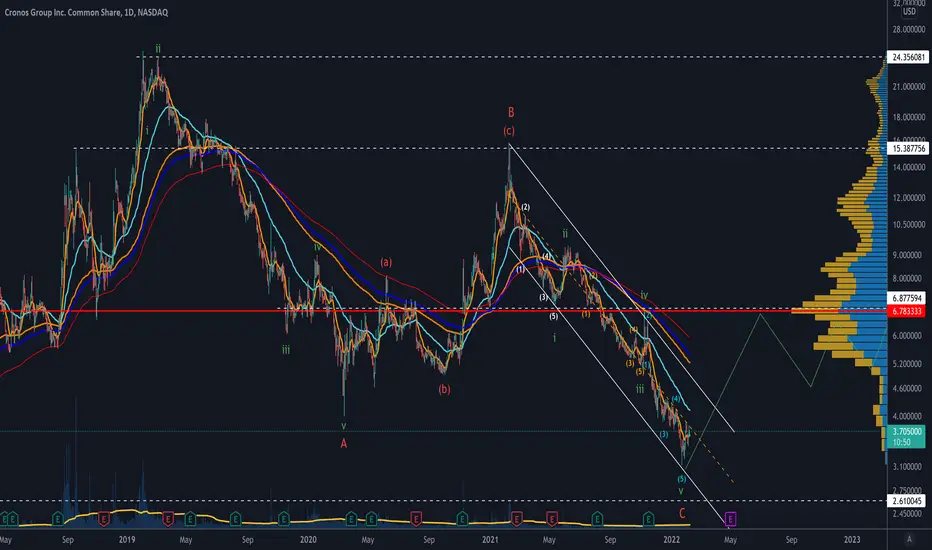
CRON looks CLEAN on the dailyReally like this cron count, it helps me check off another in the list of bull on the cannabis side. I think we have a good year in MJ coming.
MSOS madnessI know no ones wants to touch MSOS or anything marajuana related but i believe it’s always smart to keep an eye out for everything.
I am making a small bet while we hit all time lows. Also, as a technical trader, It’s a big deal for me that this is the first time the RSI has dropped below 30.. Even better, bull volume came in as we hit the all time low while the RSI bottomed.. If Bulls can hold this weekly close and keep the RSI above 30, I will be a believer that MSOS can get high. Pun intended.
Not financial advice.
Happy Trading.


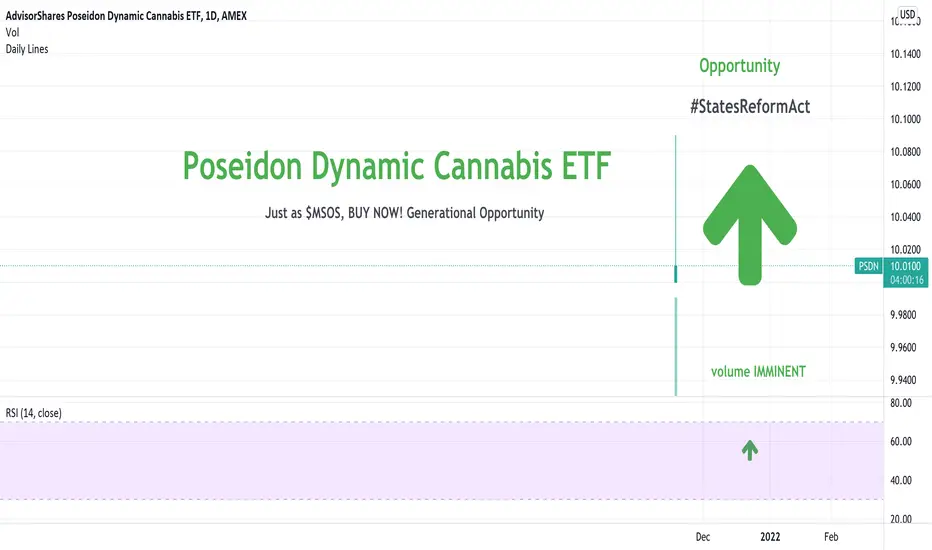
Poseidon Dynamic Cannabis ETF $PSDN - BUY NOW - MSOgang#StatesReformAct FEDERALIZATION Bill in Congress. Cannabis legalization is BiPartisan. $PSDN has the best $MSOS advisors lined up to make great investing decisions in the ever growing cannabis sector.
The US sector is on fire. Women & minority leaders will be sought. Diversity is great for business. $PSDN & $KERN. Recommend.
Compliance Data SOFTWARE. #thegem (no shipping hassles)
US Cannabis Council Board Chair, Akerna CEO, Jessica Billingsley. $KERN
GL #cannabiscommunity #valueinvesting
FINALLY WINNING! Jobs & Justice
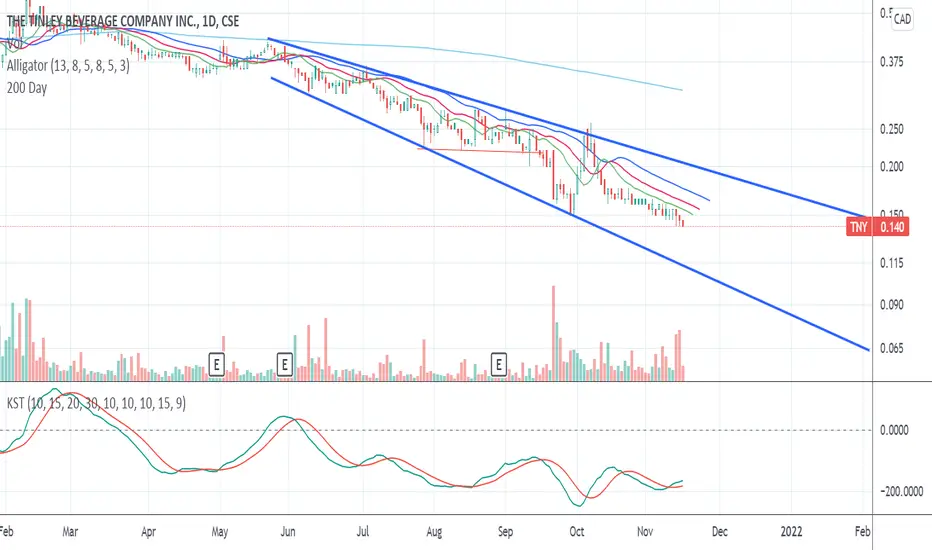
Descending Broadening Wedge for TNY?!?!?37c in the next 3-6 months.
Possible decline to 6.5c before a reversal.
Bullish cross on the KST!
Tinley's trading in a descending broadening wedge.
With the Descending Broadening Wedge formation, we are looking for two touches to each trendline.
Both the upper and lower trendlines should fall. The lower trend line should fall more steeply than the upper trendline thus forming the broadening wedge.
Tall and wide patterns work better than short and narrow patterns.
Descending Broadening Wedges tend to breakout upwards.
Swing traders can trade the pattern from top to bottom and from bottom to top.
After the trendlines are formed, as soon as the price touches the upper trendline go short. Cover this short (exit the trade) when the price reaches the lower trendline.
As price touches the lower trendline go long (buy). Place your stop below the lower trendline. Trade price upwards to the upper trendline. Exit this trade here.
When price breaks the upper trendline and closes above it this signals a breakout. Go long (buy) here.
The target is the first (highest) high in the pattern. Which is around 37c CAD for TNY.
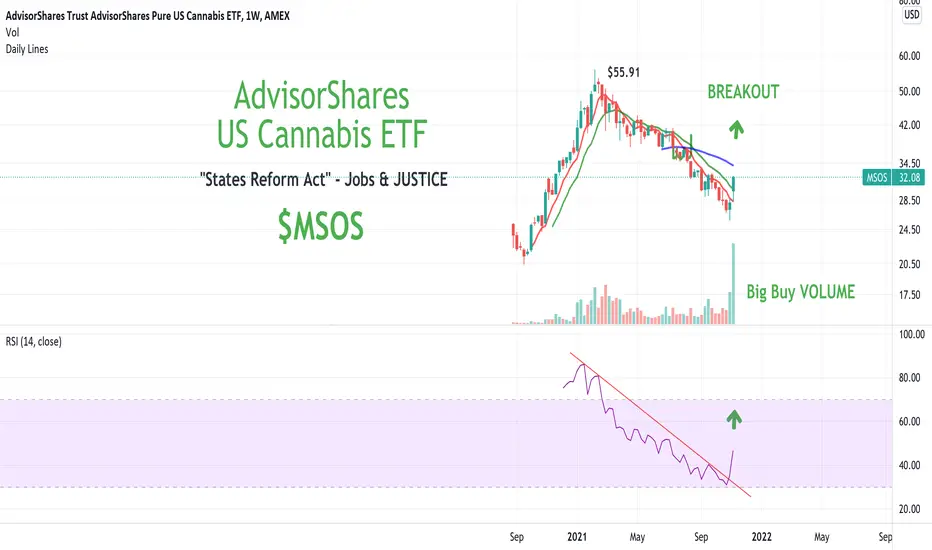
$MSOS AdvisorShares - US Cannabis ETF - BreakoutON VOLUME. Volume precedes price. A move without volume is suspect (see #shib).
States Reform Act on Monday should be a headliner for sure. Lot's of legislation to look forward to.
#cannabisreform
#thegem
Jobs & Justice
Akerna $KERN has the data. Enterprise Solutions, Compliance SOFTWARE
CEO Jessica Billingsley is Chair of USCC, United States Cannabis Council.
$ITHUF $GNLN $GPRO $FCEL $PLUG $GM $VIXY US5Y UP. Large cap #stonks & #cryptocrash to #cannabisreform
The future.