Why Pay $250K for a $115K Bitcoin? Welcome to Strategy (MSTR)This is already the third article I’ve written about Strategy (formerly MicroStrategy), and for good reason.
You don’t need to be a financial expert to ask: why buy a stock that simply mirrors Bitcoin’s price — but at a massive premium?
No matter how sophisticated the explanations may sound, or how many times you’re told that “if you don’t understand it, it must be brilliant,” the reality is much simpler — and much more absurd.
Buying Strategy today is like paying $250,000 for Bitcoin while the actual market price is $115,000.
It’s not about complexity. It’s about common sense.
I won’t dive too deep into it — no need to fight “financial sophistication” with even more sophisticated words.
The point is simple: buying Strategy is like paying me $10,000 just so I can hold your $10,000 and call it an “innovative capital deployment strategy.”
Sounds smart, right? Until you think about it for more than five seconds.
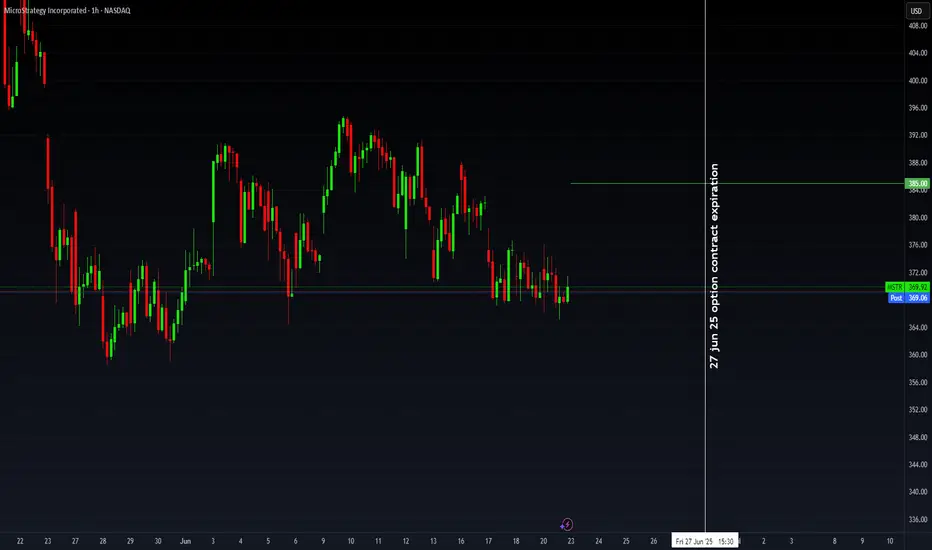
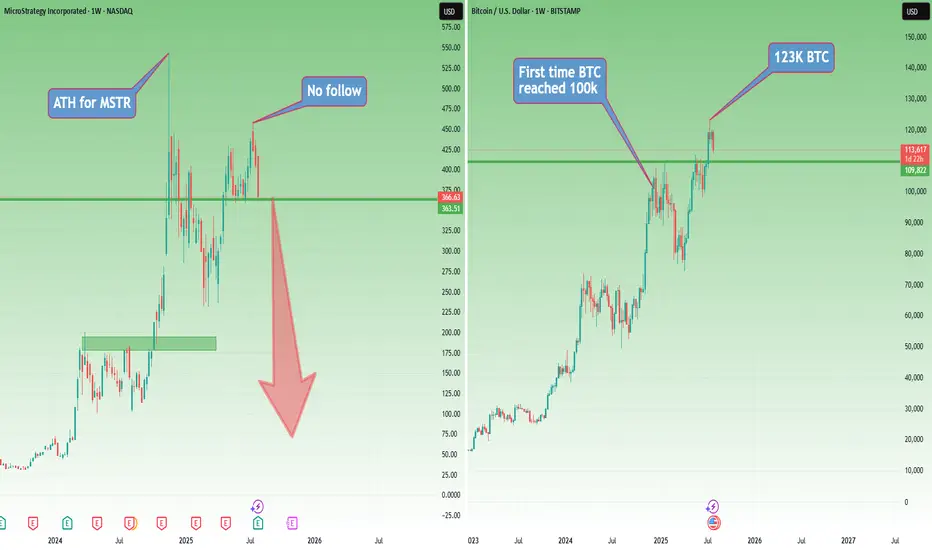
Now let’s look at the posted charts — simple and visual.
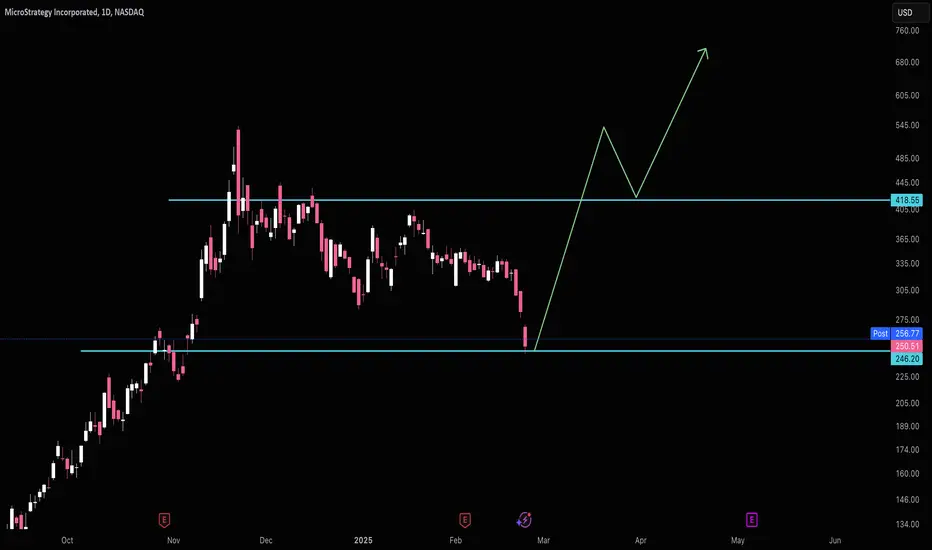
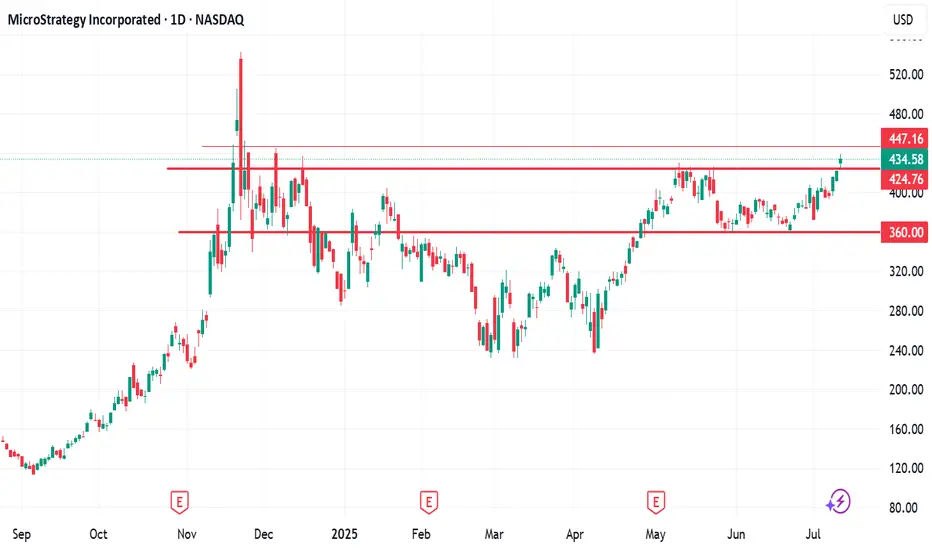
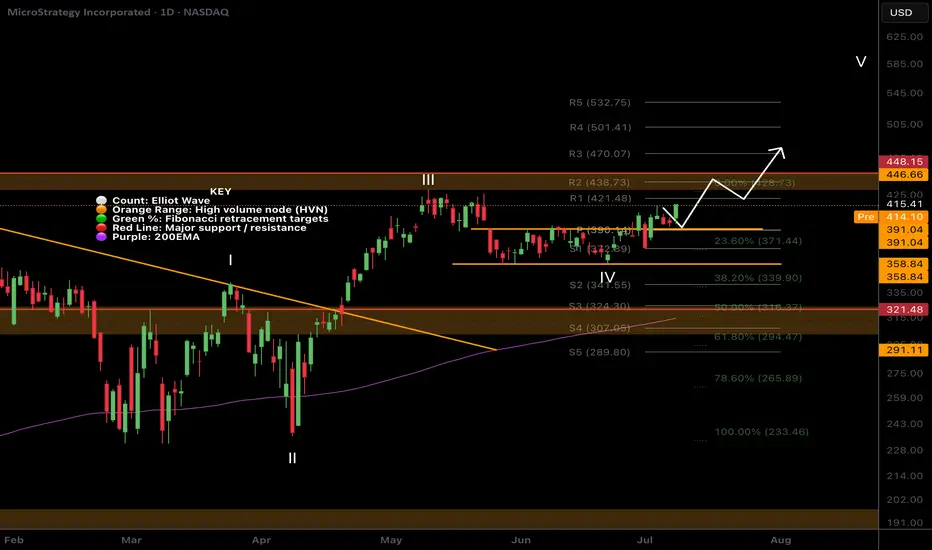
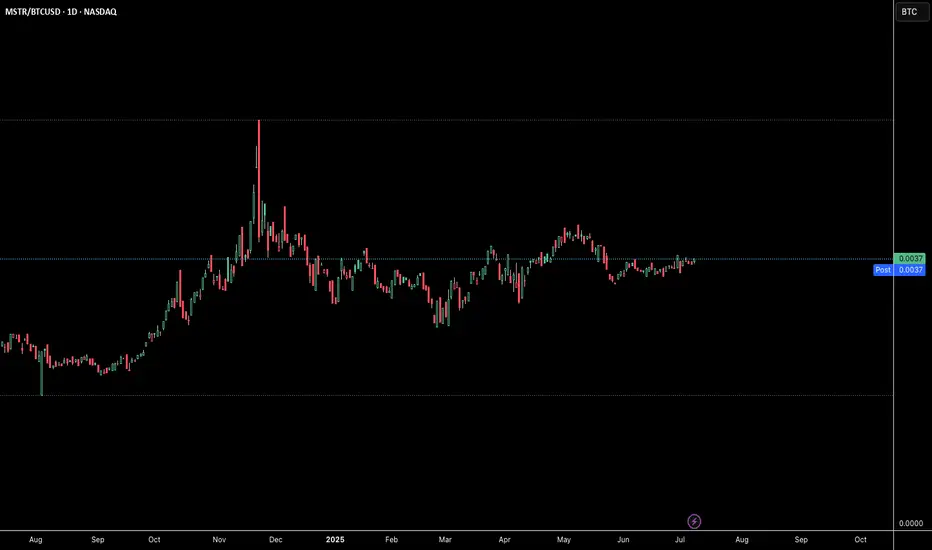
Strategy (MSTR) hit its all-time high in November 2024, right when Bitcoin first reached $100,000.
Then came a sharp correction of more than 50% for the stock.
Fast forward: even though Bitcoin went on to make new all-time highs, Strategy didn’t follow, it seems like people were finally starting to wake up.
When BTC peaked again in mid-July 2025, Strategy only managed to reach $455 — well below its November ATH.
Since then, BTC has pulled back about 10%, while Strategy dropped around 20%.
So much for the “outperformance” argument.
And here’s where things get even harder to justify:
In the past, some institutions bought MicroStrategy because they couldn’t hold Bitcoin directly. Fair enough.
But now? Spot Bitcoin ETFs are live, regulated, widely available, and charge tiny fees — without the leverage, dilution risk, or premium baked into Strategy.
So what’s the excuse now?
Where are we now?
At this moment, even though I’m not too happy about this week’s Bitcoin weakness, I remain cautiously bullish — emphasis on cautiously.
But let’s entertain a scenario.
If Bitcoin continues to correct, Strategy is sitting right on support. And if BTC breaks lower, Strategy will almost certainly follow — breaking support and heading toward the next level.
That next support? Somewhere around $240–250, depending on how deep the Bitcoin pullback goes.
But here’s the real question:
What happens if Bitcoin enters a true bear market?
Will Strategy — which just recently rebranded from MicroStrategy — be forced to rebrand again as…
NanoStrategy?
Just a Saturday thought.
MSTR
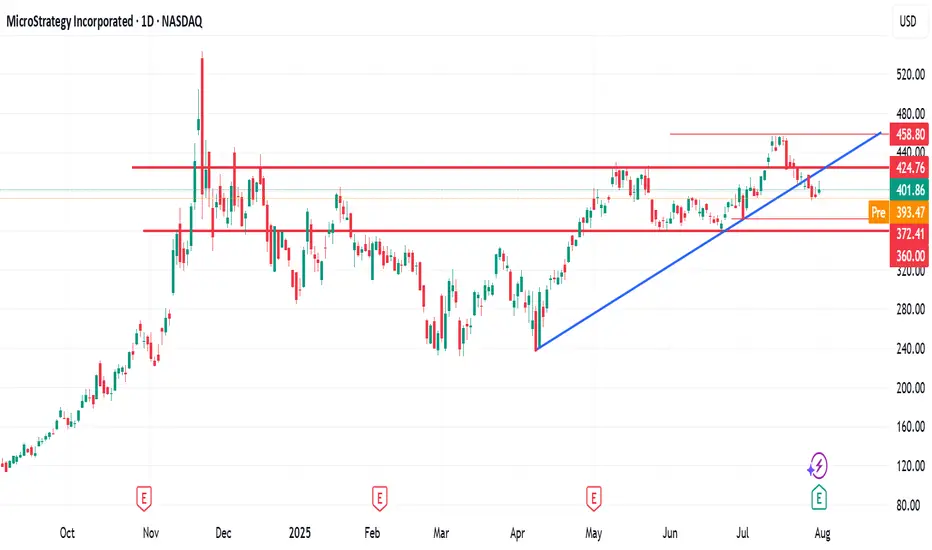
$372 - $360 is imminent$372 - $360 is imminent.
Following a break below the highlighted key support TL, MSTR fall to as low as $370 to $360
MSTR....Free FallingMSTR looks like it is nosediving straight down. When one is bullish on BTC, it is important to also understand that volatility is a big part of the game - a very costly game with many losers! BTC has past several key TAs and we only just started - crossing $300 is in the horizon. Always do your own due diligence, and received ultrabear signal earlier to exit, and cut your losses soon.
Strategy Hit SupportMSTR should easily hold $246 and make its way back up to $418 and form it's next support there.
Good luck!
MSTR WEEKLY OPTIONS SETUP (2025-07-28)
### 🔻 MSTR WEEKLY OPTIONS SETUP (2025-07-28)
**Bearish Divergence with High Confidence — Time to Strike with a PUT?**
---
📊 **Momentum Recap:**
* **RSI:** Bearish 📉
* **Volume:** Weak (institutional exit risk)
* **Options Flow:** Mixed (calls > puts, but no alignment with price)
* **Sentiment Models:** Split 4:1 → **Only Claude/Anthropic** goes bearish with conviction
🧠 **Model Consensus:**
> “Momentum is weak, volume fading, and no upside confirmation = bearish edge.”
---
### ✅ SETUP OVERVIEW
* 🔍 **Trend:** Bearish (declining RSI)
* 📉 **Volume:** Weak = reduced institutional conviction
* 💬 **Options Flow:** Bullish bias, but **contradicts price trend**
* ⚙️ **Volatility:** Elevated, potential reward for directional plays
**Overall Bias:** 🔴 *Moderately Bearish*
---
### 💥 TRADE IDEA: MSTR \$400P
* 🎯 **Strategy:** Long Weekly Put
* 🔻 **Strike:** 400.00
* 📆 **Expiry:** Aug 1, 2025
* 💸 **Entry Price:** \$8.65
* ✅ **Profit Target:** \$12.50
* 🛑 **Stop Loss:** \$4.00
* 📈 **Confidence Level:** 72% (backed by Claude model)
* 📉 **Breakdown Trigger:** Below \$405 confirms bearish flow
* ⚠️ **Invalidation:** Break above \$415 → exit early
---
### 📦 TRADE\_DETAILS (Backtest/Algo Ready JSON)
```json
{
"instrument": "MSTR",
"direction": "put",
"strike": 400.0,
"expiry": "2025-08-01",
"confidence": 0.72,
"profit_target": 12.50,
"stop_loss": 4.00,
"size": 1,
"entry_price": 8.65,
"entry_timing": "open",
"signal_publish_time": "2025-07-31 09:30:00 UTC-04:00"
}
```
---
### 🧠 TRADE INSIGHTS
* 🟥 4/5 models say **no trade** due to signal divergence
* 🧠 **Claude’s bearish thesis = cleanest directional setup**
* 🚨 Volume + RSI combo = downside confirmation
* 🧭 Watch key price reaction zones: **\$400–\$405 (support)** / **\$415 (resistance cap)**
---
**#MSTR #PutOptions #WeeklyTrade #BearishSetup #OptionsFlow #QuantTrading #ClaudeModel #MarketMomentum**

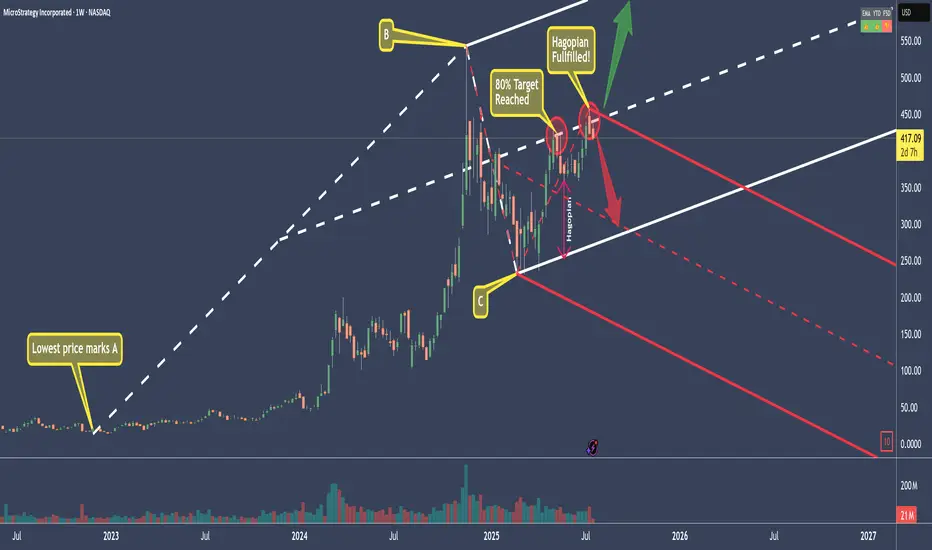
MSTR - Microstrategy Short...for now.The White Fork is created by choosing point A, which must be the lowest price before the swing.
B and C are the natural high and low of the swing we want to measure.
What this gives us is a Pitchfork that projects the most probable path of price.
Additionally, with the three lines that make the Fork, we have the natural extremes above, below, and the center—the mean.
We can see that price started to rise in March 2025.
The 80% rule states that price will reach the Centerline around 80% of the time.
And as we see, it did this time as well. Price reached the CL (Center Line), and immediately the big whales dumped positions.
Then price fell—only to be picked up before reaching the Lower Line, also called the L-MLH or Lower Median Line Parallel.
When price can't make it to this (or any of these) lines, we call this a 'Hagopian,' because it follows 'Hagopian's Rule.' This rule says that if price can't reach 'the line' (the L-MLH in this case), there is a high chance that price will reverse in the previous direction (up in this case), and even go further than where it came from (the Centerline).
And as we see, price indeed traded upwards—beyond where it came from—and overshot the Centerline (CL).
Unfortunately for long-positioned traders, the gas in the goose was empty, and price now starts to head south again, missing the target, which would have been the U-MLH (Upper Median Line Parallel).
So, the open happened below the CL!
If we also see a close this week, I'm ready to initiate a short trade.
Why?
Well, as before, Hagopian’s Rule applies—an indication that price will trade further down than where it came from, which is below $361.
And since we know that the natural target is the Centerline about 80% of the time, we have a heck of a good chance that we’ll be happy campers in a couple of weeks. :-)
With a risk/reward of about 2 to 3, and such a high chance of a profitable trade, I’ll sleep like a baby in the coming weeks.
The trade idea would be cancelled if price closes above the CL this Friday.
Let’s stalk it closely...
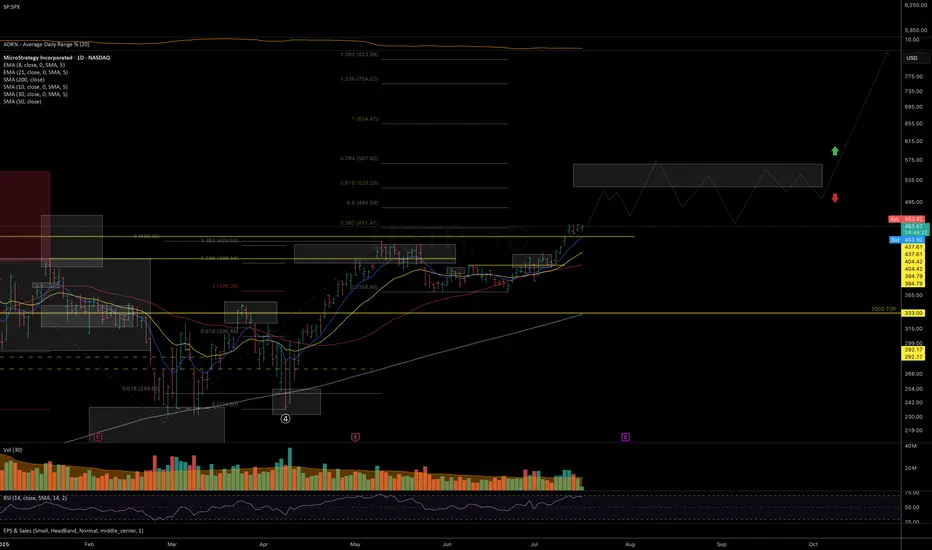
MSTR – On the Path to New ATHI was initially skeptical about the recovery structure unfolding since the April lows — it looked like a possible macro lower-high before deeper correction (as outlined in my previous idea).
However, given the strength in underlying #BTC price action (covered in my recent video-idea on crypto trend structure) and clear signs of constructive consolidation and accumulation during the July breakout, Isee strong odds for follow-through toward the 520–570 resistance zone in the coming weeks.
This move may align with CRYPTOCAP:BTC testing its macro resistance near 130K (see my macro BTC analysis on the idea section).
If NASDAQ:MSTR can break above 570 and sustain a close above it, it opens the door to a potential immediate follow-through toward the 650–755 macro resistance zone. But a scenario for more prolonged consolidation around 570 would in fact serve as a solid base for more stable and prolonged next long-term leg higher.
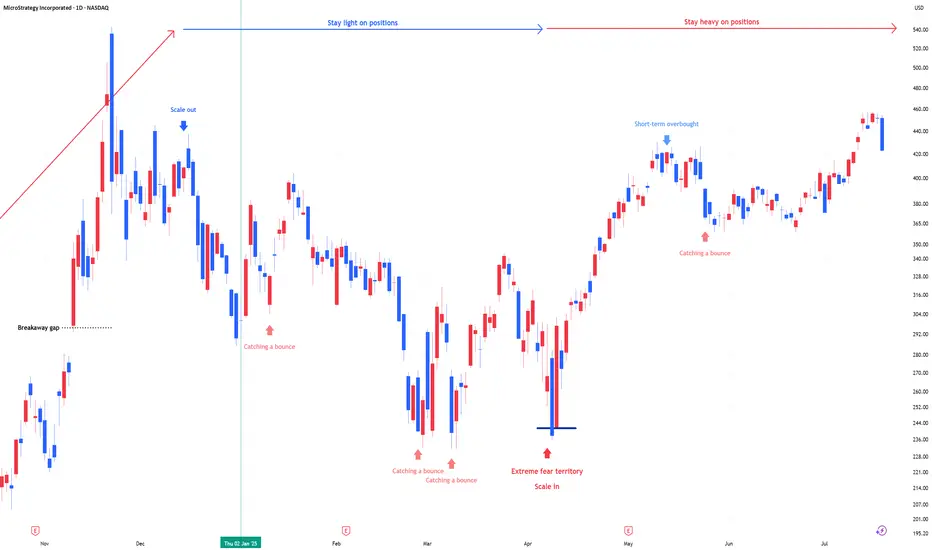
MSTR: Stay heavy on positions"MSTR position size is adjusted in line with US market and bitcoin signals for underweight or overweight allocations. During panic phases, 2x leverage ETFs are on the table."
Stay heavy on positions
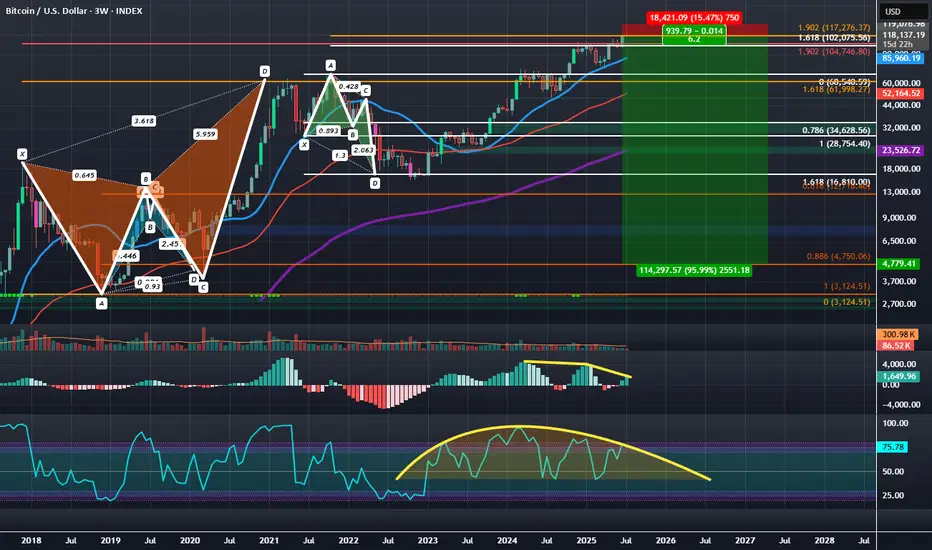
BTCUSD: Bearish Logscale Butterfly with Bearish RSI DivergenceBitcoin has been setting up at the log adjusted 1.902 HOP for a Type 2 retest of the Logscale Bearish Butterfly for the last few months but recently pushed a bit above it and appears to be settling at the linear 1.902 HOP of the local price around the $118,000 area. Between $104,000 and $118,000 is a zone of linear of logscale Fibonacci confluence pointing towards the being the area to look for a more major downside reaction than we got off the initial Type 1 Reaction 1.618 PCZ reversal in 2021.
The most recent push to the linear 1.902 seems to have allowed the structure of the RSI to develop a more Bearishly Distributive and Divergent curve, while the MACD is in the process of developing a 2nd layer of Bearish Divergence. Ultimately at these highs we'd like to see the RSI weaken further as price begins to settle back within the 1.902 bearish zone of confluence before being more sure of downside.
Additionally, during the push higher, longer dated bearish call interest came in around the 123-125k levels which to me signals a newly formed hard resistance that will be hard to gap over and will make failure here more likely. I think if we do see failure we can of course fill the CME gap down at 91.8k, but ultimately the true first target is down at 30k with max targets down near the 0.886 around $4.8k and the 100 percent retrace down at around $3,123.51 over the coming quarters.
Taking into account the wide range in downside exposure I think the best and safest way to speculate on this downside would be through the buying of the March, 27th, 2026 Puts at the $95,000 strike or the closest IBIT equivalent March, 20th, 2026 Puts at the 58 strike this will give plenty of time, as well as plenty of range for the puts to appreciate 10's of thousands of dollars in value as BTC trades down into the targeted zones below it.
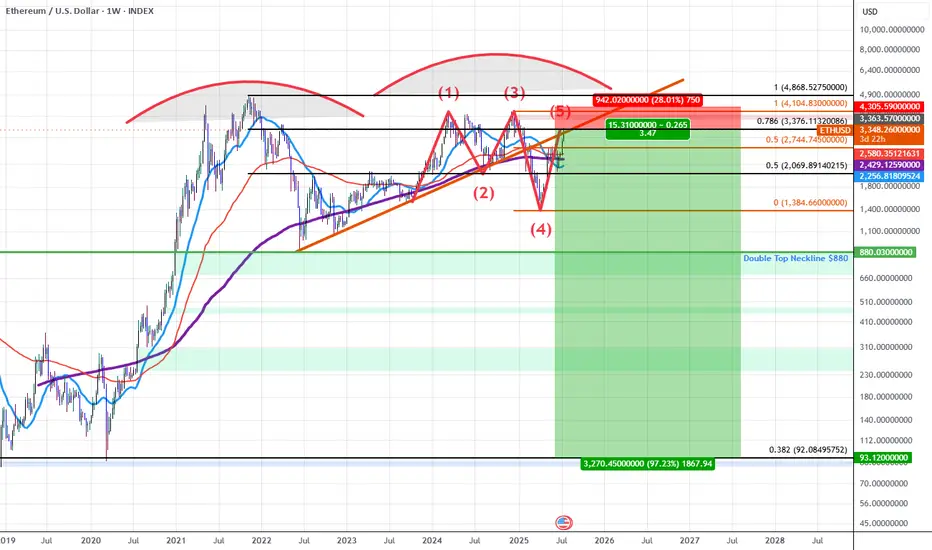
ETHUSD: Double Top into A Bearish 5-0 Breakdown (Extended)Updated Commentary: ETH has extended a bit further than projected as the Pattern Completed at the 0.618 but ETH gapped into the 0.786 instead. The gap up aligned with an upside gap fill on the CME futures as well as a gap fill on the grayscale ETH futures ETF $ETHE. The easier move from here to simply add to the ETH shorts and adjust the stop to be above the previous highs while sizing up at the 0.786 and playing off this gap higher as an anomaly. Beyond this, my view on ETH at the current 0.786 retrace remains the same as the original Idea posted as ETH rose into the initial 0.618 PCZ the details of which I will also include once again below as it still remains relevant.
ETH for the last 5 years has been developing a Double Topping pattern which has put in a series of lower highs during the most recent 2nd run up. As we've confirmed these lower highs we've broken down below trendline and are finding resistance at the trendline which happens to have confluence with the PCZ of a Bearish 5-0 wave formation near a 0.786 retrace.
As we begin to find weakness and Bearish price action begins I suspect price will make it's way towards the neckline of the double top aligning with the $880 price level if ETH breaks below that level there will be no significant support until it reaches the all-time 0.382 retrace down at around $92.10.
In short it seems ETH is in the early stages of a macro breakdown which could result in value declines greater than 80%.
I also suspect that we will see many of the assets that ran up significantly going into this week to sharply reverse those run-ups as this week comes to a close and the new week begins mainly due to the effects of OpEx, this includes: Bitcoin, MSTR, SOL, XLC, META, and BTBT. Long-dated Put accumulation on these assets at these levels is far easier to manage than naked short positions and that's how I will go about positioning here.
MSTR stock has seen a strong rally since JuneSince June, MSTR stock has seen a strong rally—rising from the mid‑$300s to above $430—driven by a few key factors:
Bitcoin’s continued ascent has fueled sentiment. Bitcoin recently hit fresh record highs (above $118K), driven by a weakening dollar and bullish macro trends, which in turn boosted bitcoin-linked equities like MicroStrategy.
In short, MSTR’s rally since June has been largely Bitcoin-driven: a powerful combination of rising crypto prices, ongoing BTC purchases, proactive capital raises, and positive analyst sentiment creating a bullish feedback loop.
Let me know if you'd like a breakdown of Bitcoin’s trend or deeper insight on MSTR’s financing strategy.
$447 will be my next buy TP.
Please, share your thought, like, share and follow me.
MicroStrategy ($MSTR) – Bitcoin Proxy Setting Up AgainMicroStrategy Incorporated NASDAQ:MSTR remains the definitive institutional proxy for Bitcoin exposure, uniquely combining its enterprise software operations with a high-conviction, leveraged Bitcoin accumulation strategy. Its $1.42B BTC purchase in April 2025 further cements this thesis, making MSTR a prime vehicle for traders seeking amplified BTC exposure via equities.
Since our May 5th analysis, MSTR has rallied ~14.61%. We’re now eyeing a re-entry opportunity on a pullback to the $394–$387 zone, aligning with technical support and previous consolidation.
🎯 Bullish targets remain unchanged: $490.00–$500.00, backed by Bitcoin strength and MicroStrategy’s unwavering strategy.
🔁 Re-entry: $394–$387
🟩 Targets: $490–$500
#MSTR #Bitcoin #CryptoStocks #BTC #StockMarket #TechnicalAnalysis #MicroStrategy #HighBeta #CryptoExposure #TradingSetup

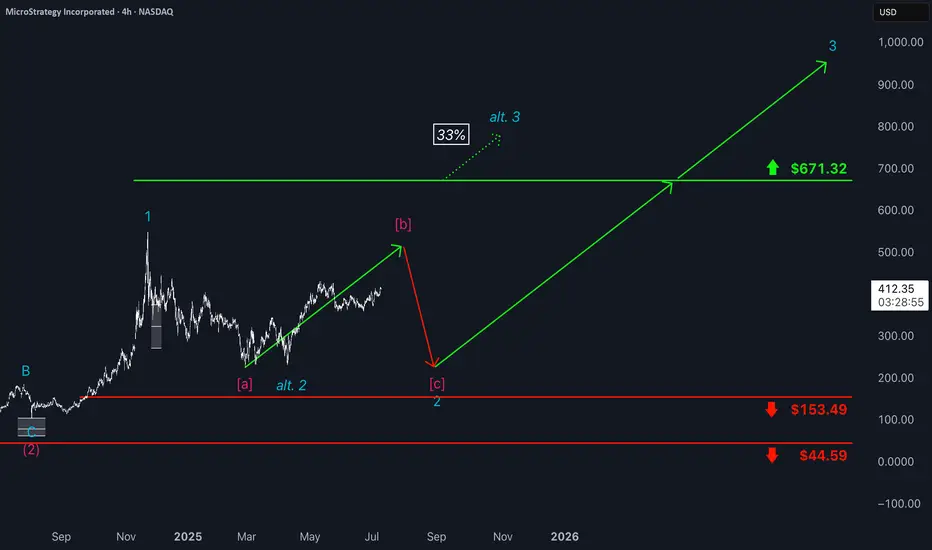
Microstrategy: Renewed Upside MicroStrategy has continued to face downward pressure recently but is now showing more decisive signs of an upward move. We still see greater upside potential in the current magenta wave , though we expect the peak to form below resistance at $671.32. Afterward, the bearish wave should complete turquoise wave 2—while still holding above support at $153.49. Wave 3 should then usher in a longer upward phase, with momentum likely to ease only well above the $671.32 level. At the same time, there remains a 33% probability that the stock has already entered this upward phase. In that scenario, turquoise wave alt. 2 would already be complete, and the price would move directly above $671.32 as part of wave alt. 3.
📈 Over 190 precise analyses, clear entry points, and defined Target Zones - that's what we do.
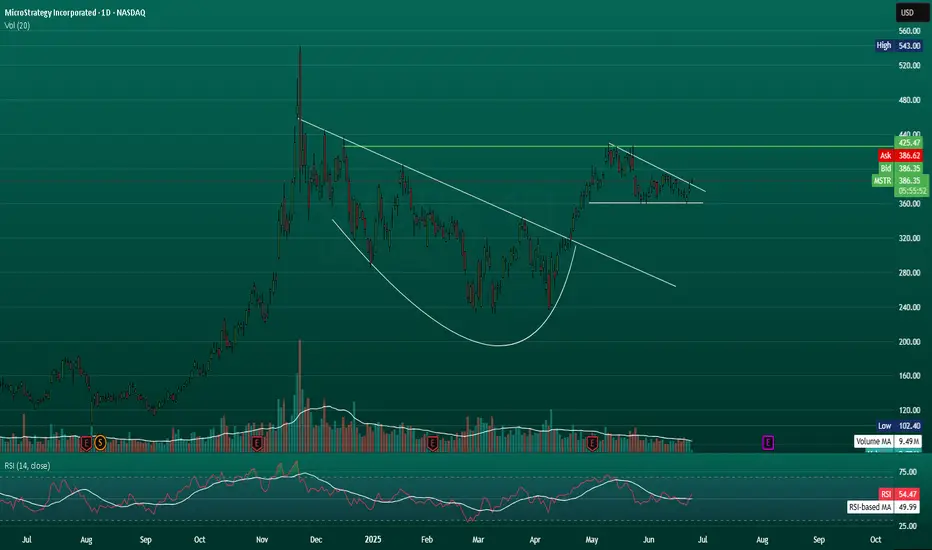
$MSTR Continues on last weeks path!NASDAQ:MSTR continues to breakout above the channel after a retest as support.
High Volume Node at $440 may proof tough but if price breaks through we could see a strong FOMO induced breakout into price discovery.
Analysis is invalidated below the channel at $358.
Safe Trading
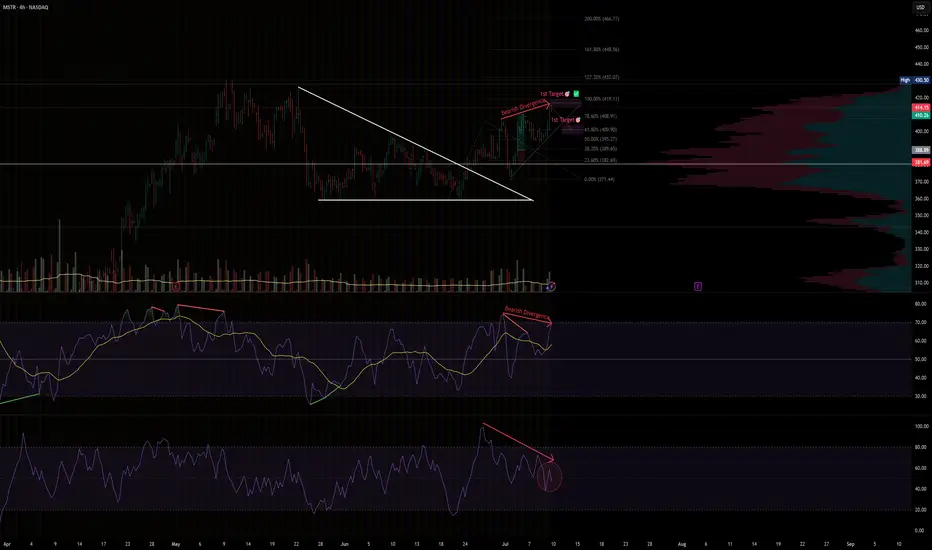
MSTR · 4H —Early Bearish Divergence Detected Near Key Fib TargetSetup Breakdown
Price recently broke out from a falling wedge and hit both technical targets — first at ~$409 (78.6%) and then ~$419 (100%).
However, momentum is weakening despite price hovering near the highs.
We're now seeing early bearish divergence on multiple timeframes and oscillators, signaling potential reversal or pullback.
⚠️ Bearish Signals
RSI Divergence
Price made higher highs while RSI made lower highs — classic bearish divergence.
Double confirmation
Both RSI with MA and pure RSI show declining momentum.
Volume drop
Price is rising but volume is not following — another early warning sign.
🔻 Potential Breakdown Trigger
If price closes below $407–405, that would break short-term structure and confirm the divergence risk.
Watch for RSI to drop below 50 and volume to spike on red candles — that would likely accelerate the correction.
📉 Downside Zones to Watch
$400
=> 61.8% Fib retracement + consolidation base
$395
=> 50% Fib retracement
$389
=> 38.2% Fib retracement + prior breakout support
✅ Summary
Divergence is still early but meaningful — momentum does not support current price highs.
A breakdown from current levels could open a short window down to $386 or even $371 if confirmed.
Watch RSI + volume + candle structure for confirmation before acting.
Disclaimer: This is not financial advice. Always manage your own risk and follow your trading plan.
#MSTR #BearishDivergence #RSI #Fibonacci #MomentumShift #VolumeAnalysis #TradingView #TechStocks #4HChart
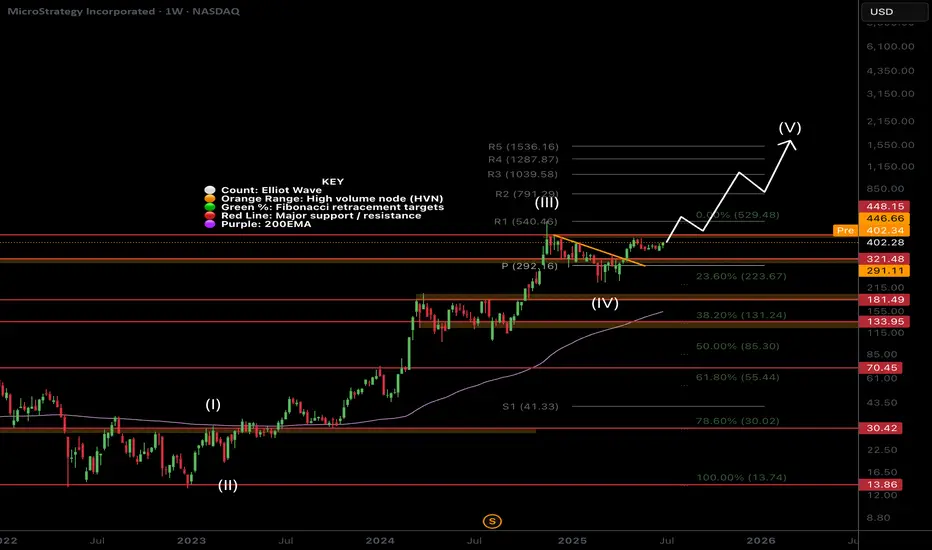
$MSTR Megatrend Continuation?NASDAQ:MSTR is market leader in the CRYPTOCAP:BTC strategic reserves strategy and has set the benchmark.
After a nearly 20x rally profit take is exceptive, price has held up extremely well through the last 6 months only dropping to the .236 Fibonacci retracement and weekly pivot. As Bitcoin continues into price discovery expect the MSTR rally to continue with renewed tailwinds.
It is an extremely hated stock as well as its collection of yield baring derivatives. The keeps the social mood / sentiment low which could prove further tailwind for growth.
I am looking at a terminal target this cycle of around $1500 at the R5 weekly pivot.
Safe trading
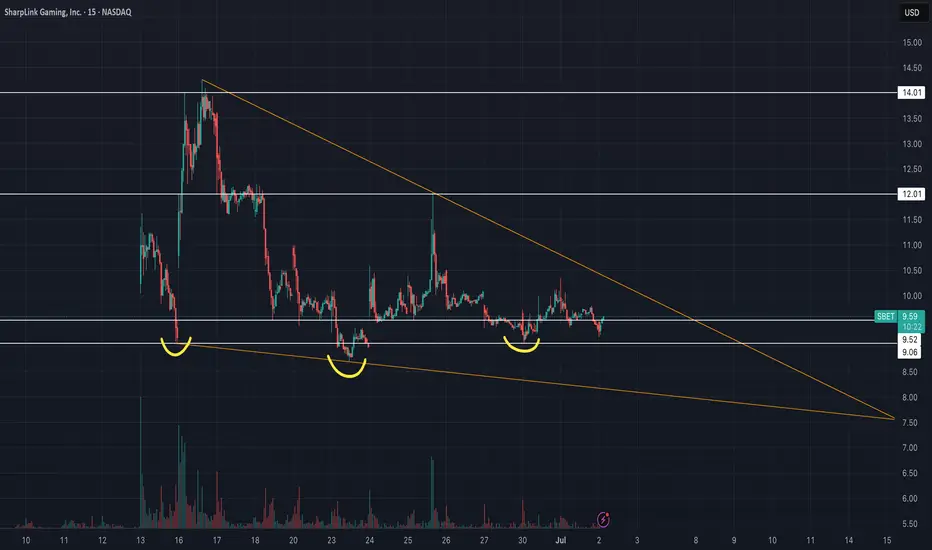
SharpLink Gaming Inc (SBET) - Falling Wedge & Inverse H&S🚀 SharpLink Gaming ( NASDAQ:SBET ) – Ethereum, Joe Lubin & a Bullish Setup
SharpLink Gaming has undergone a bold transformation: the company is now the largest public holder of Ethereum (ETH), with ~198,000 ETH acquired since June 2025. Over 95% of it is staked, already earning 200+ ETH in rewards – turning ETH into a yield-bearing treasury asset.
Driving this shift is Joe Lubin, co-founder of Ethereum and CEO of ConsenSys, who recently became Chairman of SharpLink. Under his leadership, SBET is betting big on Ethereum as “digital capital”, aiming to merge iGaming and Web3.
📊 Technical Setup:
SBET is forming a falling wedge and an inverse head and shoulders – both classic bullish reversal patterns. After a post-announcement retracement, the chart suggests growing potential for a breakout as fundamentals strengthen.
🧠 My thesis: This is MicroStrategy playbook 2.0 – but with ETH instead of BTC. SharpLink gives equity exposure to Ethereum + staking yield + visionary leadership.
🔔 Worth watching closely.
⚠️ Always do your own investment research and make your own decisions before investing.
Bitcoin - An Epic Move Awaits!Bitcoin gained 13% in H1 2025, outperforming Ethereum and Solana, which dropped ~25% and ~17% respectively—highlighting BTC's strength in turbulent market conditions.
Institutional wedge: spot-BTC ETFs saw huge inflows—BlackRock’s took in $336M, and total crypto product inflows approached $45B+ this year.
AI models foresee BTC holding $105K+ by end-June, with ChatGPT pointing to $118K and Grok forecasting $108K, based on momentum and ETF flows.
We see BTC holding the 20 MA and spiking to new all time highs.

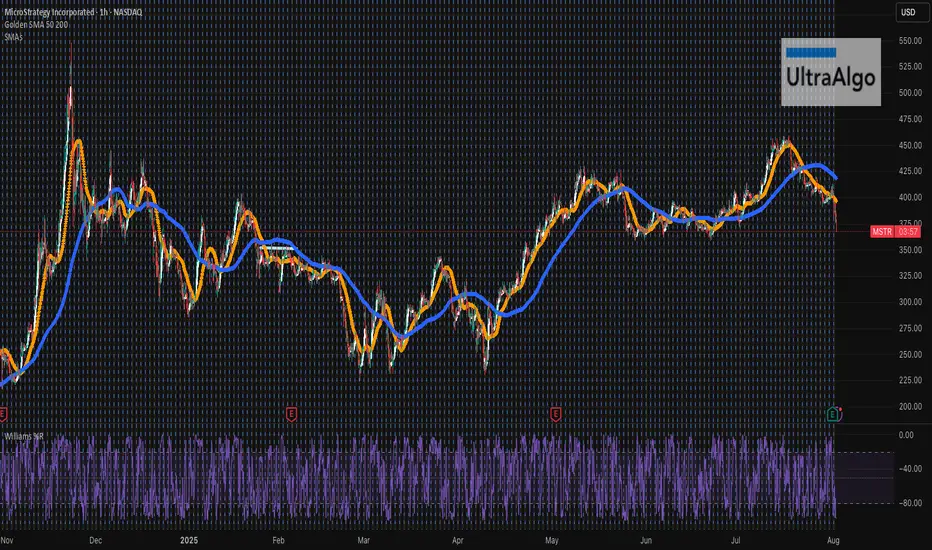
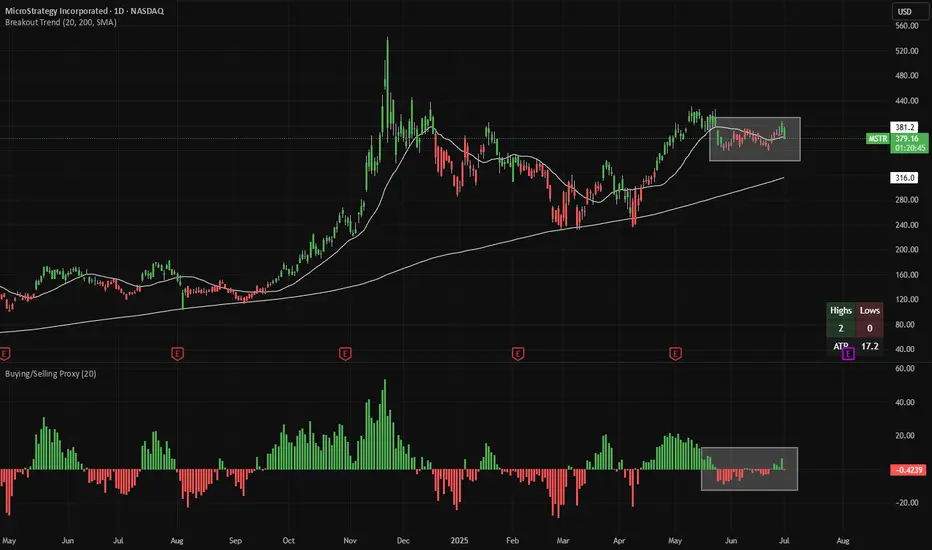
MSTR Long - high squeeze potentialMSTR recently made 20-day highs (green candles) and then sold off towards the 20D EMA trendline. Meanwhile, looking at a proxy of net buying/selling (bottom panel), there has been neither significant buying nor selling activity.
All of this is setting up the potential for a squeeze higher.
Needless to say, please manage your risks carefully and consider setting a stop-loss upon MSTR closing at a 20-day low (red candle).
Both indicators (Breakout Trend and Buying/Selling Proxy) are available for free on TradingView.
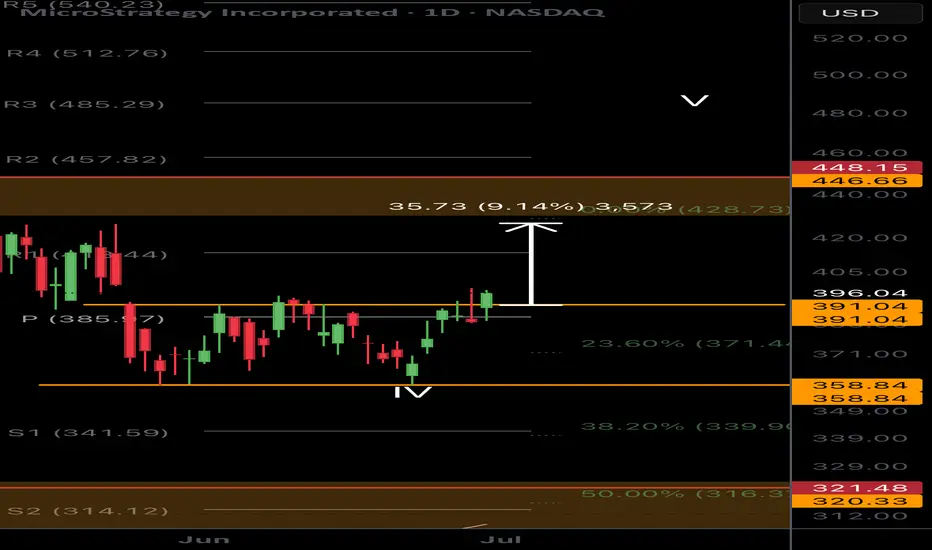
MSTR breakout time? NASDAQ:MSTR attempting to breakout of the channel on the 4th test, the high probability magic number!
Channel pattern target is 9% move to $426. The High Volume Node EQ at $438 is a more likely area of resistance if we get this love.
Safe trading
MSTRMSTR after looking above and failing in the attempt to test the highs it has been consolidating for a period of time and is show some signs of strength. If BTC can get a nice push above all time highs I believe you will see ATHs on MSTR.
MSTR Bulls Reload on BTC ConvictionMSTR – Institutional Flow + BTC Correlation + Bull Vertical Spread Setup
MicroStrategy (MSTR), operating as “Strategy,” just went full throttle—adding 10,100 BTC between June 9–15 at an average of $104,080 per coin, totaling over $1.05B. With this, they now hold 592,100 BTC (>$63B), solidifying their status as the largest Bitcoin-holding public company. That’s a bold move amid the ongoing Israel-Iran macro uncertainty, signaling confidence, not caution.
This latest BTC buy was funded via STRK and STRF ATM offerings and the $979.7M STRD preferred IPO. Since initiating their Bitcoin treasury strategy in 2020, MSTR has soared over 3,000%, and they’re projecting a 25% BTC yield for 2025 after already clocking in at 13.7% YTD.
🔎 Flow Watch
Institutional activity around current price levels has been sharp—confirming conviction behind the recent momentum. With BTC hovering at critical support, I’m eyeing a potential short-term bullish reversal. Given the tight correlation between BTC and MSTR, the setup looks primed.
🎯 My Strategy
I’m targeting a bull vertical spread—buying the 382.5 call and selling the 385 call. This defined-risk, limited-reward setup positions me to capture near-term upside if BTC begins a rebound and MSTR follows suit. The tight strike range and elevated IV make it ideal for a premium-efficient directional bet.