Why Pay $250K for a $115K Bitcoin? Welcome to Strategy (MSTR)This is already the third article I’ve written about Strategy (formerly MicroStrategy), and for good reason.
You don’t need to be a financial expert to ask: why buy a stock that simply mirrors Bitcoin’s price — but at a massive premium?
No matter how sophisticated the explanations may sound, or how many times you’re told that “if you don’t understand it, it must be brilliant,” the reality is much simpler — and much more absurd.
Buying Strategy today is like paying $250,000 for Bitcoin while the actual market price is $115,000.
It’s not about complexity. It’s about common sense.
I won’t dive too deep into it — no need to fight “financial sophistication” with even more sophisticated words.
The point is simple: buying Strategy is like paying me $10,000 just so I can hold your $10,000 and call it an “innovative capital deployment strategy.”
Sounds smart, right? Until you think about it for more than five seconds.
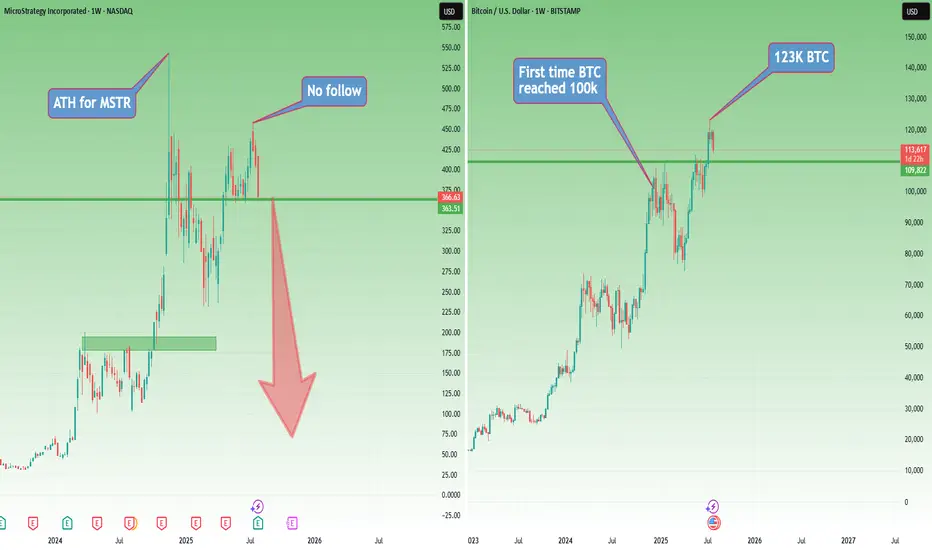
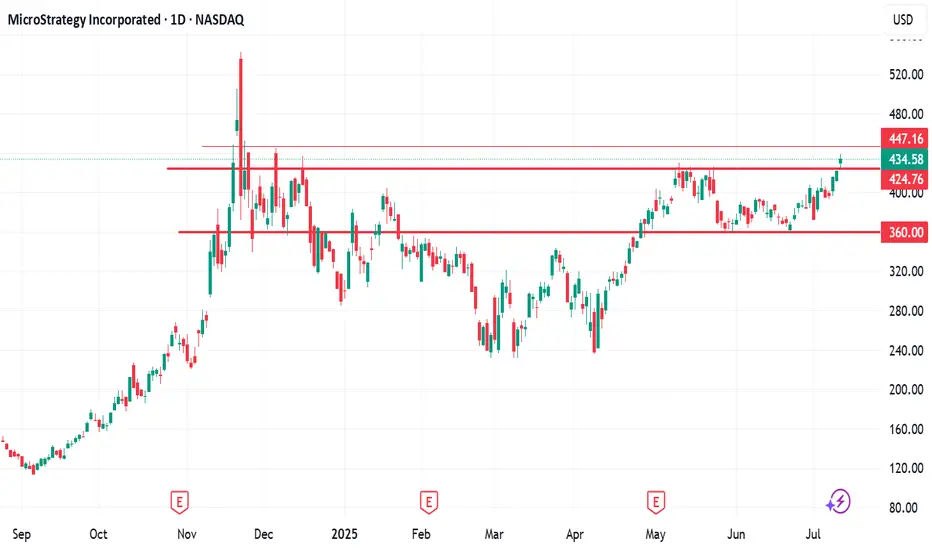
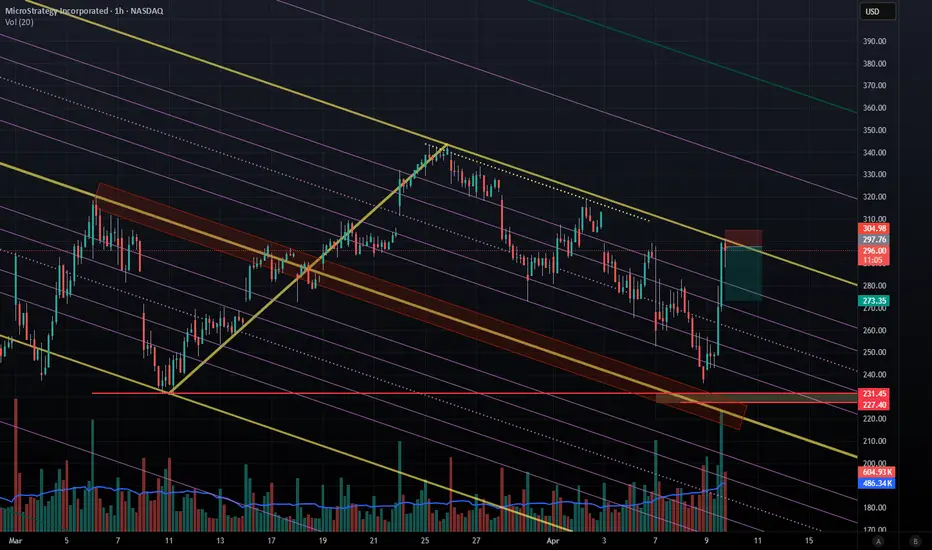
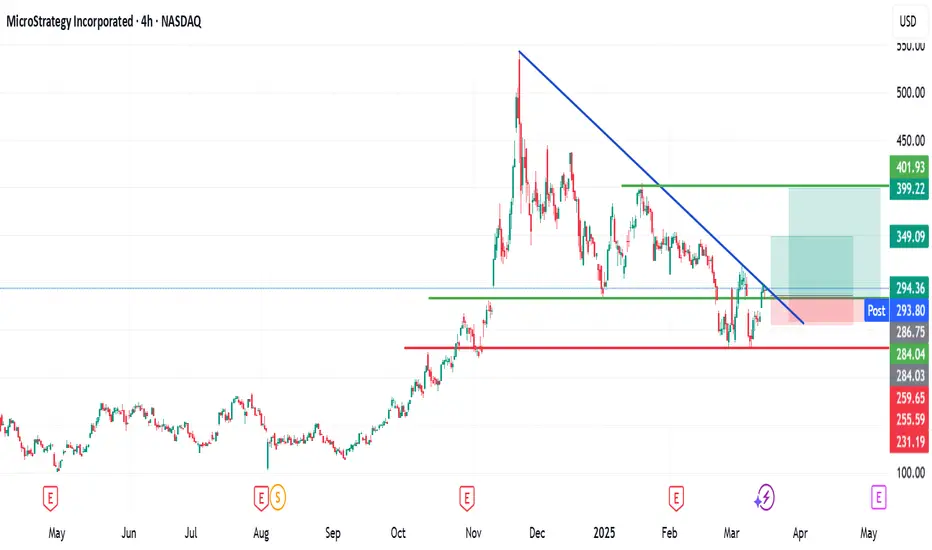
Now let’s look at the posted charts — simple and visual.
Strategy (MSTR) hit its all-time high in November 2024, right when Bitcoin first reached $100,000.
Then came a sharp correction of more than 50% for the stock.
Fast forward: even though Bitcoin went on to make new all-time highs, Strategy didn’t follow, it seems like people were finally starting to wake up.
When BTC peaked again in mid-July 2025, Strategy only managed to reach $455 — well below its November ATH.
Since then, BTC has pulled back about 10%, while Strategy dropped around 20%.
So much for the “outperformance” argument.
And here’s where things get even harder to justify:
In the past, some institutions bought MicroStrategy because they couldn’t hold Bitcoin directly. Fair enough.
But now? Spot Bitcoin ETFs are live, regulated, widely available, and charge tiny fees — without the leverage, dilution risk, or premium baked into Strategy.
So what’s the excuse now?
Where are we now?
At this moment, even though I’m not too happy about this week’s Bitcoin weakness, I remain cautiously bullish — emphasis on cautiously.
But let’s entertain a scenario.
If Bitcoin continues to correct, Strategy is sitting right on support. And if BTC breaks lower, Strategy will almost certainly follow — breaking support and heading toward the next level.
That next support? Somewhere around $240–250, depending on how deep the Bitcoin pullback goes.
But here’s the real question:
What happens if Bitcoin enters a true bear market?
Will Strategy — which just recently rebranded from MicroStrategy — be forced to rebrand again as…
NanoStrategy?
Just a Saturday thought.
Mstranalysis
MSTR....Free FallingMSTR looks like it is nosediving straight down. When one is bullish on BTC, it is important to also understand that volatility is a big part of the game - a very costly game with many losers! BTC has past several key TAs and we only just started - crossing $300 is in the horizon. Always do your own due diligence, and received ultrabear signal earlier to exit, and cut your losses soon.
MSTR WEEKLY OPTIONS SETUP (2025-07-28)
### 🔻 MSTR WEEKLY OPTIONS SETUP (2025-07-28)
**Bearish Divergence with High Confidence — Time to Strike with a PUT?**
---
📊 **Momentum Recap:**
* **RSI:** Bearish 📉
* **Volume:** Weak (institutional exit risk)
* **Options Flow:** Mixed (calls > puts, but no alignment with price)
* **Sentiment Models:** Split 4:1 → **Only Claude/Anthropic** goes bearish with conviction
🧠 **Model Consensus:**
> “Momentum is weak, volume fading, and no upside confirmation = bearish edge.”
---
### ✅ SETUP OVERVIEW
* 🔍 **Trend:** Bearish (declining RSI)
* 📉 **Volume:** Weak = reduced institutional conviction
* 💬 **Options Flow:** Bullish bias, but **contradicts price trend**
* ⚙️ **Volatility:** Elevated, potential reward for directional plays
**Overall Bias:** 🔴 *Moderately Bearish*
---
### 💥 TRADE IDEA: MSTR \$400P
* 🎯 **Strategy:** Long Weekly Put
* 🔻 **Strike:** 400.00
* 📆 **Expiry:** Aug 1, 2025
* 💸 **Entry Price:** \$8.65
* ✅ **Profit Target:** \$12.50
* 🛑 **Stop Loss:** \$4.00
* 📈 **Confidence Level:** 72% (backed by Claude model)
* 📉 **Breakdown Trigger:** Below \$405 confirms bearish flow
* ⚠️ **Invalidation:** Break above \$415 → exit early
---
### 📦 TRADE\_DETAILS (Backtest/Algo Ready JSON)
```json
{
"instrument": "MSTR",
"direction": "put",
"strike": 400.0,
"expiry": "2025-08-01",
"confidence": 0.72,
"profit_target": 12.50,
"stop_loss": 4.00,
"size": 1,
"entry_price": 8.65,
"entry_timing": "open",
"signal_publish_time": "2025-07-31 09:30:00 UTC-04:00"
}
```
---
### 🧠 TRADE INSIGHTS
* 🟥 4/5 models say **no trade** due to signal divergence
* 🧠 **Claude’s bearish thesis = cleanest directional setup**
* 🚨 Volume + RSI combo = downside confirmation
* 🧭 Watch key price reaction zones: **\$400–\$405 (support)** / **\$415 (resistance cap)**
---
**#MSTR #PutOptions #WeeklyTrade #BearishSetup #OptionsFlow #QuantTrading #ClaudeModel #MarketMomentum**

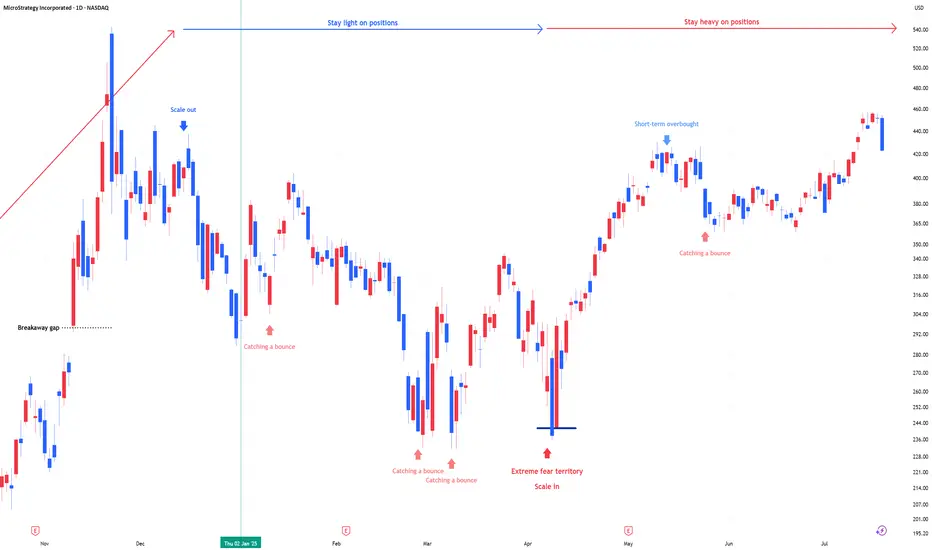
MSTR: Stay heavy on positions"MSTR position size is adjusted in line with US market and bitcoin signals for underweight or overweight allocations. During panic phases, 2x leverage ETFs are on the table."
Stay heavy on positions
MSTR stock has seen a strong rally since JuneSince June, MSTR stock has seen a strong rally—rising from the mid‑$300s to above $430—driven by a few key factors:
Bitcoin’s continued ascent has fueled sentiment. Bitcoin recently hit fresh record highs (above $118K), driven by a weakening dollar and bullish macro trends, which in turn boosted bitcoin-linked equities like MicroStrategy.
In short, MSTR’s rally since June has been largely Bitcoin-driven: a powerful combination of rising crypto prices, ongoing BTC purchases, proactive capital raises, and positive analyst sentiment creating a bullish feedback loop.
Let me know if you'd like a breakdown of Bitcoin’s trend or deeper insight on MSTR’s financing strategy.
$447 will be my next buy TP.
Please, share your thought, like, share and follow me.
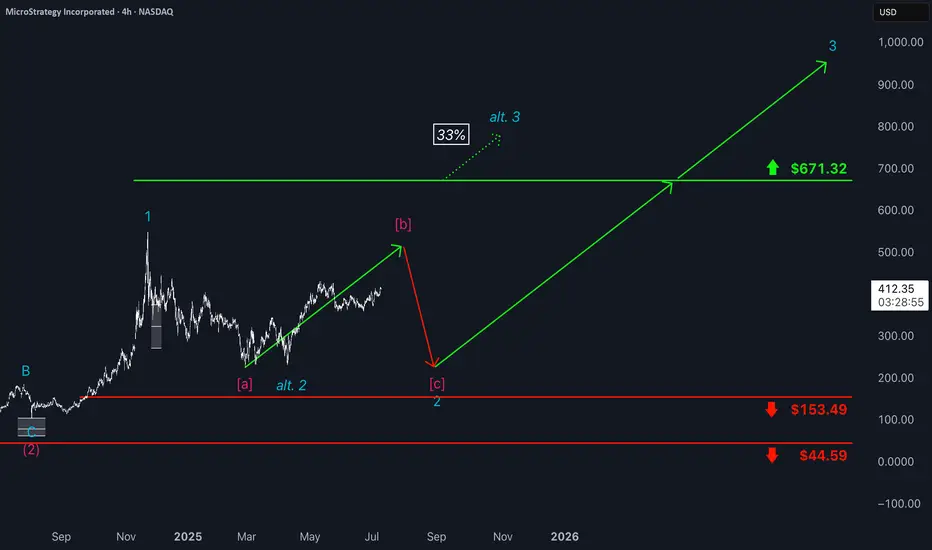
Microstrategy: Renewed Upside MicroStrategy has continued to face downward pressure recently but is now showing more decisive signs of an upward move. We still see greater upside potential in the current magenta wave , though we expect the peak to form below resistance at $671.32. Afterward, the bearish wave should complete turquoise wave 2—while still holding above support at $153.49. Wave 3 should then usher in a longer upward phase, with momentum likely to ease only well above the $671.32 level. At the same time, there remains a 33% probability that the stock has already entered this upward phase. In that scenario, turquoise wave alt. 2 would already be complete, and the price would move directly above $671.32 as part of wave alt. 3.
📈 Over 190 precise analyses, clear entry points, and defined Target Zones - that's what we do.
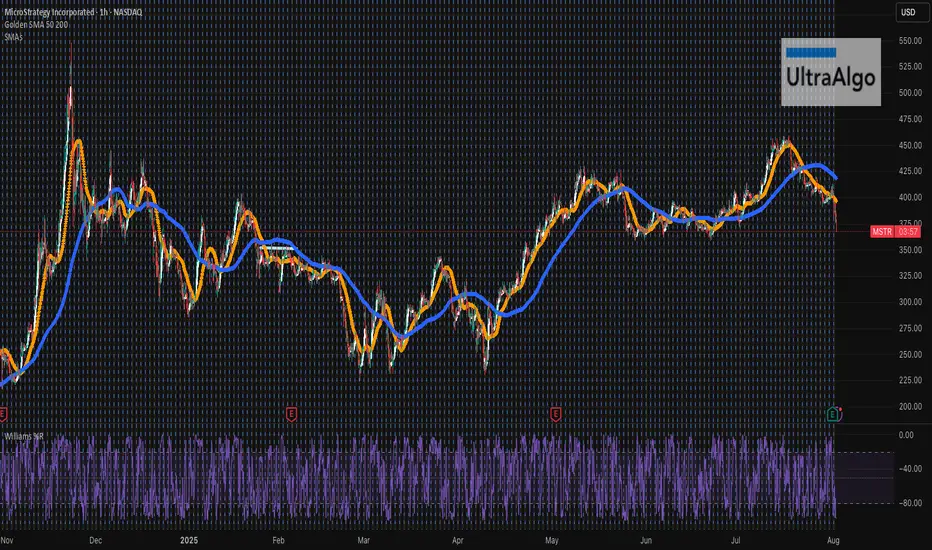
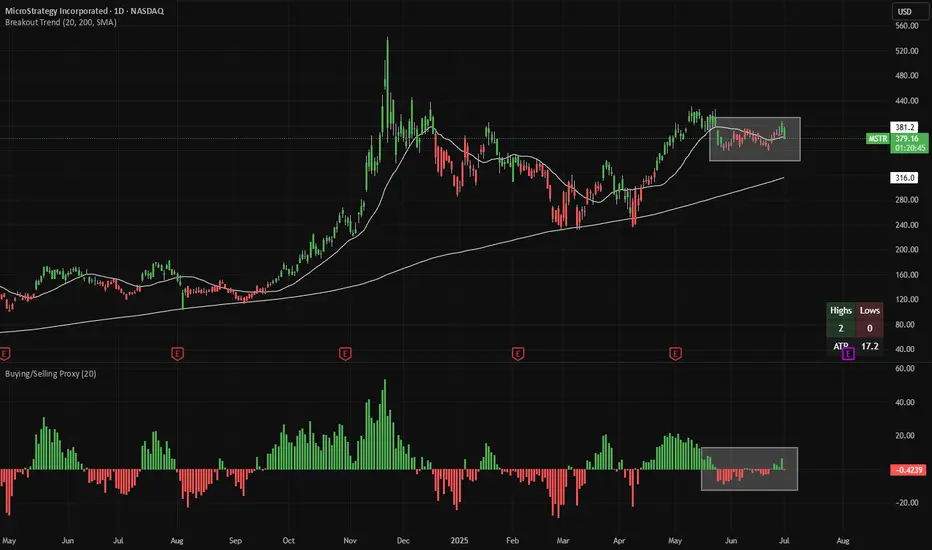
MSTR Long - high squeeze potentialMSTR recently made 20-day highs (green candles) and then sold off towards the 20D EMA trendline. Meanwhile, looking at a proxy of net buying/selling (bottom panel), there has been neither significant buying nor selling activity.
All of this is setting up the potential for a squeeze higher.
Needless to say, please manage your risks carefully and consider setting a stop-loss upon MSTR closing at a 20-day low (red candle).
Both indicators (Breakout Trend and Buying/Selling Proxy) are available for free on TradingView.
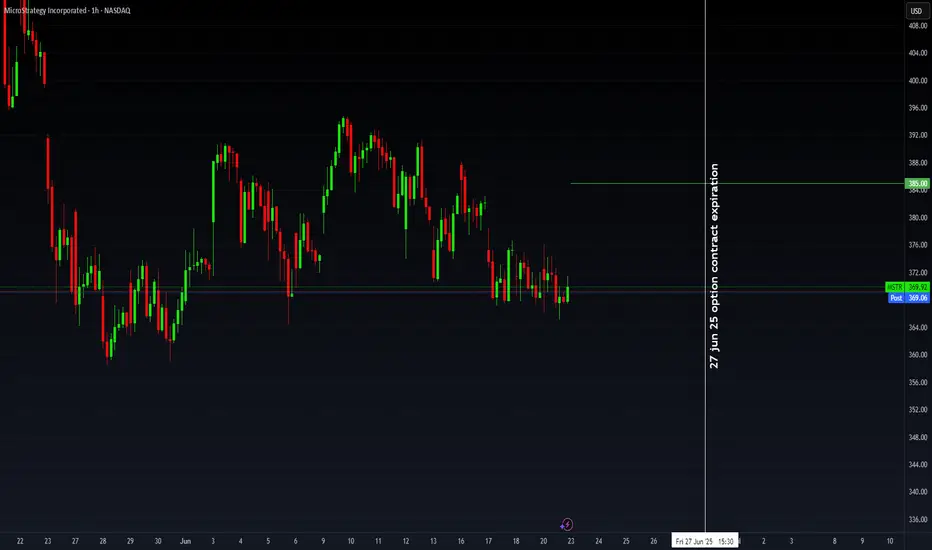
MSTR Bulls Reload on BTC ConvictionMSTR – Institutional Flow + BTC Correlation + Bull Vertical Spread Setup
MicroStrategy (MSTR), operating as “Strategy,” just went full throttle—adding 10,100 BTC between June 9–15 at an average of $104,080 per coin, totaling over $1.05B. With this, they now hold 592,100 BTC (>$63B), solidifying their status as the largest Bitcoin-holding public company. That’s a bold move amid the ongoing Israel-Iran macro uncertainty, signaling confidence, not caution.
This latest BTC buy was funded via STRK and STRF ATM offerings and the $979.7M STRD preferred IPO. Since initiating their Bitcoin treasury strategy in 2020, MSTR has soared over 3,000%, and they’re projecting a 25% BTC yield for 2025 after already clocking in at 13.7% YTD.
🔎 Flow Watch
Institutional activity around current price levels has been sharp—confirming conviction behind the recent momentum. With BTC hovering at critical support, I’m eyeing a potential short-term bullish reversal. Given the tight correlation between BTC and MSTR, the setup looks primed.
🎯 My Strategy
I’m targeting a bull vertical spread—buying the 382.5 call and selling the 385 call. This defined-risk, limited-reward setup positions me to capture near-term upside if BTC begins a rebound and MSTR follows suit. The tight strike range and elevated IV make it ideal for a premium-efficient directional bet.
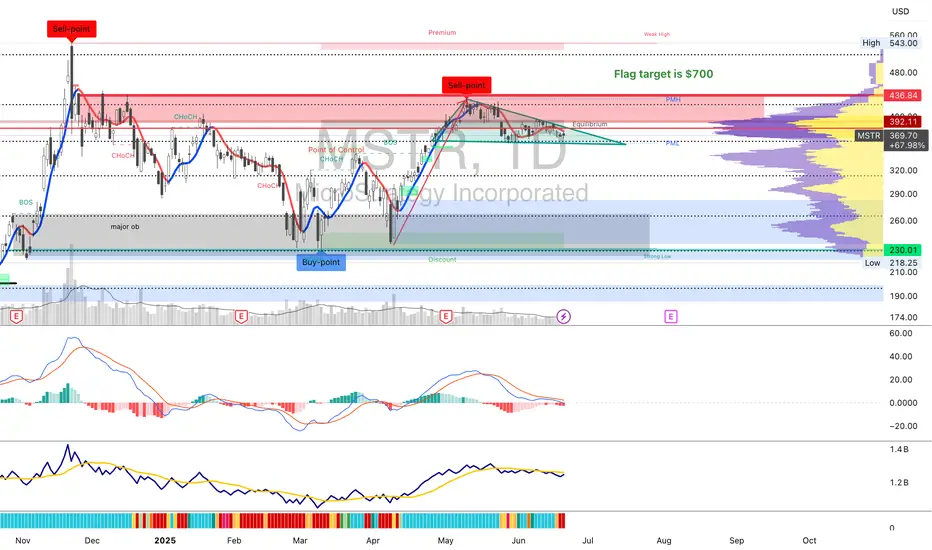
Bullish flag on $mstr, consolidating under supply tooNASDAQ:MSTR is in a flagpole position, a bullish one. The measured move target would be $700
Do you agree that MSTR is in a bullish stance?
I guess this really come down to how bitcoin does.
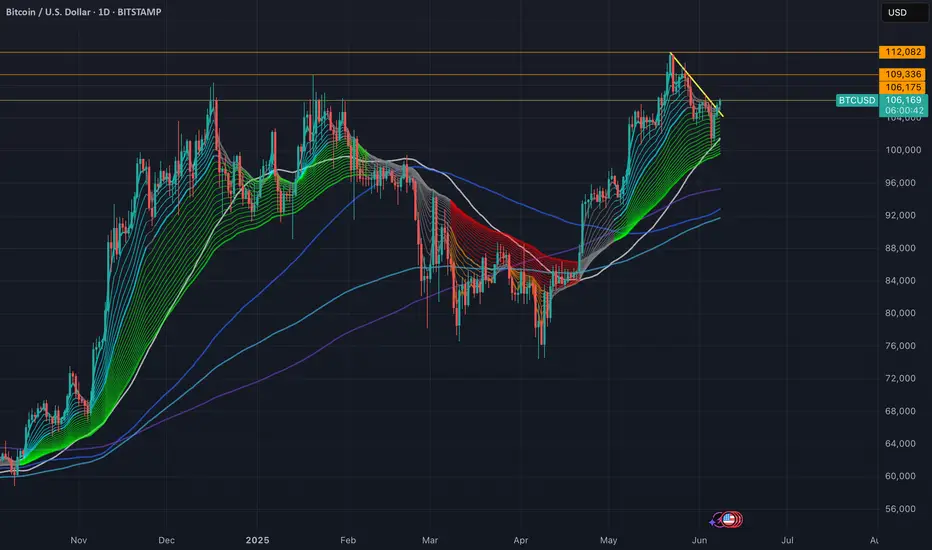
Targets for Bitcoin Bullish outlook for BTC in the coming days IF we close above 106,1 k.
The 3 day candles indicates we could have a "Three White Soldier Pattern" coming up for BTC. It would be a pattern showing a trend reversal and potenially trigger the next trend to retest the old ATH. Although, I would like to see increase in volume to confirm this during the rest of the day to be more certain on this pattern.
Expecting NASDAQ:MSTR to get really bullish aswell if this occur.
Navigating MSTR’s Price Swings: A Smart Options ApproachOverview
MicroStrategy (MSTR) has continued to capture market attention due to its aggressive Bitcoin strategy and significant stock price volatility. In 2025, MSTR surged 41% in one quarter but also reported a massive $4.22 billion net loss in Q1, raising concerns about long-term financial stability. Analysts remain divided, setting price targets ranging from $200 to $650, largely dependent on Bitcoin’s performance and broader market conditions.
Key Developments Impacting MSTR
✔ Bitcoin Exposure: MSTR maintains a large Bitcoin position, making its stock highly correlated to BTC’s price movements.
✔ AI Integration: The company is investing in AI-driven products, which could provide diversification outside of Bitcoin.
✔ Institutional View: Analysts remain split on MicroStrategy’s valuation due to its uncertain revenue model.
✔ Macro Volatility: Market-wide sentiment, interest rates, and crypto regulations will influence MSTR’s trajectory.
Options Strategy for the Week
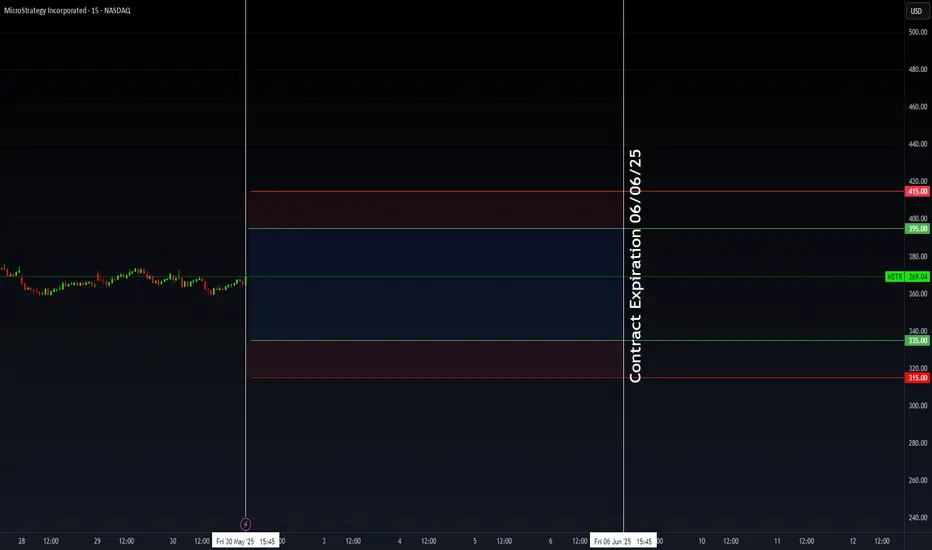
🚀 Iron Condor Setup for June 6 Expiration
To capitalize on MSTR’s volatility while managing risk, an Iron Condor strategy is structured within a controlled range:
- Inner Range: Sell Calls at 395 and Puts at 335
- Coverage: Buy Calls at 415 and Puts at 315
✅ Objective: Profiting from sideways price movement while minimizing exposure to extreme volatility.
✅ Risk Management: If MSTR breaks above 415 or below 315, the long positions hedge against excessive losses.
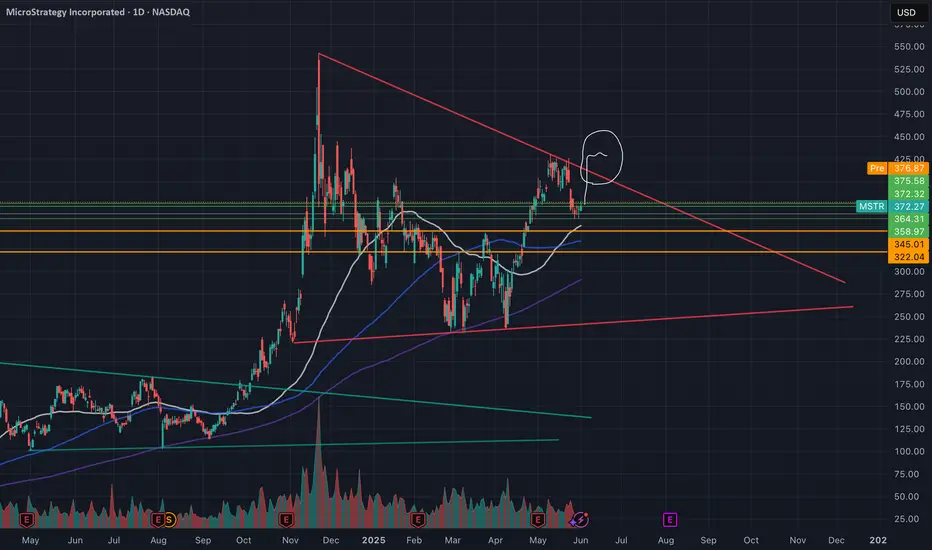
Wedge pattern - Bullish Strategy (MSTR)My expectations for June for Microstrategy stock aka Strategy. Ofc, It all depends heavily on BITSTAMP:BTCUSD
MSTR I Pullback and More Potential GrowthWelcome back! Let me know your thoughts in the comments!
** MSTR Analysis - Listen to video!
We recommend that you keep this pair on your watchlist and enter when the entry criteria of your strategy is met.
Please support this idea with a LIKE and COMMENT if you find it useful and Click "Follow" on our profile if you'd like these trade ideas delivered straight to your email in the future.
Thanks for your continued support!Welcome back! Let me know your thoughts in the comments!

MSTR Weekly Options Trade Plan 2025-05-24MSTR Weekly Analysis Summary (2025-05-24)
Summary of Each Model’s Key Points
Grok/xAI Report
Technicals: Short-term and daily charts show bearish momentum but oversold conditions (5-min RSI ~22, price near lower Bollinger Band) hint at a bounce. Sentiment: Elevated VIX (22.29), negative Bitcoin-bet headlines, insider sell-offs; max pain at $400 may cap upside. Direction: Moderately Bearish with potential for a relief rally. Trade: Buy $370 call at $13.00, aiming for +25% ($16.25), stop at 20% loss ($10.40), 65% confidence.
Claude/Anthropic Report
Technicals: Deep bearish momentum below all EMAs; M5 RSI oversold, daily RSI near oversold. Sentiment: Rising VIX, mixed Bitcoin headlines, heavy put open interest at $350–$360. Direction: Moderately Bearish but conflicting bounce signals. Trade: No trade—confidence only 45%.
Llama/Meta Report
Technicals: Bearish trend on both timeframes; oversold M5 RSI. Sentiment: Elevated volatility; mixed news; max pain theory. Direction: Moderately Bearish. Trade: Buy $367.50 put (ask $12.30–bid $11.85), profit +20%, stop 50%, 70% confidence.
Gemini/Google Report
Technicals: Overwhelming bearish across EMAs, RSI, MACD, price breaks on high volume. Sentiment: VIX rising, negative news, skewed options flow. Direction: Strongly Bearish. Trade: Buy weekly $310 put (est. ask ~$0.70), target 100–200% gains, stop at $0.35, 65% confidence.
DeepSeek Report
Technicals: Bearish on both charts but oversold; mixed reversal vs. continuation signals. Sentiment: VIX up, mixed news, distant max pain. Direction: Neutral/Unclear. Trade: No trade—confidence 55%. Areas of Agreement and Disagreement
Agreement
Broadly bearish technical setup: price under EMAs, negative MACD, RSI oversold short term. Elevated volatility (VIX ~22) supporting larger swings. Weekly expiry options, with traders positioned for downside (heavy put OI).
Disagreement
Trade bias: Grok favors a call bounce; Llama and Gemini prefer deep-OTM puts; Claude and DeepSeek opt out. Strike choice: Ranges from near-the-money calls ($370) to far-OTM puts ($310). Confidence thresholds and risk/reward preferences differ, leading to divergent trade/no-trade conclusions. Conclusion and Recommendation
Overall Market Direction Consensus: Bearish (various intensities from moderate to strong).
Recommended Trade: Buy a naked weekly put.
• Strike Selection: $355 put offers a balance of liquidity (OI 2,042), premium ($7.45 ask), and proximity to current price (downside leverage without needing an extreme move). • Expiry: 2025-05-30 weekly. • Premium: $7.45 (within or near preferred risk range). • Entry Timing: At market open. • Profit Target: +25% (~$9.31). • Stop Loss: –20% (~$5.96). • Position Size: 1 contract. • Confidence Level: 65%.
Key Risks and Considerations
A short-term bounce could spike implied vol and lift call skew, hurting put value. Support at $362 may hold, capping downside. Elevated volatility could widen spreads; ensure limit orders. Maintain strict stop-loss to prevent outsized premium decay losses.
TRADE_DETAILS (JSON Format)
{ "instrument": "MSTR", "direction": "put", "strike": 355.0, "expiry": "2025-05-30", "confidence": 0.65, "profit_target": 9.31, "stop_loss": 5.96, "size": 1, "entry_price": 7.45, "entry_timing": "open", "signal_publish_time": "2025-05-25 09:30:00 UTC-04:00" } 📊 TRADE DETAILS 📊 🎯 Instrument: MSTR 🔀 Direction: PUT (SHORT) 🎯 Strike: 355.00 💵 Entry Price: 7.45 🎯 Profit Target: 9.31 🛑 Stop Loss: 5.96 📅 Expiry: 2025-05-30 📏 Size: 1 📈 Confidence: 65% ⏰ Entry Timing: open 🕒 Signal Time: 2025-05-24 14:57:32 EDT
Disclaimer: This newsletter is not trading or investment advice but for general informational purposes only. This newsletter represents my personal opinions based on proprietary research which I am sharing publicly as my personal blog. Futures, stocks, and options trading of any kind involves a lot of risk. No guarantee of any profit whatsoever is made. In fact, you may lose everything you have. So be very careful. I guarantee no profit whatsoever, You assume the entire cost and risk of any trading or investing activities you choose to undertake. You are solely responsible for making your own investment decisions. Owners/authors of this newsletter, its representatives, its principals, its moderators, and its members, are NOT registered as securities broker-dealers or investment advisors either with the U.S. Securities and Exchange Commission, CFTC, or with any other securities/regulatory authority. Consult with a registered investment advisor, broker-dealer, and/or financial advisor. By reading and using this newsletter or any of my publications, you are agreeing to these terms. Any screenshots used here are courtesy of TradingView. I am just an end user with no affiliations with them. Information and quotes shared in this blog can be 100% wrong. Markets are risky and can go to 0 at any time. Furthermore, you will not share or copy any content in this blog as it is the authors' IP. By reading this blog, you accept these terms of conditions and acknowledge I am sharing this blog as my personal trading journal, nothing more.

MSTR Short ScalpI think the equities pump will mean revert and pull down crypto/MSTR with it. It's at a critical pitchfork trendline that's acted as resistance before. Risking 0.5%
MSTR is likely going northMSTR is likely going north.
My buy view for Microstrategy with risk-reward ratios of 1:2 & 1:4.7
Trade 1: RR 1:2
Trade 2: RR 1:4.7
Trade with care
$MSTR - WE HAVE IGNITION! 107% UpsideNASDAQ:MSTR - WE HAVE IGNITION 🚀
🎯$448🎯$543🎯$600
✅Falling Wedge Breaking Out
✅Wr% Breaking Out of DownTrend
✅Weekly Hammer Candle
Not Financial Advice

Strategic $MSTR Accumulation: $340 Break for Macro ContinuationDecided to start buying back some $MSTR. I’ve been waiting since late December to begin accumulating, and I initially thought it would stay above $300, forcing me to jump back in.
Now that it's in an optimal buy area with enough confluence on the weekly timeframe, I’m accumulating under $250. I’ll add the last chunk once it breaks above $340.
Just keep in mind there’s a strong weekly downtrend in play, but it’s already hit the first target, so I expect a bounce. If it reclaims the POC at $340, it would invalidate the downtrend. So, I'm taking my chances on a possible invalidation and a continuation of the macro trend.

MicroStrategy $MSTR | MicroStrategy’s Bitcoin Bet Sees 20% DropMicroStrategy NASDAQ:MSTR | MicroStrategy’s Bitcoin Bet Sees 20% Drop Feb28'25
With recent downturns in the crypto market, Bitcoin's sharp drop has significantly impacted companies like MicroStrategy NASDAQ:MSTR , which has heavily invested in crypto. I've kept this analysis updated for my students throughout the week and figured I'd post it publicly.
This is what I would personally look at before entering trades, everything is subject to change on a daily basis and as I analyze different timeframes and ideas.
ENTERTAINMENT PURPOSES ONLY, NOT FINANCIAL ADVICE!
trendanalysis, trendtrading, priceaction, priceactiontrading, technicalindicators, supportandresistance, rangebreakout, rangebreakdown, rangetrading, chartpatterntrading, chartpatterns, spy, btc, bitcoin, mstr, micro, microstrategy, strategy, cryptocurrency, cryptodrop, cryptotrend, memecoins, crypto, digitalcurrency, digitalassets, mstrdrop, btcdrop, bitcoinidea, mstridea, mstranalysis, btcanalysis, cryptoanalysis, cryptotrades,

MicroStrategy The Next levels for Long positionsI have outlined the next important Levels for MSTR Longs using a suite of Fib tools . If you find value in my work then support me with a like/share/comment.

MSFT MicroStrategy Update Quick update on the move to the downside that we had been expecting . Sharing my thoughts on what next.

MicroStrategy’s Premium Is Fading – Time to Brace for a Drop?The strong optimism following Trump’s election in November fueled a Bitcoin rally, which in turn led to a massive surge in MicroStrategy’s ( NASDAQ:MSTR ) stock.
However, after reaching an all-time high near $550, MSTR experienced a sharp decline. Interestingly, despite Bitcoin hovering around $100K and even attempting a new ATH recently, this momentum hasn’t been reflected in MSTR’s stock price.
From a technical perspective, the price has broken below its ascending trendline and is now consolidating between $320 and $360.
Given the unjustified premium (at least in my opinion), I expect further downside for the stock.
Additionally, if Bitcoin fails to hold the key $90K confluence support, MSTR could see a sharp plunge below $200.

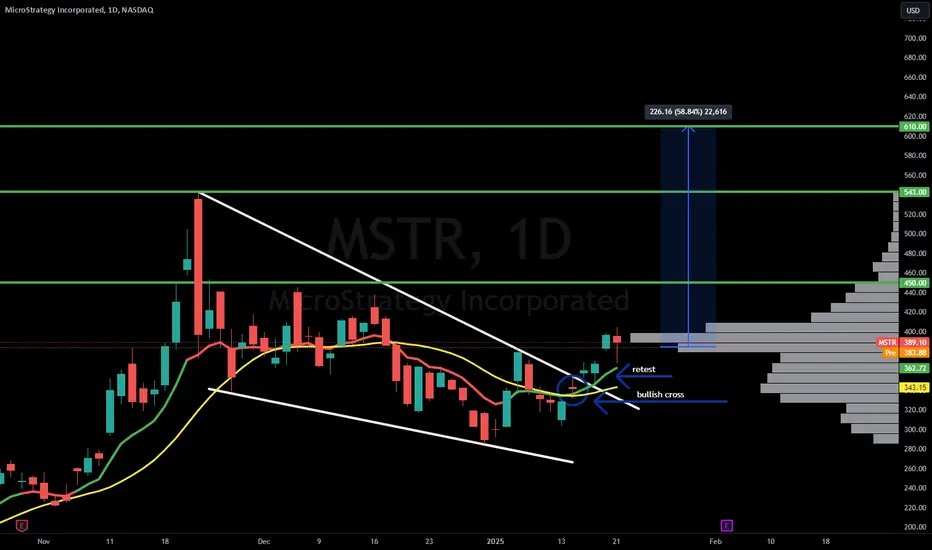
MSTR - Is Saylor about to go sailing again?! 58% upsideNASDAQ:MSTR
Is Saylor about to go sailing again?!
Breakout-Retest-Higher! 👏
🎯$450🎯$543🎯$610
Not financial advice