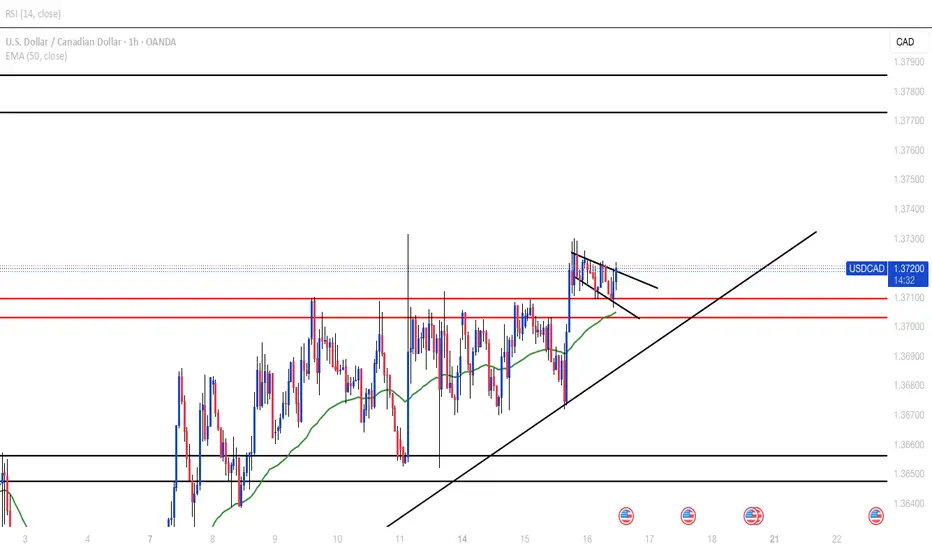
USDCADBroke H1 resistance and price is forming a bullish flag as it retests the zone. Possible movement to next H4 resistance around 1.37700
Multiple Time Frame Analysis
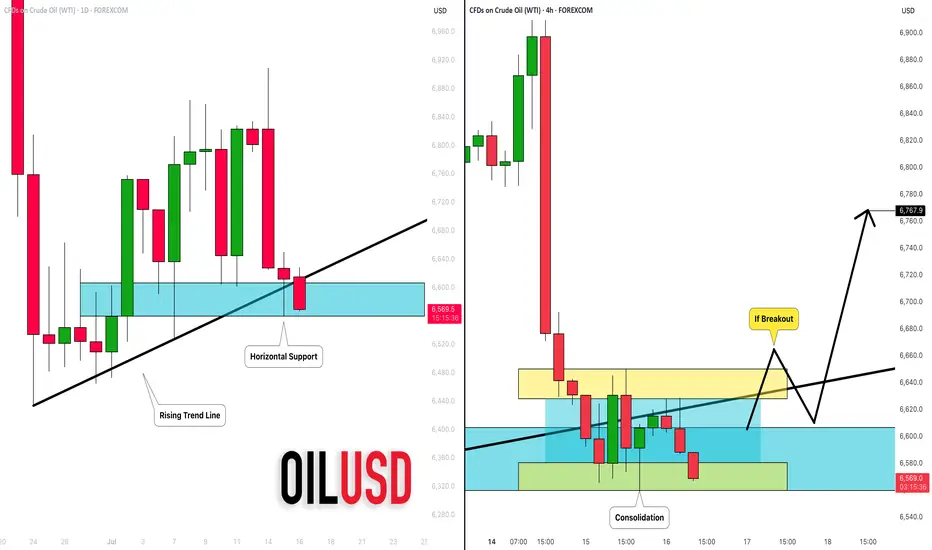
CRUDE OIL (WTI): Your Trading Plan Explained
Do not forget that today we expect Crude Oil Inventories data
release - it will be 10:30 am NY time.
Ahead of this news, the market is testing a significant daily support cluster
that is based on a rising trend line and a horizontal structure.
You signal to buy will be a bullish breakout of a minor intraday
horizontal resistance on a 4H.
4H candle close above 66,5 will be your confirmation.
A bullish continuation will be expected to 67.6 then.
I suggest waiting for the news release first and then check how
the market prices in the news. If our technicals align with fundamentals,
it will provide an accurate setup.
Alternatively, a bearish violation of a blue support will push the prices lower.
❤️Please, support my work with like, thank you!❤️
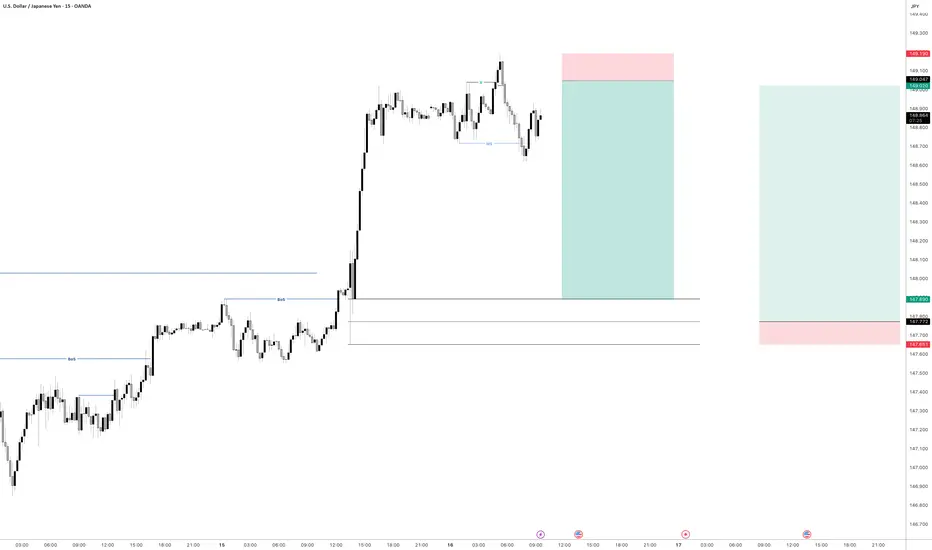
USDJPY - Time to sell short term i believeHave a pending order waiting to be triggered on UJ
Will see how we go if we get tagged in
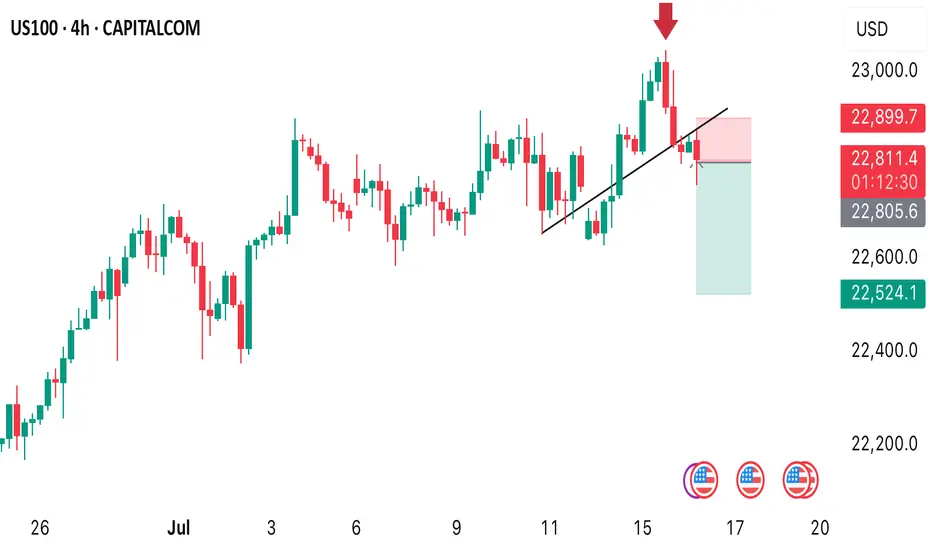
US100 SELL OPPORTUNITY A sell opportunity is envisaged as price dropped from the ALL TIME HIGH of 23000. I am shorting it with my target placed at 22524
Take advantage of this opportunity
XAU/USD 16 July 2025 Intraday AnalysisH4 Analysis:
-> Swing: Bullish.
-> Internal: Bullish.
You will note that price has targeted weak internal high on two separate occasions forming a double top which is a bearish reversal pattern. This is in-line with HTF bearish pullback phase.
Remainder of analysis and bias remains the same as analysis dated 23 April 2025.
Price has now printed a bearish CHoCH according to my analysis yesterday.
Price is now trading within an established internal range.
Intraday Expectation:
Price to trade down to either discount of internal 50% EQ, or H4 demand zone before targeting weak internal high priced at 3,500.200.
Note:
The Federal Reserve’s sustained dovish stance, coupled with ongoing geopolitical uncertainties, is likely to prolong heightened volatility in the gold market. Given this elevated risk environment, traders should exercise caution and recalibrate risk management strategies to navigate potential price fluctuations effectively.
Additionally, gold pricing remains sensitive to broader macroeconomic developments, including policy decisions under President Trump. Shifts in geopolitical strategy and economic directives could further amplify uncertainty, contributing to market repricing dynamics.
H4 Chart:
M15 Analysis:
-> Swing: Bullish.
-> Internal: Bullish.
H4 Timeframe - Price has failed to target weak internal high, therefore, it would not be unrealistic if price printed a bearish iBOS.
The remainder of my analysis shall remain the same as analysis dated 13 June 2025, apart from target price.
As per my analysis dated 22 May 2025 whereby I mentioned price can be seen to be reacting at discount of 50% EQ on H4 timeframe, therefore, it is a viable alternative that price could potentially print a bullish iBOS on M15 timeframe despite internal structure being bearish.
Price has printed a bullish iBOS followed by a bearish CHoCH, which indicates, but does not confirm, bearish pullback phase initiation. I will however continue to monitor, with respect to depth of pullback.
Intraday Expectation:
Price to continue bearish, react at either M15 supply zone, or discount of 50% internal EQ before targeting weak internal high priced at 3,451.375.
Note:
Gold remains highly volatile amid the Federal Reserve's continued dovish stance, persistent and escalating geopolitical uncertainties. Traders should implement robust risk management strategies and remain vigilant, as price swings may become more pronounced in this elevated volatility environment.
Additionally, President Trump’s recent tariff announcements are expected to further amplify market turbulence, potentially triggering sharp price fluctuations and whipsaws.
M15 Chart:

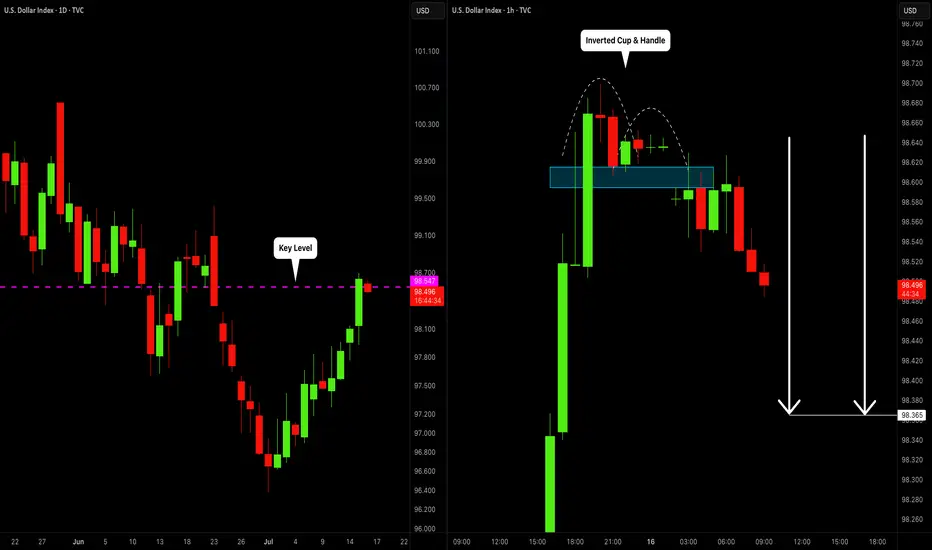
DOLLAR INDEX (DXY): Bearish Move From Key Level
I think that Dollar Index may drop from a key daily horizontal resistance level.
As a confirmation, I spotted an inverted cup & handle pattern on an hourly time frame
and a bearish violation of its neckline.
The market will most likely continue falling at least to 98.36
❤️Please, support my work with like, thank you!❤️
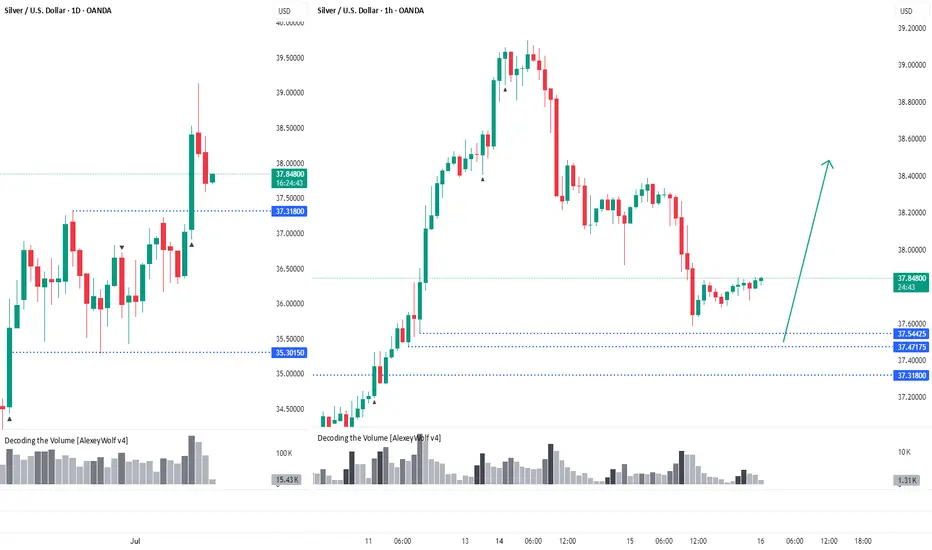
Silver. The price has pulled backHi traders and investors!
On the daily timeframe, the price has broken out of the sideways range through the upper boundary at 37.31.
The price has pulled back close to levels where potential buy patterns could form — 37.54, 37.47, and 37.31.
This analysis is based on the Initiative Analysis concept (IA).
Wishing you profitable trades!
Gold Pullback in Play – Still Aiming for 3450 📌 In yesterday’s analysis, I argued that bulls likely won the battle and that a new leg up toward 3450 could be next from a swing trade perspective. I also mentioned that buying dips remains the preferred strategy.
And indeed – we got that dip.
📉 Price pulled back to 3340 and bounced,
but it hasn’t yet touched my key area of interest: 3330–3335.
What now?
My view stays the same –I still expect a move toward the 3450 zone,but I also believe a deeper dip toward support is still on the table – likely a liquidity grab before the next leg up.
Trading Plan:
✅ Buying dips remains the core strategy
🚫 Invalidation only comes on a break below 3305–3310
🎯 Upside target remains well above 3400, aiming for 1000+ pips
Let’s stay focused and let price come to us.
🚀
Disclosure: I am part of TradeNation's Influencer program and receive a monthly fee for using their TradingView charts in my analyses and educational articles.

EURJPY ANALYSIS After seeing the previous daily candle close above key resistance of 172.500 ,we could see a retest of that support and a continuation to the upside

GBPUSD TRADE RECAP AND ANALYSISFrom the previous day we can see the market had a slight retrace and sold into key support area. will price break this area or not? we will have to wait to find out

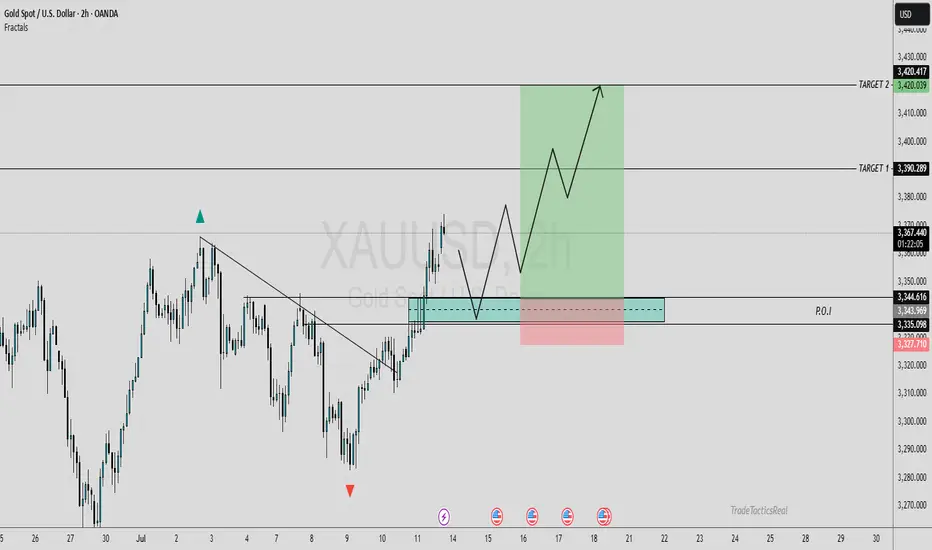
XAUUSD ANALYSISOn gold currently we're analyzing 2H time frame. As we know that current trend was bullish. At this stage, I'm anticipating a retracement towards my Point of Interest (POI), where I’ll be looking for a clear bullish confirmation, ideally through candlestick structure or solid price action. Only upon receiving that confirmation will I consider entering a buy position.
This outlook is based on the higher time frame structure. For now, I'm observing patiently to see how price unfolds. Until the market sweeps the SSL liquidity, I will remain on the sidelines no entries until that key liquidity level has been taken. Confirmation is key.
Always use stoploss for your trade.
Always use proper money management and proper risk to reward ratio.
#XAUUSD 2H Technical Analysis Expected Move.
FX Matrix: DXY, GBPUSD, EURUSD Weekly UpdateWeekly Targets:
DXY: 98.138 - 98.261
GBPUSD: 1.34148 - 1.33606
EURUSD: 1.14463

US10Y & T-Bond Futures Weekly UpdateWeekly Targets:
US10Y: 4.445% - 4.477%
T-Bond: 112.18 - 112.12 - 111.25

Starknet (STRK) 800% move to print? April 5th, 2025** for the months ahead **
On the above 2 day chart price action has corrected 80% since late 2024. A number of reasons now exist to consider a long position. They include:
1. Price action and RSI resistance breakouts.
2. RSI trend reversal.
3. Regular bullish divergence.
4. There are two resistance levels to consider look out for, one at 400% and the next at 800%
Is it possible price action continues to correct? Sure.
Is it probable? No.
Ww
Trading Day SummaryTrading Day Summary
Today wasn’t a winning day on the books, but it was a major win in discipline.
I hit my daily loss limit before 10 AM, stopped live trading, and switched over to paper trades to protect my capital.
The setups I took—especially in Gold and Euro—lacked full confirmation, and one overnight trade didn’t align with my plan.
I experienced around $200 in slippage, which added to the loss.
The bright side? I stayed in control. No revenge trades. No emotional spirals.
My paper trade afterward was textbook—5R+ potential. That tells me the strategy is sound. Execution and timing just need to be sharper.
Bottom line: this is a marathon, not a sprint. I’m proud of the discipline and the mindset. Tomorrow, we reset and refocus.

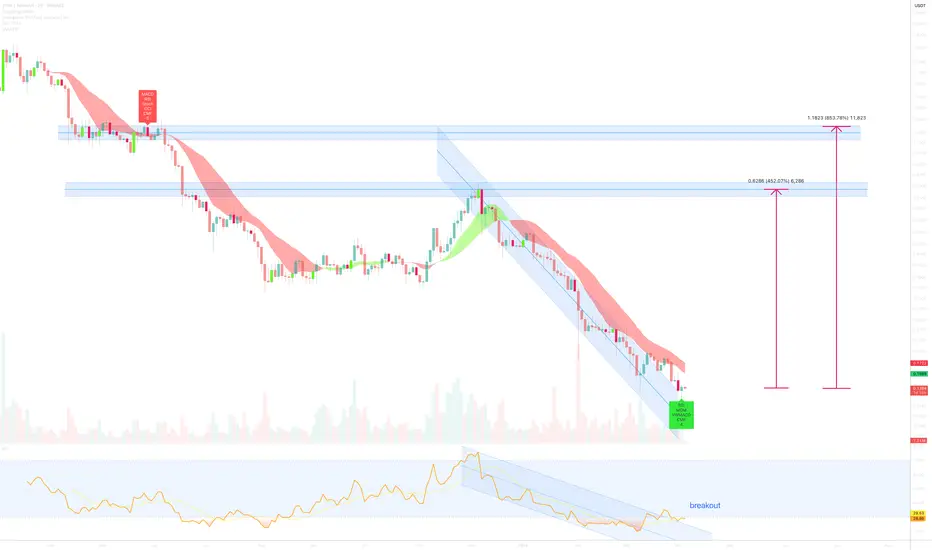
PVSRA Bitcoin AnalysisMay 08 2025 a bullish candle's parallel volume bar broke the threshold in the below pane; indicating price instability, or unfilled orders if you will. June 22 price returns to that full candle body and dips $500 below it, to feel the opposing force and realize orders have been filled and we are in equilibrium. This set up is usually set up and finished in 1-2 weeks (volume absorption) so this 1.5 month setup was an outlier and a grind that paid off BIG patience and knowing your plan of attack is everything in this game, you have to have a plan for every single variable and NEVER stray.
Present day, a 30 minute candle has broken our volume threshold, and weve moved aggressively away from that magnetic force inevitably pulling price back towards it EVENTUALLY as it did june 22nd. Due to the commonality and the recentness of the move that just happened of 5/8-6/22, we can suspect price pattern will repeat and price will be bid up, from 115-120k, where we will then reverse to 103. The bar pattern from the 5'8 6'22 move was copied, pasted, and retrofitted to current time.
Regardless of the exact pattern of the move we expect price eventually to resolve those orders at the 103 mark and our moves are based in that zone. This seems like a range out as we capitulate these 6 figures whilst remaining in a bull market.

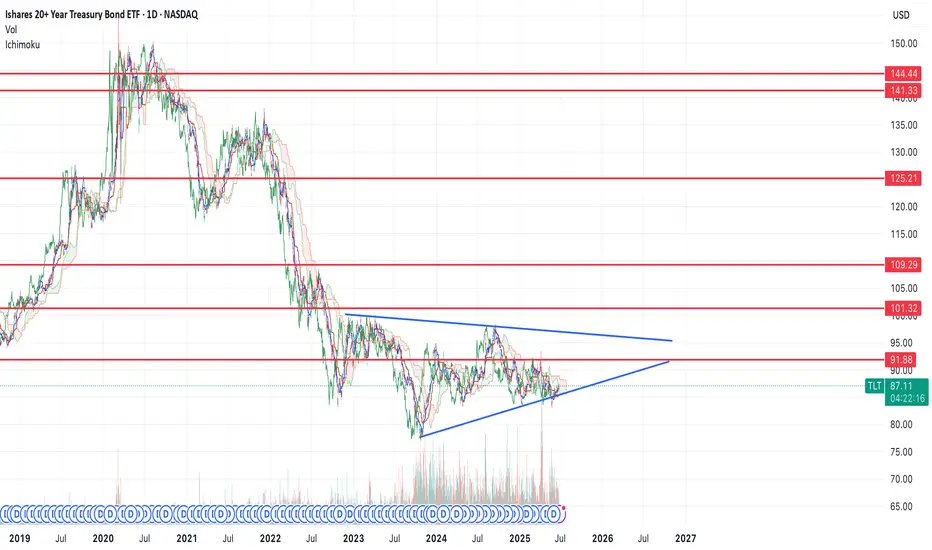
Bottom in for bonds, flight to safety trade coming soon $100+If we look at the chart of TLT, you can see that we're forming a bottoming reversal pattern.
We had a spike low down to $83 back to the middle of May and have now reclaimed the structure. I think that move marked the bottom.
I think it's very likely that bonds spike in the near future, if they can make it over the $92 resistance level, then I think price will see continuation and likely break the pattern finding the first resistance at that $101 level.
That said, I think this is the start of a larger move higher in bonds that will take us all the way up to the top resistance levels over the course of the next few years before the move is done and we start the long term trend in rates higher.
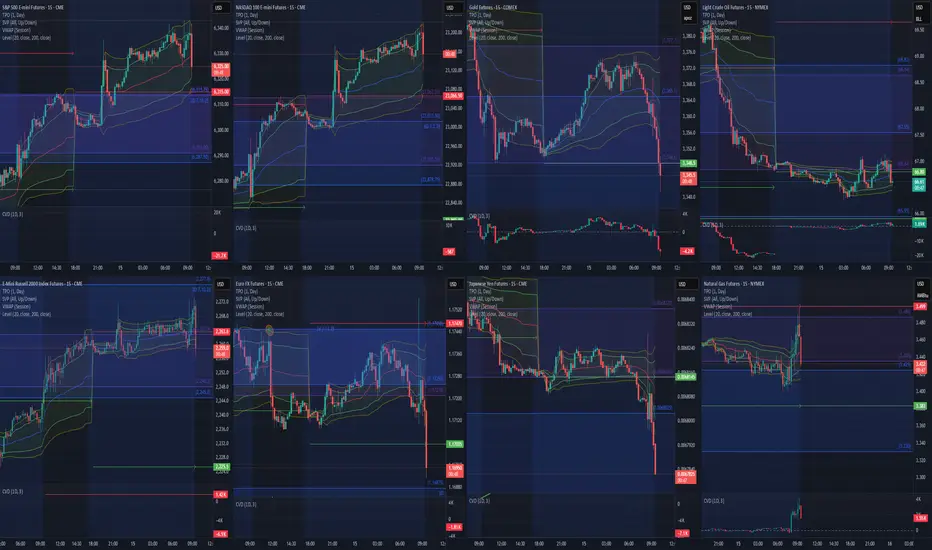
Mid-Session Market ReviewMid-Session Market Review
S&P 500: After some initial volatility from the 8:30 news, the market accepted above the prior day’s levels but has since pulled back within range, consolidating just below the highs.
NASDAQ: The NASDAQ remains above all of yesterday’s levels and is currently balancing between the high of the day and the 23,100 level, showing a rotational pattern.
Russell 2000: This market is rotational within the prior day’s range and has accepted below the CVA and PVA. Potential trade opportunities might come with a pullback to the 2,245 area.
Gold: Gold has accepted below the prior value area and is still rotational within the CVA. Trade opportunities could present themselves near the prior day’s low.
Crude Oil: The market is quite choppy, hovering around the prior day’s low and value area low. Caution is advised, with potential long opportunities on a pullback, as long as conditions align.
Euro Dollar: The Euro is dropping significantly, moving below all key levels without much respect for them. This could provide short opportunities if there’s a pullback.
Yen: Similar to the Euro, the Yen is also pushing below previous levels. It’s getting choppy near the CVA low, so caution is needed until it shows more respect for those levels.
Natural Gas: The market is rotational within the prior day’s range and respecting the CVA high. Long opportunities might be possible if conditions are right.
Aussie Dollar: It’s showing some respect for the CVA low and is still rotational. There could be a potential long setup forming, depending on how it plays out.
British Pound: The Pound has accepted below all key levels, and a pullback to the CVA low might provide short opportunities, though caution is needed around the VWAP.

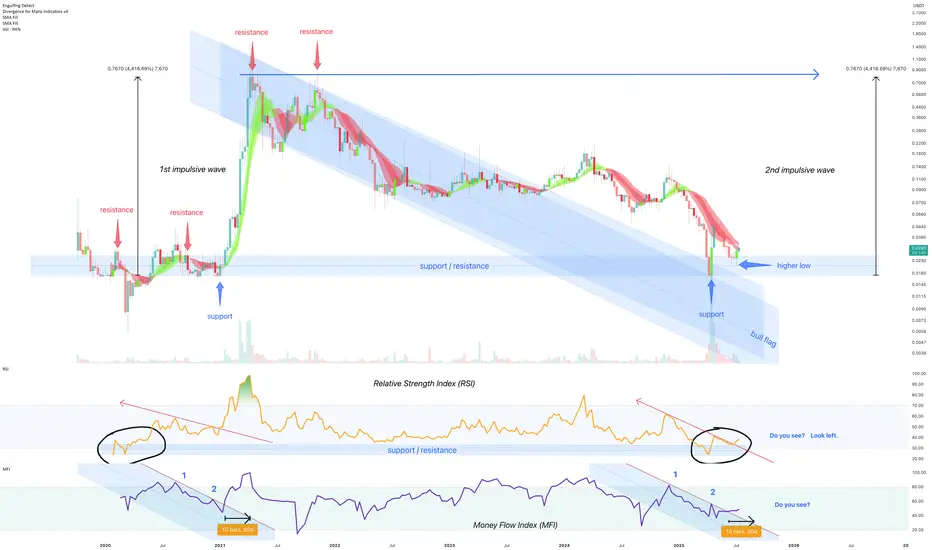
July 2025 - New Kind of Network (NKN) 4000% before October 2025** The months ahead **
On the above 8 day chart price action has corrected 99% since 2021. The chart now displays a compelling technical setup that suggests a strong bullish continuation could be on the horizon.
Bullish Arguments:
Price action forms a clear bull flag pattern
A classic continuation pattern typically appears after a strong upward movement (the "flag pole" or impulsive wave) and is followed by a period of downward consolidation (the "flag"). Albeit the formation rarely prints over such a long period of time for a crypto. The downtrend resistance is now broken with a support confirmation suggesting price action is preparing for another leg up, resuming its prior bullish momentum from 2020.
Strong support confirmation on past resistance
Look left. Historical price zone has proven its significance in the past, acting as both a ceiling and a floor for price movements. The current bounce off past resistance, marked by a higher low, indicates buyers are stepping in at this area. The volume entering the market, collecting emotional seller capitulations, is notable.
Relative Strength Index (RSI) confirms resistance breakout
The Relative Strength Index (RSI) reinforces the bullish outlook. Notice prior to the resistance breakout the index would now print a higher low from the same support area as in 2020.
Money Flow Index (MFI) resistance breakout
The Money Flow Index (MFI) in the lower panel provides excellent confirmation of the bullish sentiment, follow the money! The new money shows a clear pattern of resistance breakout, mirroring previous instances (marked as 1 and 2) where similar money flow preceded to see strong upward moves in price action. This indicates that money is flowing back into the token, for whatever reason I do not know.
Considering the clear bull flag formation, the strong bounce off a critical support/resistance zone, and the confirming signals from RSI and MFI indexes (or indices?!) NKN appears poised for a significant upward continuation.
Is it possible price action continues to print lower lows? Sure.
Is it probable? No.
Ww
Is it right time and choice to buy UNH Stock - {15/07/2025}Educational Analysis says that UNH Stock (USA) may give trend Trading opportunities from this range, according to my technical analysis.
Broker - NA
So, my analysis is based on a top-down approach from weekly to trend range to internal trend range.
So my analysis comprises of two structures: 1) Break of structure on weekly range and 2) Trading Range to fill the remaining fair value gap
Let's see what this Stock brings to the table for us in the future.
Please check the comment section to see how this turned out.
DISCLAIMER:-
This is not an entry signal. THIS IS FOR EDUCATIONAL PURPOSES ONLY.
I HAVE NO CONCERNS WITH YOUR PROFIT OR LOSS,
Happy Trading.

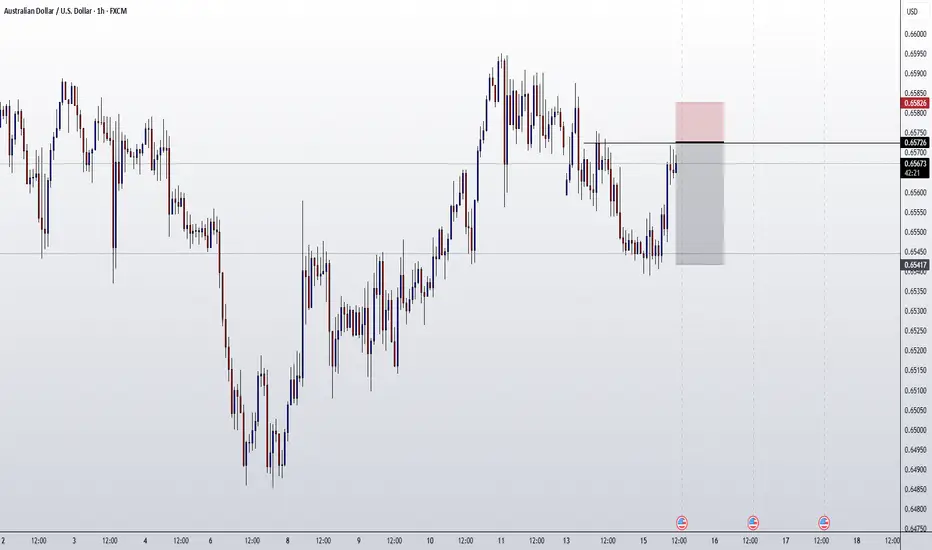
AUDUSD ENTRY CHARTOn this pair, we are still BEARISH, First we have our trend still on the a DOWNTREND, also on the Hourly, we got a strong KEY LEVELs+ INDUCEMENT/IMBALANCE,we got our confirmation on the LTF already, we are waiting for Price to get us IN, we also have other additional confluence on this PAIR, So if this matches with your IDEA, you can look to join us with a good risk, also note that we have got STRONG INFLATION RATE NEWS on the DOLLAR, so be watchful. THANK YOU>
Pre-Market PrepToday’s market insights show a lot of potential opportunities across the board:
S&P 500: We’re in a strong upward imbalance, trading above the prior day’s range and value area. The focus is on long opportunities, but waiting for confirmation on any pullbacks.
NASDAQ & Russell 2000: Similar to the S&P, both are also in an upward imbalance. For the Russell, there’s a specific focus on looking for long setups around the prior day’s high.
Gold: The market is rotational within the prior day’s range and value area, with a slight bias toward looking for long opportunities from the lower end of that range.
Crude Oil: After some initial volatility, it has settled back into the prior day’s range. Long opportunities look promising, especially on a pullback to the CVA low.
Euro Dollar: The market is a bit low on volume and holding below the CVA. Longs are considered if we see acceptance back into that area, while shorts are on the table if we remain below the prior day’s value area.
Yen Dollar: Trading below the prior day’s range and value area, the focus is on short opportunities, especially if we see continued acceptance below key levels.
Aussie Dollar: It’s rotational and currently above the prior day’s value area, making both long and short opportunities viable, depending on how the market moves.
Nat Gas: It’s also rotational within the prior day’s range, but further analysis is needed after updating levels.
Overall, the strategy is to trade smart, confirm setups, and stay aware of the bigger trends while managing risk.
buy projectionBullish structure(high,low,irl).
Liquidity: sweep and inducement
Point of interest: orderblock