July 2025 - Internet computer ICP ;-(Every other week Without Worries is asked for his thoughts on Internet Computer project. It is very clear a number of folks are invested and for a few it is the only crypto token they hold.
Disclaimer . Without Worries does not hold or trade this crypto token. My opinion is impartial.
Two questions every trader or investor must ask themselves before exposure to any asset:
What is the trend?
Support or resistance, which is it?
To not answer either or even ignore the answers; that is to ignore the facts of the chart. You’re here to make money, nothing else.
The questions are best answered on a higher time frame where possible, especially a time frame where market pivots align with the Relative Strength Index (RSI).
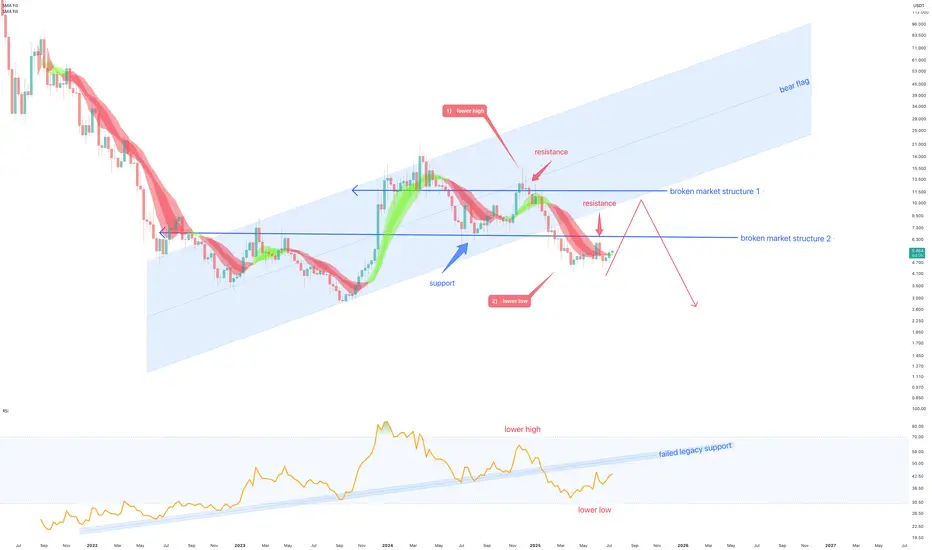
Question 1, what is the trend?
Start by looking left, on both Price action and RSI. The first lower high is observed in tandem with a lower high in RSI. This trend is matched in RSI as lower lows in price action and RSI break legacy support. This is clearly a downtrend.
Question 2, Support or resistance, which is it?
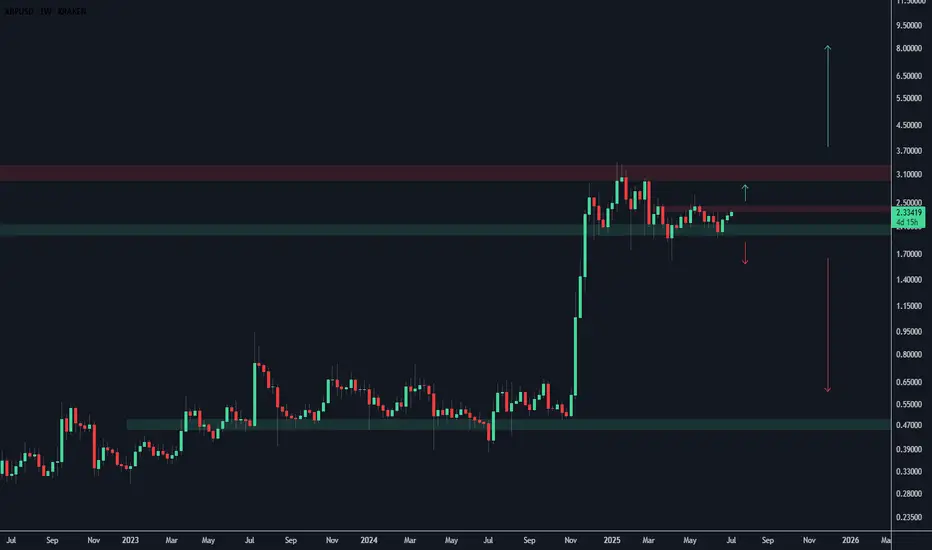
As before, look left. Typically best to start with higher timeframes. Support levels are identified by observing historical price charts where the asset has repeatedly stopped falling and reversed upwards. Similarly, resistance levels are identified by observing historical price action where the asset has repeatedly stopped rising and reversed downwards. These levels are often marked by previous swing highs, areas where the price has consolidated, or psychological round numbers (blue and red arrows).
It is fairly clear price action on the above chart now finds resistance on past support.
Bonus observation
With questions 1 and 2 both answered, it is clear future price action favours a bearish outlook on the macro outlook. A long term bear flag has established, now awaiting confirmation. That confirmation shall be a print of rejection from the underside of the flag, which will also be an additional lower high around $10. It is entirely possible (and is often the situation for flags to print their forecasts without confirmation!). After the confirmation price action will begin its decent towards 60 cents.
ww
Multiple Time Frame Analysis
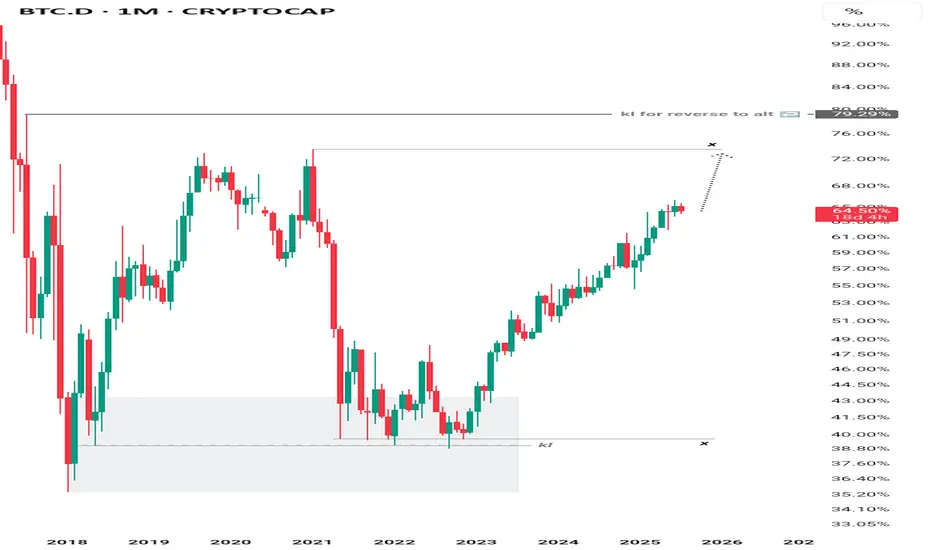
BTC Dominance Maintains UptrendBTC dominance continues its climb toward the 73% region, with no significant signs of altcoin capital rotation at this stage. Market structure remains intact in favor of Bitcoin leadership.

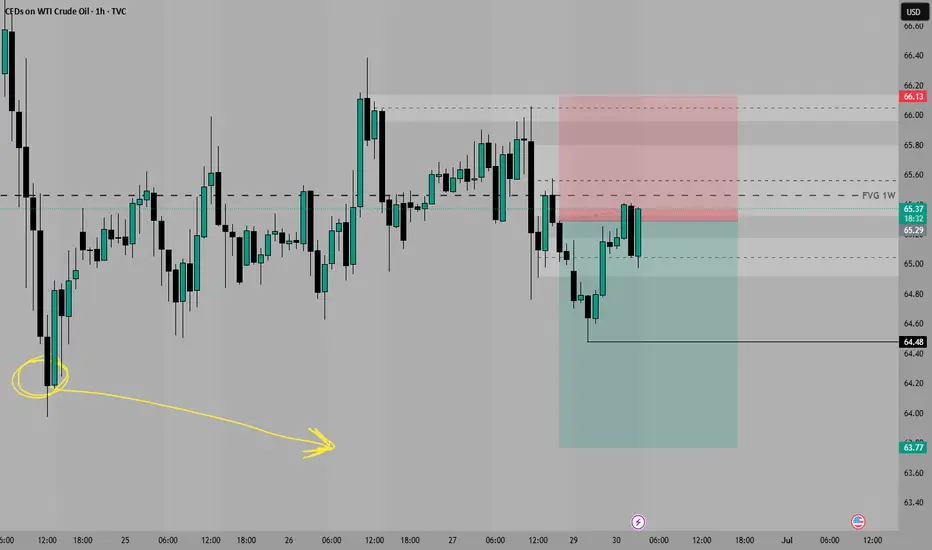
USOILBroke below strong daily support zone for about two months but came back above and looks to have retested the zone properly. Minor H4/H1 resistance around 66.70 that needs to be broken before possibly moving higher.

Spell Token (SPELL)On the above 2-day chart price action has corrected over 80%. A number of reasons now exist to be long, including:
1) Price action and RSI resistance breakouts.
2) Price action corrects to past resistance/support.
3) Price action backtest is also the Fibonacci 0.236
4) Finally, the flag breakout projects a 150% target.
Is it possible price action falls further? Sure.
Is it probable? no.
Ww
Type: trade
Risk: <=6%
Timeframe: Longs from now until month end
Return: 150%

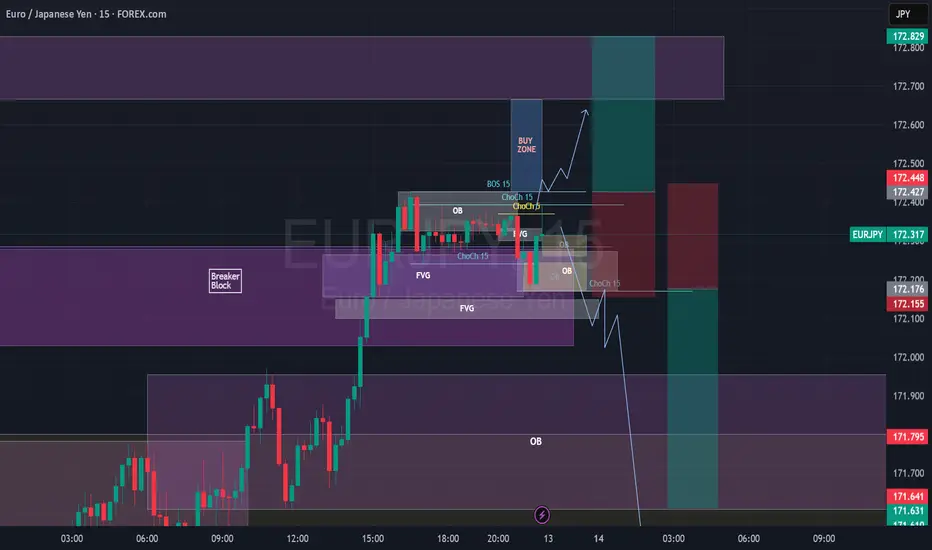
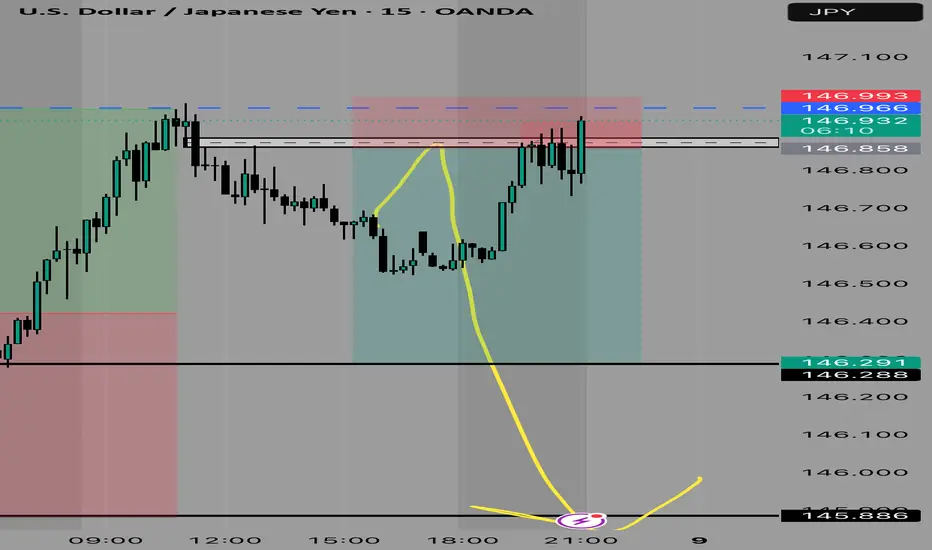
EURJPY Break of Structure, Retest and Fly5m - Monthly timeframes Bullish.
Price body candle closed and retested a 1H BB on 1H Timeframe.
Also retesting a 5M Bullish OB.
I want to wait for price to body candle close above the 15m BoS, create 3m/5m ChoCh, retest and look for Buys towards 172.665 (at the 1H OB or potentially 172.829, top of the 1H OB. SL under the 15m ChoCh.
SYRMA Weekly Breakout | High Volume + 1.5-Year Base Structure🚨 Breakout Alert on SYRMA (Weekly)
After 1.5 years of sideways consolidation, SYRMA has finally broken out with strong conviction. The breakout is supported by the highest weekly volume seen in months — signaling smart money accumulation.
📊 Technical Setup:
🔹 1.5-year base formation now broken
🔹 Breakout candle closed above resistance with strength
🔹 Volume spike confirms breakout validity (HVE)
🔹 Structure resembles classic Stage 2 breakout
🟢 Ideal retest zone: ₹670–₹680
🛑 Support zone: ₹635–₹645
Fundamental Snapshot:
✅ Revenue: ₹2,000 Cr → ₹3,800 Cr in 2 years
✅ Net Profit up 50% YoY
✅ EPS (TTM): ₹9.57
✅ Promoter holding: ~46%
✅ Dominant player in EMS & IoT hardware
⚡Macro trend supports domestic electronics manufacturing — still early in the cycle.

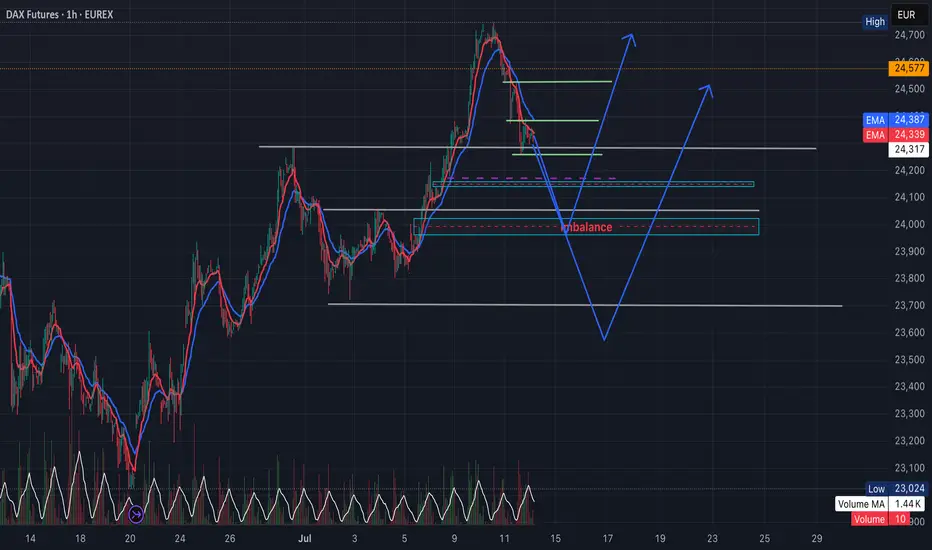
DAX Futures FDAX1!) Imbalance Fill Before Bullish Continuation?Analysis Summary:
1. Current pullback after a strong impulse move suggests a short-term retracement.
2. The imbalance zone (highlighted in red) around 23,970–24,010 may act as a magnet.
3. Alternatively, price may continue lower to tap into 4H demand / liquidity zone before reversing upward.
📌 Educational purpose only. Not financial advice.
Let me know your thoughts or if you see it differently — open to feedback!
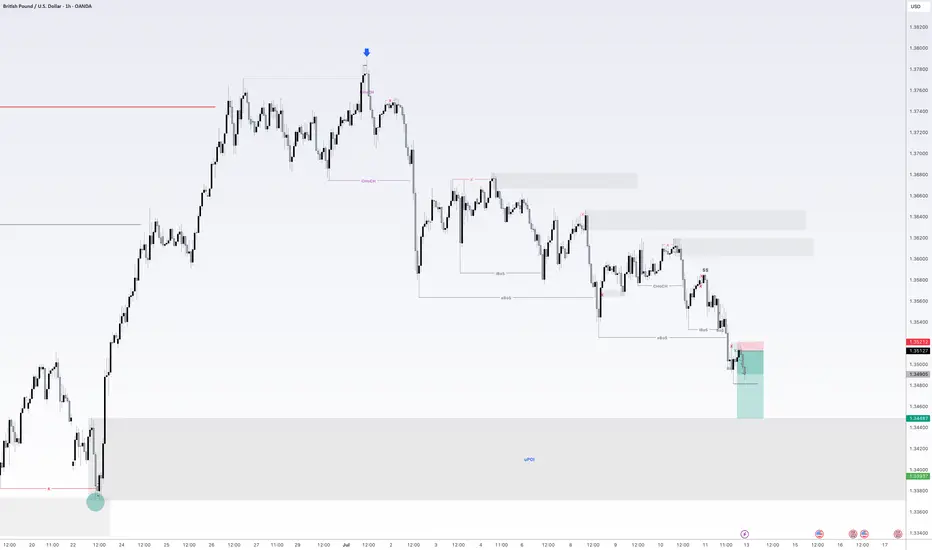
GBPUSD - Also continued downside continuationLooking at GU. This is a little bit ahead of its time in comparison to EU.
And what i mean by that is EU is a lot further away from its 4H demand zone compared to GBP so it will be super interesting to see how we react at the level we are fast approaching on GU.
I am in a short position as of Friday. I will be posting a video tomorrow showing exactly how and why i got short on GU so stay tuned for that one.
As always if there is anything else i can be of assistance with give me a message and i will be happy to answer any questions you may have
EURUSD - Still Orderflow remains bearishLooking at EU. The 1H Orderflow is still maintaining that bearish intent. My area is set now for where i want to take a potential sell to the downside seeing as everything else is pretty much mitigated.
The only issue with this potential sell of is that we never really had a sweep of liquidity before we rolled over and moved to the downside.
We do have a level of inducement before our POI but i think in an ideal world i would love to see us build up a bit more liquidity before the POI just to induce the early sellers before making that move to the downside.
For now. On the lower TF's i will be looking to take short term long positions back up to our POI before looking for the longer terms short. to our 4H POI in which i will be looking to get long once again.
Any questions feel free to give me a message

OIL IDEA /30 06 25So we are looking for this Short position, but first we need a better Premium position
POPCAT IDEA 29/06/25Any retracement to the 1D FVG could be a nice entry if you are not in yet
Let´s see how it respond to Premium Zone and we could expect go for mayor liquidity

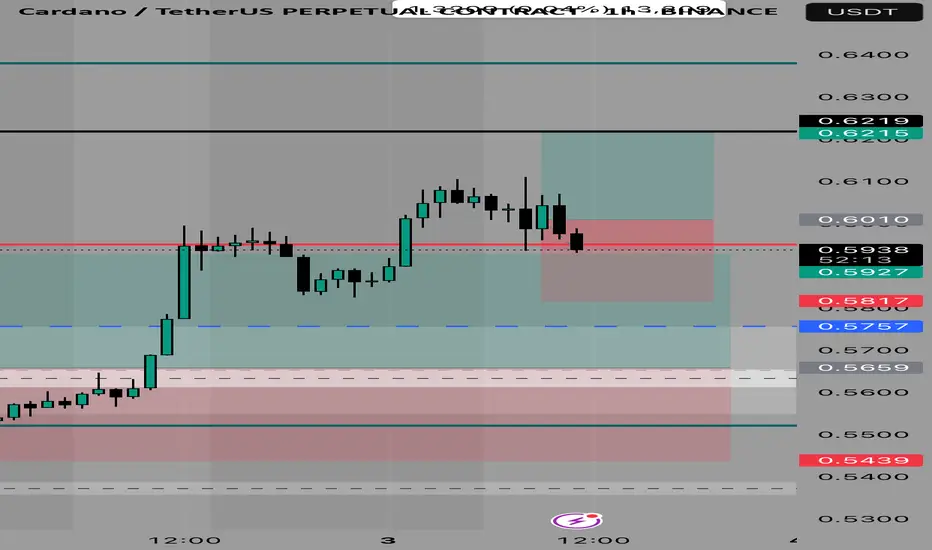
ADA idea 03 07 25Grids can it’s a great way to deal with volatility and timming within a range with clear PD Arrays
USDJPY IDEA 08/07/25So we are looking for a Discount Zone with this one. Since we are in a Premium PD Array, we are expecting a short term reversal
XRP Weekly ChartMoving up within this range since recent highs.
See if it breaks above $2.50 again or if it rejects and continues lower.
Breaking above last weeks candle already.
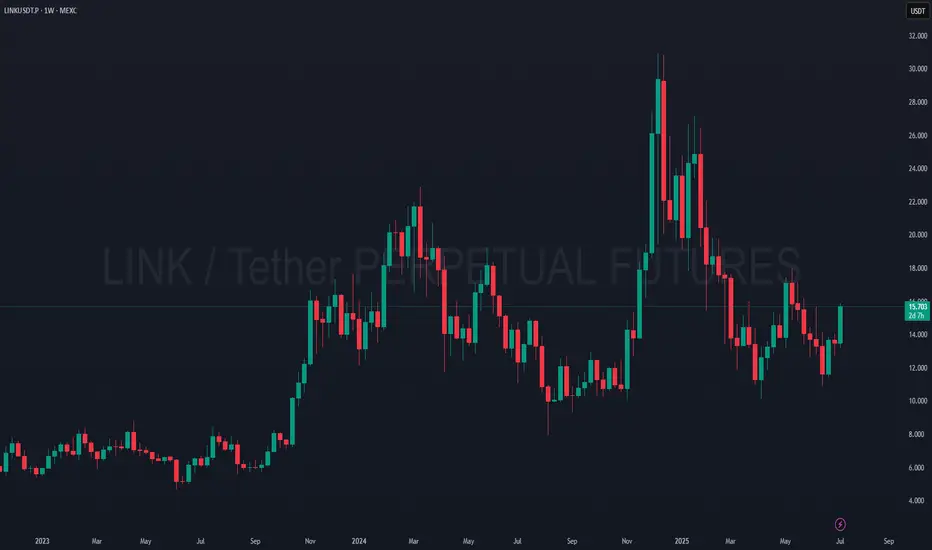
LINK – MTF BreakdownBeen tracking this one across the board – Daily, 4H, and 15M are now all in sync. Bullish structure is clear, but we’re entering mid-to-premium zones so it’s more about patience now.
Daily Outlook
Structure broke up above 14.80 and we’re holding above the high-volume zone around 14.50.
Clean reclaim of value and FVG filled – price is now dancing near the top of that range.
Still some room before the big HTF resistance up at 18+.
4H Structure
Solid HH/HL trend holding.
Fibs and volume aligned: 14.85 was the 0.618 zone from the last leg and it bounced right off.
If bulls defend the 15.20–15.50 pocket, momentum stays with them.
15M Zoom-In
HLs forming cleanly. That 15.20–15.50 zone? It’s loaded – FVG, OB, and a breaker block all stacked in there.
Price poked into some light supply around 15.85 – we either squeeze through soon or pull back first.
Zones I’m Watching Over Next 1–3 Days:
14.80–15.00 → reload zone if we dip
15.20–15.50 → key intraday decision area
15.85–16.00 → first real test of breakout strength
18.00–18.80 → HTF magnet zone if momentum continues
Staying patient here. No rush to chase. Just watching how price behaves around those stacked zones. If 15.20 holds firm, I’ll stay bullish through the weekend.
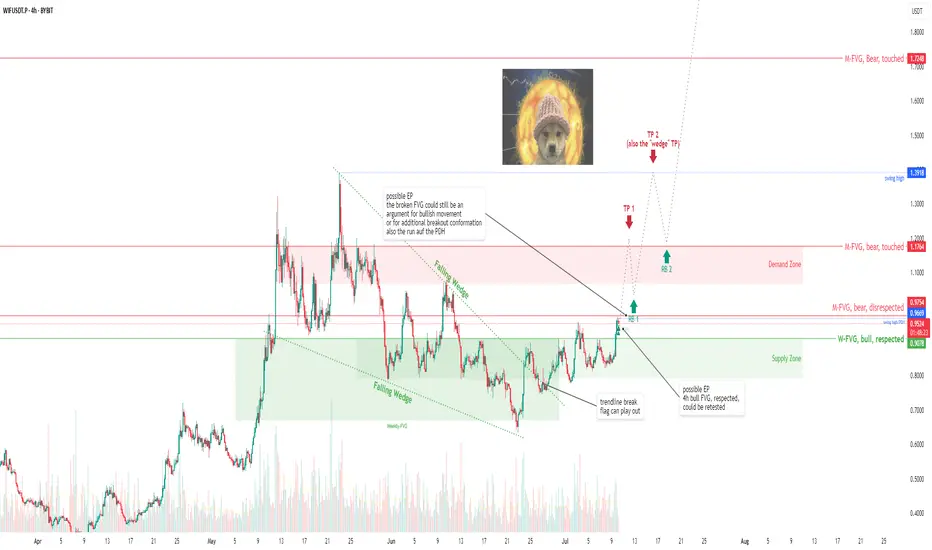
WIF/USDT: A dog wif hat lost faith but may become Pehoenix soon WIF/USDT: A dog wif hat lost faith but may become Pehoenix soon
after a long lasting crash WIF started a decent move again
was heavyly rejected
in consolidation since then
building a "Falling Wedge"
the supposed breakout happend
but there is still way more to come
For this one I'm not going to explain everything in detail what me made find my BIAS, narrative etc.
But at least enough Information that should be "useful" or "work you must not do buy yourself then".
That could be the beginning of a race back to at least baseline or somehow below.
For now, the trade is only planed to TP 1. Also im already in.
I stepped in cuz:
- there are several FVGs on several timeframes. The price is likely to play them out and should than react that way. I followed them and we should be bullish now. One good argument is that the weekly bullish FVG keeps nicely respected, while the bearish monthly FVG is actually struggeling.
- very bullish Price Action on WIF
- the TP from the "Falling Wedge" alone would be 1.3943
So TP1 + 2 got really much conflunce. And 3 as well, tru pressure from the market. Maybe even higher, but im not that far yet.
I closed a WIF trade that evening, did the analysis after that, and just opened it again without trigger :D
But there are triggers and u should use them:
RB 1+2+3
Price Action
pullbacks into FVGs on 1h f.e.
"Hammer" candles with high Volumen
break of structure on a LTF
That was the second Idea i made here ever. So i'm happy you made it that far, thank you.
Also feel free to comment the trade/the writing style, question, whatever.
Sugartongue, and my hunger is still young. But I'll chase lights until the morning comes. And the world is flashing at the window.
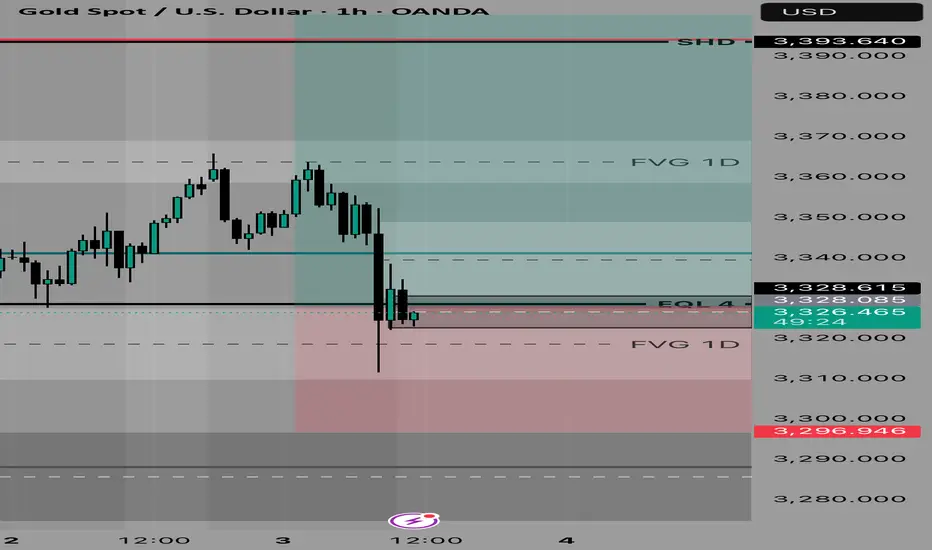
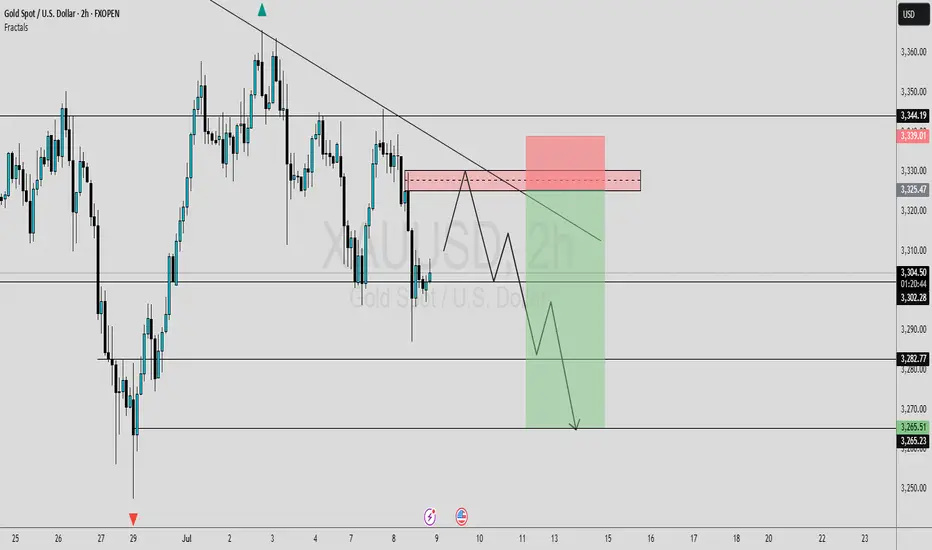
#GOLD UPDATESIn this analysis we're focusing on 2H timeframe for finding the upcoming changes in gold price.
Here we can see clearly that gold price creates trendline resistance and also price sweep all the SSL and pre. daily LQ sweep. Now I'm waiting for retracement, If price retest my supply zone and give bearish sign or reversal confirmation than we'll execute our trades. This is a higher time frame outlook. Further analyze more deeply into smaller time frame and place our position from an perfect point.
Always use stoploss for your trade.
Always use proper money management and proper risk to reward ratio.
Keep an eye on these levels. Confirmation is key.
#XAUUSD 2H Technical Analysis Expected Move.
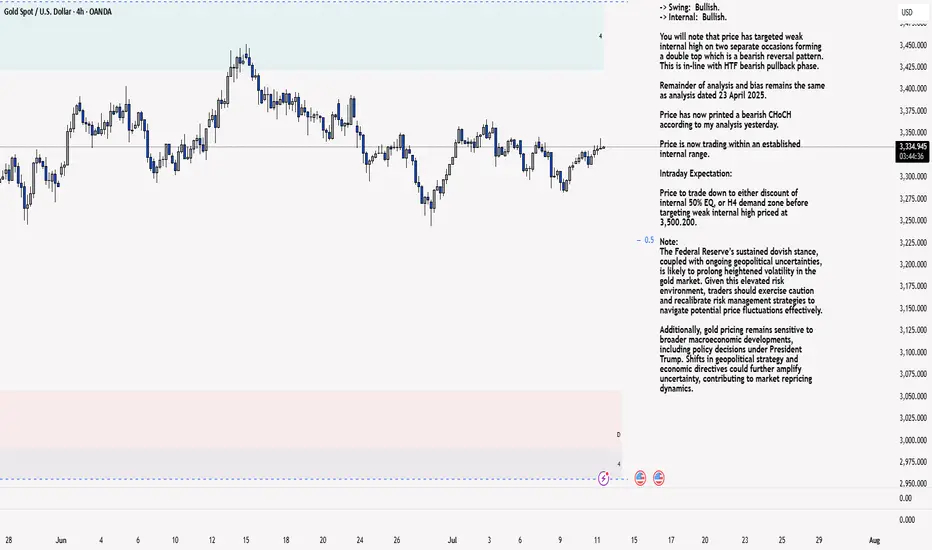
XAU/USD 11 June 2025 Intraday AnalysisH4 Analysis:
-> Swing: Bullish.
-> Internal: Bullish.
You will note that price has targeted weak internal high on two separate occasions forming a double top which is a bearish reversal pattern. This is in-line with HTF bearish pullback phase.
Remainder of analysis and bias remains the same as analysis dated 23 April 2025.
Price has now printed a bearish CHoCH according to my analysis yesterday.
Price is now trading within an established internal range.
Intraday Expectation:
Price to trade down to either discount of internal 50% EQ, or H4 demand zone before targeting weak internal high priced at 3,500.200.
Note:
The Federal Reserve’s sustained dovish stance, coupled with ongoing geopolitical uncertainties, is likely to prolong heightened volatility in the gold market. Given this elevated risk environment, traders should exercise caution and recalibrate risk management strategies to navigate potential price fluctuations effectively.
Additionally, gold pricing remains sensitive to broader macroeconomic developments, including policy decisions under President Trump. Shifts in geopolitical strategy and economic directives could further amplify uncertainty, contributing to market repricing dynamics.
H4 Chart:
M15 Analysis:
-> Swing: Bullish.
-> Internal: Bullish.
H4 Timeframe - Price has failed to target weak internal high, therefore, it would not be unrealistic if price printed a bearish iBOS.
The remainder of my analysis shall remain the same as analysis dated 13 June 2025, apart from target price.
As per my analysis dated 22 May 2025 whereby I mentioned price can be seen to be reacting at discount of 50% EQ on H4 timeframe, therefore, it is a viable alternative that price could potentially print a bullish iBOS on M15 timeframe despite internal structure being bearish.
Price has printed a bullish iBOS followed by a bearish CHoCH, which indicates, but does not confirm, bearish pullback phase initiation. I will however continue to monitor, with respect to depth of pullback.
Intraday Expectation:
Price to continue bearish, react at either M15 supply zone, or discount of 50% internal EQ before targeting weak internal high priced at 3,451.375.
Note:
Gold remains highly volatile amid the Federal Reserve's continued dovish stance, persistent and escalating geopolitical uncertainties. Traders should implement robust risk management strategies and remain vigilant, as price swings may become more pronounced in this elevated volatility environment.
Additionally, President Trump’s recent tariff announcements are expected to further amplify market turbulence, potentially triggering sharp price fluctuations and whipsaws.
M15 Chart:
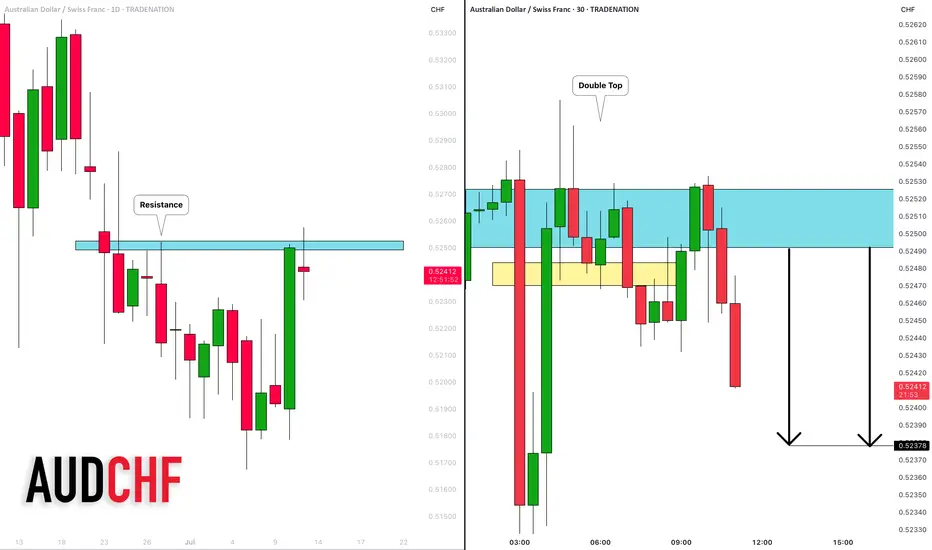
AUDCHF: Pullback From Resistance 🇦🇺🇨🇭
AUDCHF is going to retrace from a key daily resistance.
As a confirmation, I spotted a double top pattern on 30 minutes time frame
and a very bearish reaction after CHF fundamental news releases an hour ago.
Goal - 0.5238
❤️Please, support my work with like, thank you!❤️
I am part of Trade Nation's Influencer program and receive a monthly fee for using their TradingView charts in my analysis.
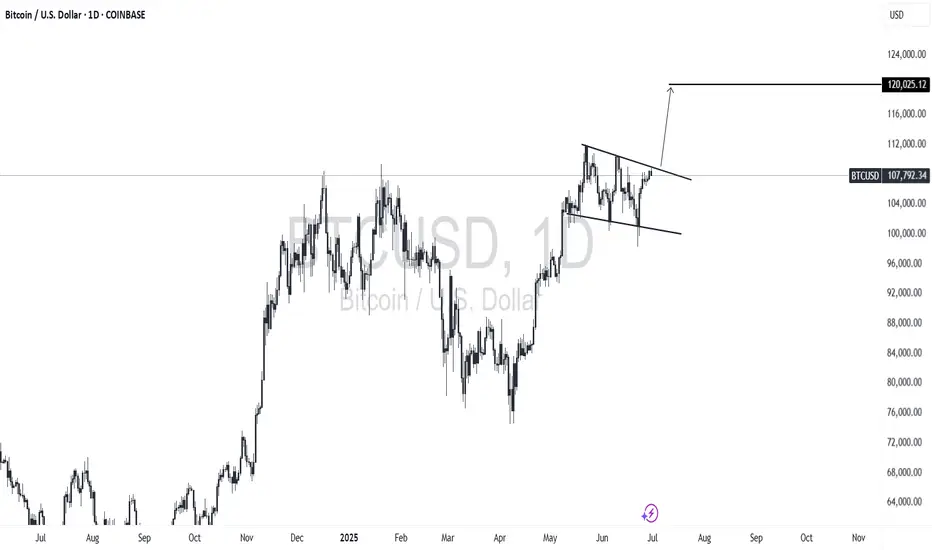
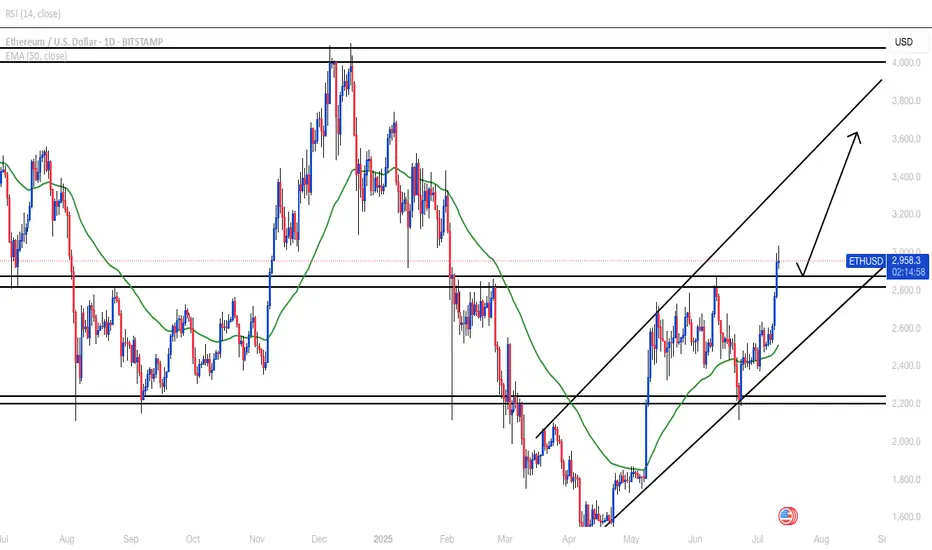
BTC is clearly gearing up for its next big move.Could we see 120k next per the pattern unfolding before us?
It may not (or it could) happen now, but BTC definitely looking BULLISH!