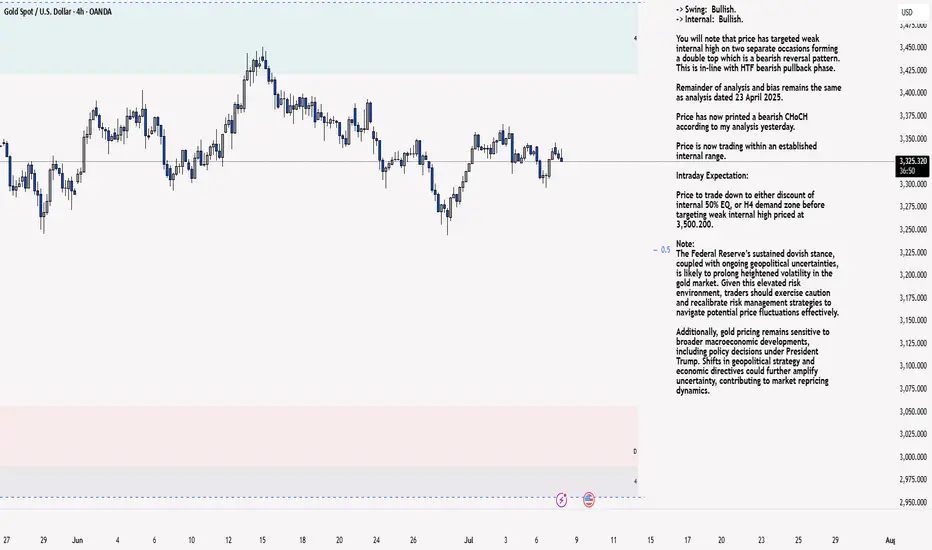
XAU/USD 09 July 2025 Intraday AnalysisH4 Analysis:
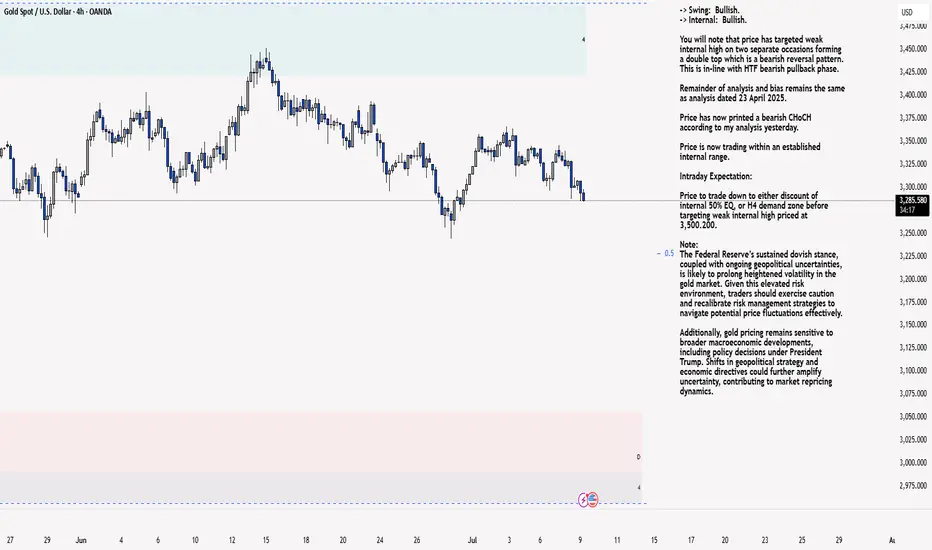
-> Swing: Bullish.
-> Internal: Bullish.
You will note that price has targeted weak internal high on two separate occasions forming a double top which is a bearish reversal pattern. This is in-line with HTF bearish pullback phase.
Remainder of analysis and bias remains the same as analysis dated 23 April 2025.
Price has now printed a bearish CHoCH according to my analysis yesterday.
Price is now trading within an established internal range.
Intraday Expectation:
Price to trade down to either discount of internal 50% EQ, or H4 demand zone before targeting weak internal high priced at 3,500.200.
Note:
The Federal Reserve’s sustained dovish stance, coupled with ongoing geopolitical uncertainties, is likely to prolong heightened volatility in the gold market. Given this elevated risk environment, traders should exercise caution and recalibrate risk management strategies to navigate potential price fluctuations effectively.
Additionally, gold pricing remains sensitive to broader macroeconomic developments, including policy decisions under President Trump. Shifts in geopolitical strategy and economic directives could further amplify uncertainty, contributing to market repricing dynamics.
H4 Chart:
M15 Analysis:
-> Swing: Bullish.
-> Internal: Bullish.
H4 Timeframe - Price has failed to target weak internal high, therefore, it would not be unrealistic if price printed a bearish iBOS.
The remainder of my analysis shall remain the same as analysis dated 13 June 2025, apart from target price.
As per my analysis dated 22 May 2025 whereby I mentioned price can be seen to be reacting at discount of 50% EQ on H4 timeframe, therefore, it is a viable alternative that price could potentially print a bullish iBOS on M15 timeframe despite internal structure being bearish.
Price has printed a bullish iBOS followed by a bearish CHoCH, which indicates, but does not confirm, bearish pullback phase initiation. I will however continue to monitor, with respect to depth of pullback.
Intraday Expectation:
Price to continue bearish, react at either M15 supply zone, or discount of 50% internal EQ before targeting weak internal high priced at 3,451.375.
Note:
Gold remains highly volatile amid the Federal Reserve's continued dovish stance, persistent and escalating geopolitical uncertainties. Traders should implement robust risk management strategies and remain vigilant, as price swings may become more pronounced in this elevated volatility environment.
Additionally, President Trump’s recent tariff announcements are expected to further amplify market turbulence, potentially triggering sharp price fluctuations and whipsaws.
M15 Chart:
Multiple Time Frame Analysis
AMP(ASX) Monthly ChartDoubling up on my prior post,
The quarterly and the monthly chart both have the same 2618 pattern present
If today closes where it is we will have the same bullish pattern on 2x timeframes both with bullish hammer patterns present

US10Y & T-BOND Weekly UpdateWeekly Target: 4.432% - 4.412%
- Yield drifted down to ~4.23% despite strong data.
- Market still pricing in rate cuts later this year.
- Divergence: Durable Goods, GDP, and PMI were solid — but yields faded → risk-on demand + safe haven unwind.

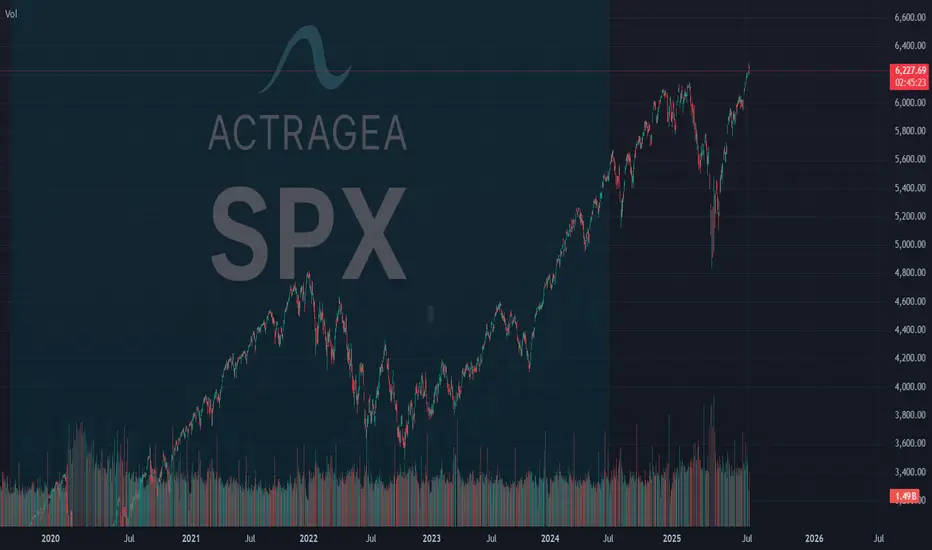
SPX: 75% chance Multi-Timeframe Reversal to 5,775-6,103 Zone **SPX MULTI-TIMEFRAME CYCLE CONFLUENCE ANALYSIS - SUPER VERSION**
**CURRENT SITUATION: July 7, 2025 - Price: 6,238**
Based on our quantitative cycle analysis across 4 timeframes, applying **ACTRAGEA hierarchical dominance principles** where ITM >> MTY >> TCY >> TYL.
---
## **CYCLE HIERARCHY STATUS**
| **Timeframe** | **Cycle Phase** | **Status** | **Hierarchy** | **Key Level** |
|---------------|-----------------|------------|---------------|---------------|
| **ITM (1D)** | Phase 2 | FLAT | **DOMINANT** | Max: 6,284.65 **awaiting confirmation** |
| **TCY (1H)** | Phase 2 | FLAT | Secondary | Max: 6,284.65 **awaiting confirmation** |
| **MTY (270m)** | Phase 1 | LONG (+1.64%) | Subordinate | Seeking max: 6,359 |
| **TYL (15m)** | Phase 2 | LONG (+0.11%) | Subordinate | Max: 6,242.7 **awaiting confirmation** |
---
## **PRIMARY SCENARIO (Probability: 75%)**
**DIRECTIONAL BIAS:** **Multi-timeframe reversal upon ITM maximum confirmation**
**RATIONALE:**
- **ITM timing**: 0 bars remaining from 50° percentile window → Maximum at 6,284.65 **awaiting confirmation** → Statistical pressure for confirmation increases daily
- **Hierarchical cascade**: **When ITM confirms maximum** → all subordinate cycles transition into Phase 3 (minimum search)
- **Current LONG positions** (MTY +1.64%, TYL +0.11%) face hierarchical override risk upon ITM maximum confirmation. Subordinate cycles will align regardless of current profitability.
**STATISTICAL PRICE LEVELS (50° Percentile):**
- **ITM**: 5,775.84
- **TCY**: 6,103.58
- **MTY**: 5,996.35
- **TYL**: 6,170.98
**STATISTICAL TIME WINDOWS (50° Percentile):**
- **ITM**: 65 bars | **TCY**: 58 bars | **MTY**: 62 bars | **TYL**: 81 bars
**EXTREME SCENARIOS (20° Percentile):**
- **ITM**: 5,420.71 | **TCY**: 5,934.73 | **MTY**: 5,728.16 | **TYL**: 6,084.71
---
## **⚠️ ALTERNATIVE SCENARIO (Probability: 25%)**
**DIRECTIONAL BIAS:** ITM extension toward 80° percentile before maximum confirmation
**CONDITION:** ITM exceeds statistical time boundaries, allowing subordinate cycles temporary independence
---
## **CRITICAL DECISION POINT**
**Confirmation Trigger:** ITM maximum validation at 6,284.65 → Phase 2→3 transition → Activation timeframe: Within 1-3 trading sessions (statistical pressure)
**Hierarchy Activation:** Immediate subordinate cycle alignment into Phase 3 upon ITM confirmation
**Invalidation:** Sustained break above 6,285 (negates ITM maximum thesis)
---
## ** PROBABILITY FOUNDATION**
**75% probability derived from:**
- ITM expired timing creating high statistical pressure for confirmation
- Historical dominance patterns (85%+ subordination rate upon ITM phase changes)
- Dual Phase 2 alignment (ITM + TCY at identical maximum level awaiting confirmation)
---
## **ACTRAGEA METHODOLOGY FOUNDATION**
Our **quantitative cycle framework** operates on **hierarchical dominance principles** where longer timeframes command shorter ones. Statistical levels represent **50° percentile probabilities**, not certainties. The **ITM critical juncture** at 6,284.65 creates high-probability setup for **coordinated multi-timeframe reversal initiation**.
**Performance Context:** Systems demonstrating 65.71% to 82.86% statistical reliability across timeframes.
---
*Analysis based on ACTRAGEA hierarchical cycle principles and statistical percentile distributions. All levels represent probabilities, not guaranteed outcomes.*
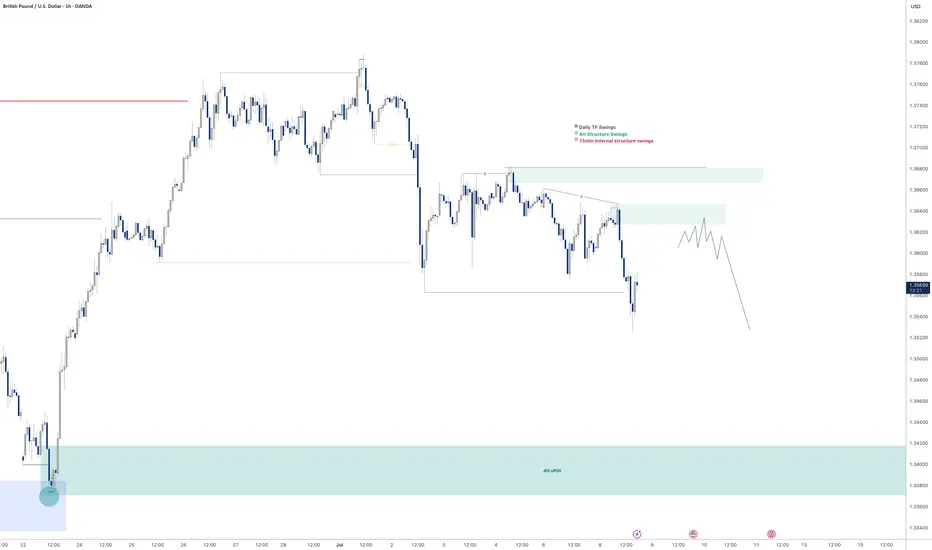
GBPUSD - 2 potential selling opportunitiesLooking at GBPUSD
We have 2 potential selling POI's.
The first one being a point in which we will need to sit on our hands for a little bit to see what price does at there is no inducement in the push down in the impulse leg. With that being the case we will need to see some sort of inducement built before we enter that POI
IF we clear the first POI I think I will take a more aggressive entry on the secondary POI that sits a little bit higher. This is due to us having already put in some sort of liquidity in and around that POI before pushing lower.
Will wait and see what happens.
Tomorrow could be a very good trading day
Bear signalsLooking for 22500 Im thinking. Banks trade the round numbers and the round numbers for nas are 125 point increments
GBP/JPYGBP/JPY has been bullish since April, since then price has reached a significant key area at 199.000-200.000. Over the next few days/weeks i shall be watching this pair to see if price rejects this key zone or if its able to push through. This will determine my next move as to whether we go short or long.

EURUSD Short, 08 JulyHTF Bearish Continuation & Intraday Confirmation
HTF bias remains bearish, reacting from W/D OB and completing the daily imbalance left from yesterday. Now looking for continuation lower, supported by a clean 4H OB.
📉 Confluence:
15m Decisional OB in play
5m OB entry zone with a clean 1m BOS
DXY gap + imbalance still open in our favor + Correlation between EU and DXY
Asia session structure aligned
🎯 Entry: Retest of 5m OB after 1m BOS
🛡️ SL: Above recent high, ~10 pips
📌 TP: Asia low – 1:3 RR
⚠️ Risk: OB is mid-Asia (less ideal), and DXY Daily imbalance not filled yet
Still a solid setup with structure + HTF narrative backing it.

XAU/USD 08 June 2025 Intraday AnalysisH4 Analysis:
-> Swing: Bullish.
-> Internal: Bullish.
You will note that price has targeted weak internal high on two separate occasions forming a double top which is a bearish reversal pattern. This is in-line with HTF bearish pullback phase.
Remainder of analysis and bias remains the same as analysis dated 23 April 2025.
Price has now printed a bearish CHoCH according to my analysis yesterday.
Price is now trading within an established internal range.
Intraday Expectation:
Price to trade down to either discount of internal 50% EQ, or H4 demand zone before targeting weak internal high priced at 3,500.200.
Note:
The Federal Reserve’s sustained dovish stance, coupled with ongoing geopolitical uncertainties, is likely to prolong heightened volatility in the gold market. Given this elevated risk environment, traders should exercise caution and recalibrate risk management strategies to navigate potential price fluctuations effectively.
Additionally, gold pricing remains sensitive to broader macroeconomic developments, including policy decisions under President Trump. Shifts in geopolitical strategy and economic directives could further amplify uncertainty, contributing to market repricing dynamics.
H4 Chart:
M15 Analysis:
-> Swing: Bullish.
-> Internal: Bullish.
H4 Timeframe - Price has failed to target weak internal high, therefore, it would not be unrealistic if price printed a bearish iBOS.
The remainder of my analysis shall remain the same as analysis dated 13 June 2025, apart from target price.
As per my analysis dated 22 May 2025 whereby I mentioned price can be seen to be reacting at discount of 50% EQ on H4 timeframe, therefore, it is a viable alternative that price could potentially print a bullish iBOS on M15 timeframe despite internal structure being bearish.
Price has printed a bullish iBOS followed by a bearish CHoCH, which indicates, but does not confirm, bearish pullback phase initiation. I will however continue to monitor, with respect to depth of pullback.
Intraday Expectation:
Price to continue bearish, react at either M15 supply zone, or discount of 50% internal EQ before targeting weak internal high priced at 3,451.375.
Note:
Gold remains highly volatile amid the Federal Reserve's continued dovish stance, persistent and escalating geopolitical uncertainties. Traders should implement robust risk management strategies and remain vigilant, as price swings may become more pronounced in this elevated volatility environment.
Additionally, President Trump’s recent tariff announcements are expected to further amplify market turbulence, potentially triggering sharp price fluctuations and whipsaws.
M15 Chart:
Skeptic | BNB Surge: Rocket Triggers for Spot & FuturesHey everyone, it’s Skeptic! 😎 Is BNB ready to rocket? I’m diving into a pro-level breakdown of Binance Coin (BNB), a top 5 crypto with a $92.9B market cap, now trending on CoinMarketCap with surging momentum. This analysis unpacks recent upgrades, ecosystem strength, and technical triggers for spot and futures trading, grounded in cycle-based strategies. Trade with no FOMO, no hype, just reason.
Recent Performance & Key Events
Binance Coin ( BNB ), trading at $ 660 with a $92.9 billion market cap, ranks among the top 5 cryptocurrencies globally. The Maxwell hard fork in recent weeks slashed block times to 0.75 seconds, boosting network speed and efficiency, adding $8 billion to the Binance Chain’s market cap. BNB powers the Binance ecosystem, supporting staking, NFTs, and DeFi projects. Despite regulatory scrutiny, ongoing platform expansion and token burn mechanisms sustain BNB’s utility and investor interest. Let’s dive into the technical setup for actionable trades. 📊
Technical Analysis: Cycle-Based Breakdown
The Weekly timeframe is range-bound, so lower timeframes drive price action. Let’s break it down:
Daily Timeframe
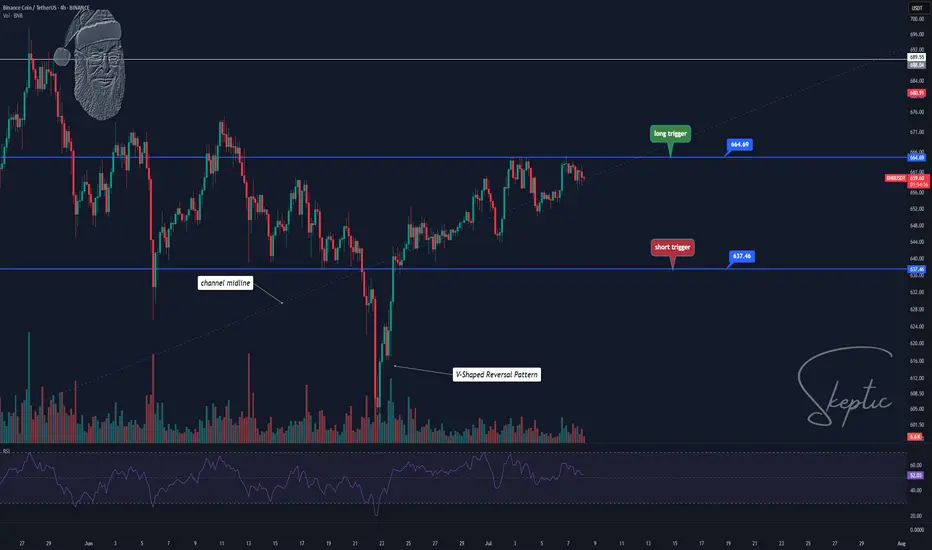
On the Daily, we had a primary uptrend within an upward channel, which broke downward. I cloned the channel and placed it below, and price has reacted well to the midline, still holding there. A midline break could drive price to the channel floor at $536.47. However, a V-pattern stands out as one of the strongest patterns. Why? It shows sellers broke support and consolidated below, but buyers overwhelmed them, pushing price back above support instantly. This signals immense buying pressure, liquidating shorts despite heavy selling—big respect to buyers! lol
💬 For spot trading , wait for BTC.D to turn bearish, as rising BTC.D means liquidity flows to Bitcoin, making altcoin buys less attractive. BNB/BTC turning uptrend is another confirmation—currently, BNB/BTC is bearish, so focus on Bitcoin for now. Check pair/BTC ratios to spot coins outperforming Bitcoin.
Key Insight: Volume and BTC.D/BNB/BTC confirmation are critical for spot buys to avoid low-liquidity traps.
4-Hour Timeframe (Futures Triggers)
On the 4-hour, for longs:
Trigger: Break of resistance at $ 664.69 , confirming the V-pattern. Validate with a volume surge on breakout and RSI entering overbought.
Short Trigger: If support at $ 637.46 breaks again, go short, as buyers may lack strength after exhausting their effort in the prior defense. Volume confirmation is essential.
Pro Tip: ALWAYS use volume to confirm positions. Without a volume spike, fakeout risk is high. Stick to 1%–2% risk per trade to protect capital.
Final Vibe Check
This BNB breakdown delivers precise triggers: long at $664.69 (futures with V-pattern confirmation), short at $637.46 (futures). With a range-bound Weekly and Daily V-pattern, volume and BTC.D/BNB/BTC signals are your edge. BNB’s Maxwell fork and ecosystem strength fuel its potential, but regulatory risks demand tight stops. Want more cycle setups or another pair? Drop it in the comments! If this analysis sharpened your game, hit that boost—it fuels my mission! 😊 Stay disciplined, fam! ✌️
💬 Let’s Talk!
Which BNB trigger are you eyeing? Share your thoughts in the comments, and let’s crush it together!

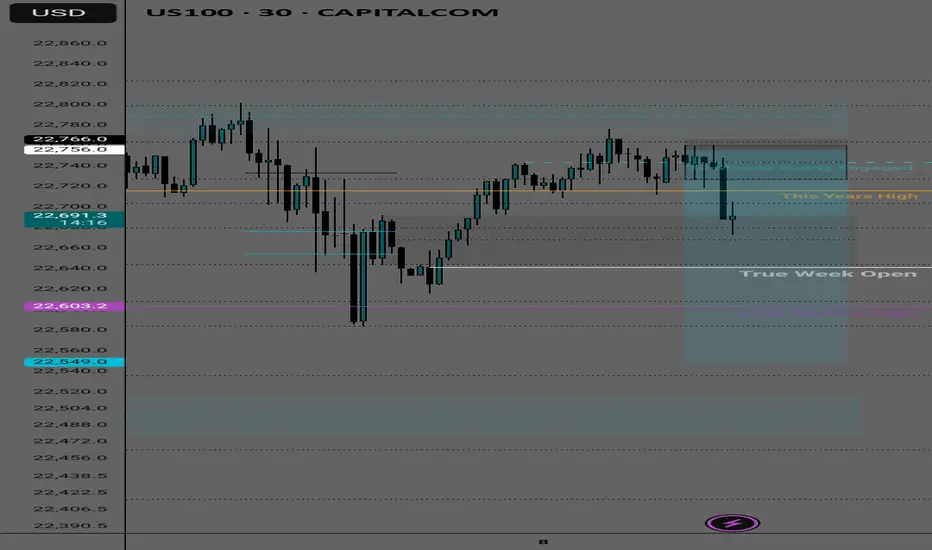
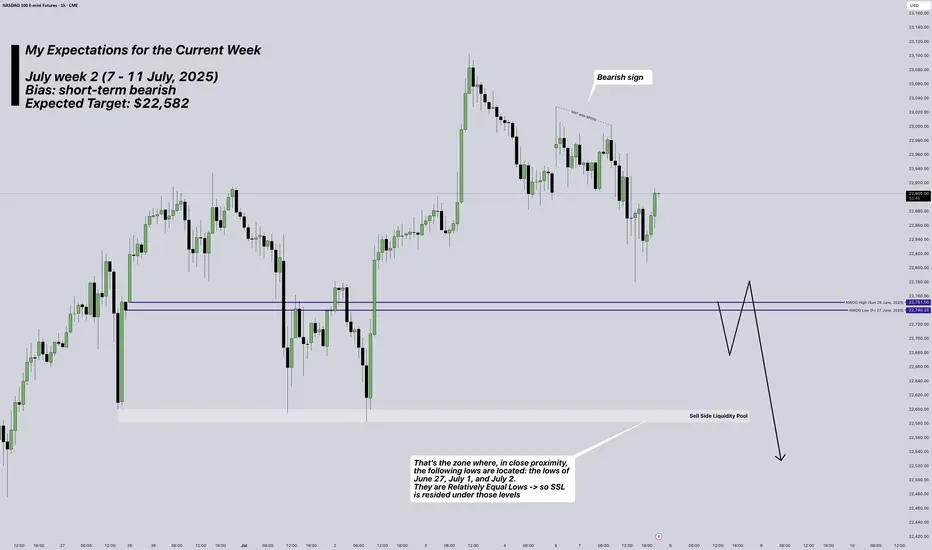
NASDAQ Futures: My Plan for current Week (7-11 July, 2025)Week: July 7–11, 2025
Instrument: NASDAQ Futures (NQ)
Trend: Overall, the market remains bullish, but for this week I anticipate a retracement targeting the $22,582 level.
Bias for the week: Bearish
Overview:
This week, I’m watching NQ for a potential move toward the $22,582 level. This expectation is based on how Thursday (July 3, 2025) played out—specifically the buy-side liquidity that was taken, and the clean sell-side liquidity pool left near $22,582.
I also find it notable how the NWOG (New Week Opening Gap) was opened and how price moved below it, which reinforces the short bias.
I would consider opening a short position once I see a confirmed 4H candle close below $22,760, otherwise no trades will be taken.
* Trade execution details will be published separately if my bias confirms.
* for more information -> review my notes on the chart
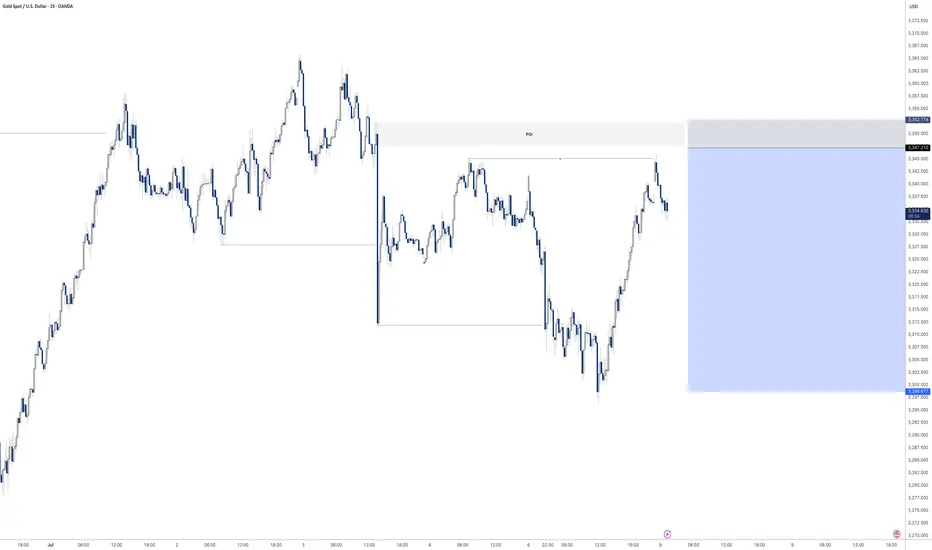
Gold sell off before continuation higher? Pending order set on this one before bed
Will see what develops overnight
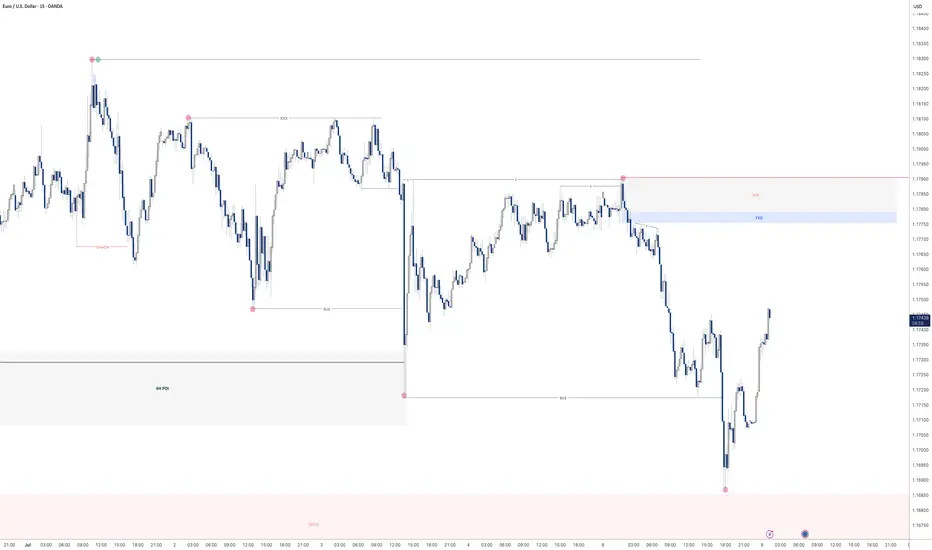
EURUSD - Potential sell at LDN or NY openLooking for sell from the POI highlighted
We have raided buy side liquidity so now its time to look at the origin of the move and see if we can further capitalise on a similar set up I took yesterday in order to bank a lovely 8.5% profit on this single trade.
Will post the trade below
July 2025 - Will Tether (USDT) decouple from its $1 peg in 2025?Firstly, it is not the intention of this post to spread FUD (Fear, uncertainty, & doubt), but rather a word of caution to all who use USDT. You should read this idea in conjunction with the recently published “ Is Alt season dead? - June 2025 ” idea, there’s a remarkable alignment between them, should you understand what the 6 week chart above is telling you.
The argument presented here is for a failed redemption request on the Tether network, ultimately resulting in the collapse of the Tether stable coin. The event is expected to occur during the month of September, which will be the expected end of the Bitcoin bull market.
Throughout the years freshly printed USDT has been the life blood of alt tokens, that’s a fact. As supply and dominance increase, so does the size of the alt token market (including Ethereum). Those two conditions are an undeniable fact, look left. Fresh USDT is the alt token traders drug, they're addicted. Jump down to Reason 3 for a detailed comparison.
We’re now heading into a period of time where the opposite appears to be unfolding, and no one is talking about it. No one. But more on that later. This is about Tether itself.
Whatever is about to happen to Tether, it will be a first in its near 11 year history. You only need look left to see, this time is very different from previous market cycles. In the near term (weeks ahead) a collapse in Tether dominance is likely to print. Ultimately this will be at first a good thing for the alt token market, at least that’s how it will be perceived, but afterwards..
If you’ve studied the $1 peg failure of Terra Luna’s stable coin, then you’re likely looking at USDT.d chart and wondering where you’ve seen this before. The Luna crypto network collapsed in what's considered the largest crypto crash ever, with an estimated $60 billion wipeout, life savings were lost, dreams crushed. Many lost a great deal of money they thought was safe. Could the same happen with Tether? And what could cause such an event?
Let’s explore this…
What is the Tether stable coin?
The core idea behind USDT is that each token is backed 1-to-1 by real U.S. dollar reserves. This is what's supposed to give a "stablecoin" its value, it should always be tradable with $1 USD. Unlike a bank, Tether does not create money, it digitises it, which is sort of how you use your debit card to make purchases every day. Real cash never touches your fingers, the only difference is the money in your bank is insured, protected by the government in the event of default, whereas your USDT.. it is a private company, if it fails, it’s gone.
Naturally Tether does not maintain a real cash equivalent for each USDT token in circulation, that would be impractical for a profit making business. Ironically, Tether is more liquid than most high street banks. And yet, there’s a growing risk ignored by the market. In fact, during research of this idea, it is surprising how far under the RADAR this risk has gone unnoticed. It is the same risk that allowed US Banks, Silicon Valley Bank and Signature Bank to fail (chart at bottom of page, does it look familiar to above?).
The collapse - but how?
Reason 1 - BONDs, Precious metals, & Bitcoin market exposure…
Tether has become one of the largest holders of US Treasury bills globally. Reports indicate that exposure to US Treasuries (direct and indirect, via money market funds and reverse repo agreements) has approached or exceeded $120 billion as of Q1 2025. As a matter of fact it is said so on their own website.
In the last audit (March 2025) where it was recorded, a U.S. Treasury Bill exposure of $98.5b “with a residual average maturity of less than 90 days”, to use their own words.
Source :
In their own words “The breakdown of the reserve backing the fiat denominated Tether tokens in circulation is.. . “, the highlights:
A precious metal exposure @ $6.6 billion and spot Bitcoin reserves @ $7.6 billion and somehow secured loans of $8.8 billion (plot twist, Micro strategy! Or Strategy as they’ve now chosen to name themselves) and around $64 million in cash.
The total assets as reported tied up in various financial instruments: $149,274,515,988, with approximately 66% tied up in the Bond market (and let’s ignore both Bitcoin and Gold are at historic overbought levels, $13.2billion is at considerable exposure to volatility.)
Circulating tokens: 158.6 billion
$149,274,515,988 (Reserves) / 158,600,000,000 (Tokens) ≈ 0.9412 per token
At this moment in time should the market exercise a full redemption request (very unlikely), 94 cents is the best they could offer, which is I stress, better than most high street banks. However the argument is not the backing, it is the access to it. Just as with Silicon and Signature banks, Tether appears to have ample liquid assets, but can it access them when it needs to?
If Tether needs to increase its cash position to support the network with real cash during a sudden demand spike, treasuries must first be sold. You may have noticed, but right now buyers for US treasuries are not exactly lining up outside the door to offer America cash. You don’t want to be a large holder of US treasuries during a period of rapid falling demand.
90 day US Bond market is on the verge of collapse. Imagine one of the largest holders of 90 day treasuries at this juncture. Sell into strength, not collapse.
Reason 2 - Inability to meet redemption demands
Tether's peg relies entirely on the market's belief that 1 USDT can always be redeemed for $1 USD, regardless if the liquidity is there. This uncertainly ultimately caused Terra Luna’s stable coin to de-couple. Trust took years to build hours to lose.
If this belief falters, or if the mechanism for redemption breaks even if only for hours, the peg collapses. Bond market exposure introduces several pathways to this breakdown:
Liquidity Mismatch, the "Run on the Bank”:
The Problem: Bonds, even highly rated ones, are not instant cash. Selling large quantities of bonds takes time, and doing so quickly can depress their price, especially if the market for those specific bonds is thin or stressed.
Imagine a widespread loss of confidence in Tether (perhaps due to rumours, a major regulatory action, or a general crypto market crash). Millions or even billions of dollars worth of USDT holders rush to redeem their tokens for actual USD.
The de-peg: If Tether's $120 billion (or a significant portion) is tied up in bonds that cannot be sold quickly enough at their face value, Tether would be unable to meet all redemption requests promptly. This would lead to a backlog of redemptions.
As the market sees that Tether isn't honoring redemptions on demand, panic sets in. USDT holders would then try to sell their USDT on secondary markets (exchanges) for less than $1, accepting a discount just to get out. This is the decoupling.
Reason 3 - An important alignment with " Is Alt season dead? - June 2025 ” idea
Historically, the relationship between USDT dominance and alt token performance is often seen as inverse. Here's why:
USDT as a "Safe Haven" when the crypto market is in a risk off phase, or experiencing uncertainty, investors tend to move their capital into stable coins like USDT. This increases USDT dominance, as a larger percentage of the total crypto market cap is held in USDT. During such time alt coins often struggle as capital flows out of them.
Capital rotation into alt coins (aka alt season): Conversely, a decrease in USDT dominance is often interpreted as a bullish signal for alt coins. It suggests that capital is moving out of stable coins and into riskier assets, including Bitcoin and then alt coins, in search of higher returns. This period is often referred to as "alt season" where alt coins significantly outperform Bitcoin. (This worked well prior to the Bitcoin ETF as liquidity entered spot Bitcoin, which would then eventually turn to the alt token market. However in this cycle the liquidity is trapped inside ETFs (Exchange Traded Funds). But this dichotomy will not arrest the enthusiasm of rose tinted glasses wearing influencers.)
Is it that really true, a general fall in dominance is good for the alt token market?
An overlay of TOTAL2 (market capitalisation of all tokens except Bitcoin) on the chart of Tether Dominance since 2016 (below) reveals a contradiction to this popular belief that declining dominance benefits alt tokens.
The chart clearly shows that strong Tether dominance is necessary for strong alt token market performance, especially after each Halving (vertical yellow lines). Influencers throughout the space are now calling for amazing performance well into 2026, how can this be compatible with a clear trend reversal in USDT dominance?
6 week TOTAL2 compared with USDT dominance since 2016
Why is this change in Dominance a de-pegging risk?
Recall in reason 1 the Bond risk, the time it might take Tether to liquidate treasuries to service redemption requests (remember the business is operating with a small cash position as percentage of their market capital). Keep this number in mind. Now flip over to the “ Alt season dead? - June 2025 ” idea, notice the bear flag forecast? It calls for a correction of around $200 billion, returning the market to 2017 levels. A 50% correction across OTHERS, if into USDT, would demand the complete liquidation of Tethers Bond position. But why? In a word, contagion. Especially amongst DeFi protocols.
It is worth remembering the OTHERS market total ticker is limited to the top 125 tokens excluding Bitcoin, Ethereum, Tether, XRP, and BNB. The market will more than likely try to escape into USDT, but what if that is not possible? The supply of Tether tokens is finite. What if the supply is increased to service the sudden demand without the backing?
A loss of confidence. If USDT dominance collapses and alt coins fail, it could suggest a loss of confidence in Tether or stable coins in general.
A de-pegging event: A major de-pegging of USDT from the US dollar (i.e. USDT trading significantly below $1) would be a primary cause. This would erode trust in USDT as reliable store of value and a medium for trading, leading to a mass exodus.
Liquidity criss: USDT is the most widely used stablecoin for trading alt coins. If its dominance collapses due to a lack of trust, it would severely impact liquidity across the alt coin market.
Contagion effect: A collapse in USDT could trigger a wider contagion throughout the crypto system:
DeFi instability. Many DeFi protocols rely on stable coins as collateral, especially USDT. A USDT collapse would lead to liquidation events of a size never seen before in the alt token space.
Bitcoin as the “Ultimate safe haven”. I keep asking myself, where is the liquidity for Bitcoin’s final push to the $145-150k market top coming from? While Bitcoin is volatile as old wallets liquidate their positions at all time highs, in extreme crisis, Bitcoin is often seen as the last resort in crypto due to decentralised nature and first mover advantage.
Reason 4 - The chart
The chart informs us something no user of USDT should ignore. For the first time in its almost 11 year history, dominance has printed:
1. A post Halving dominance collapse. Look left.
2. Broken market structure.
3. A Death Cross (available across multiple time frames)
4. Failed legacy support since 2018.
5. A collection of bearish engulfing and Gravestone DOJI candles.
If an increasing USDT dominance has historically been positive for alt tokens, then a macro reversal implies something very bearish for the alt token market going forward.
Notice the marking for each 4 year cycle alt token end point? Make a note of that!
Ww
Signature Bank before collapse

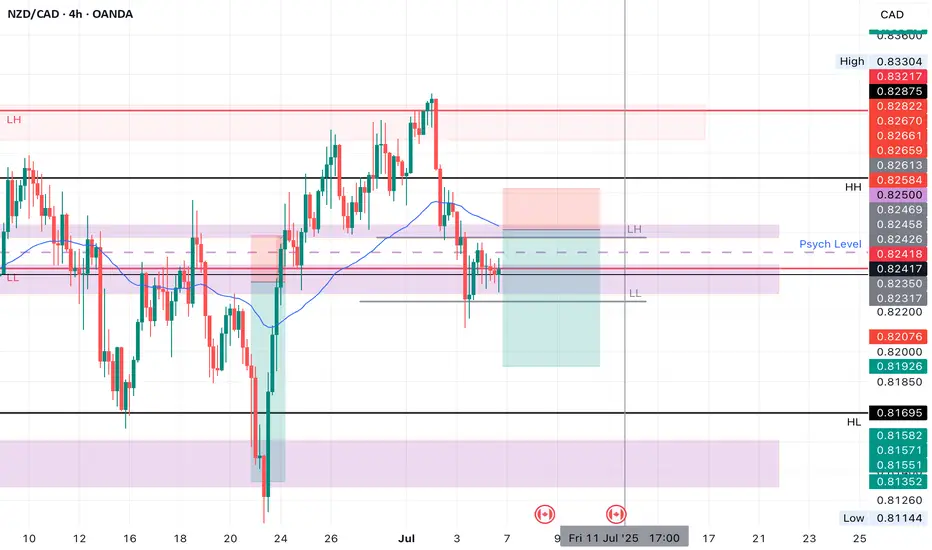
NZDCAD SHORT Market structure bearish on HTFs DH
Entry at both Daily and Weekly AOi
Weekly Rejection at AOi
Daily Rejection at AOi
Previous Structure point Daily
Around Psychological Level 0.82500
H4 EMA retest
H4 Candlestick rejection
Rejection from Previous structure
Levels 3.29
Entry 100%
REMEMBER : Trading is a Game Of Probability
: Manage Your Risk
: Be Patient
: Every Moment Is Unique
: Rinse, Wash, Repeat!
: Christ is King.
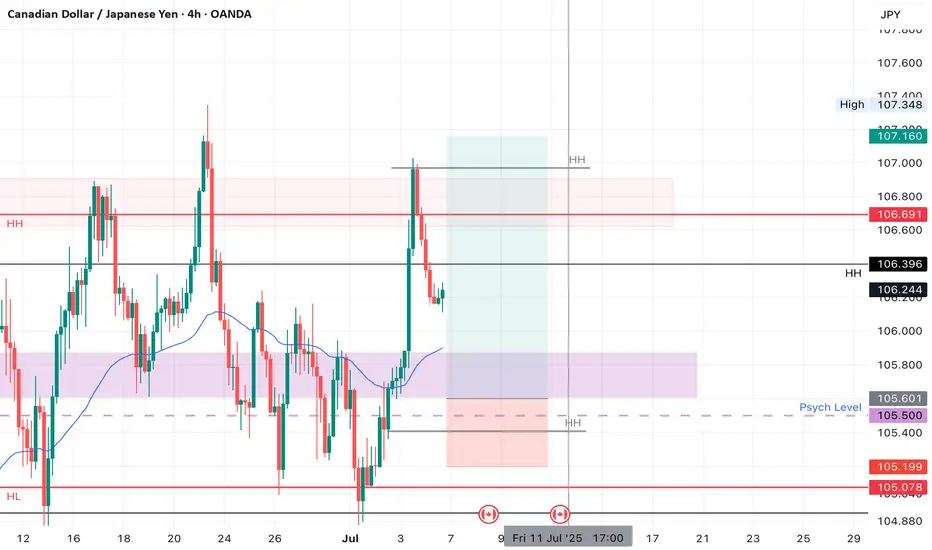
CADJPY LONGMarket structure bullish on HTFs 3
Entry at both Daily and Weekly AOI
Weekly rejection at AOi
Daily Rejection at AOi
Previous Structure point Daily
Daily EMA retest
Around Psychological Level 105.500
H4 Candlestick rejection
Rejection from Previous structure
Levels 3.88
Entry 110%
REMEMBER : Trading is a Game Of Probability
: Manage Your Risk
: Be Patient
: Every Moment Is Unique
: Rinse, Wash, Repeat!
: Christ is King.
USDCHF - Potential downside incominglooking at UCHF we have just swept a level of liquidity.
We have had a Change of Character on the 15min to the downside and left a nice inducement / liquidity level alongside a nice FVG that has left a nice bearish orderblock
Once the spreads calm down I will set my pending order on this level and hope to be tagged into this position.
Due to the time it will be a reduced risk entry as I won't be able to manage the trade during the night.

Weekly Forex Outlook Sun.July.6.2025 - Fri.July.11.2025Like and Comments would be appreciated :D Not Financial Advice, Just my outlook/opinion

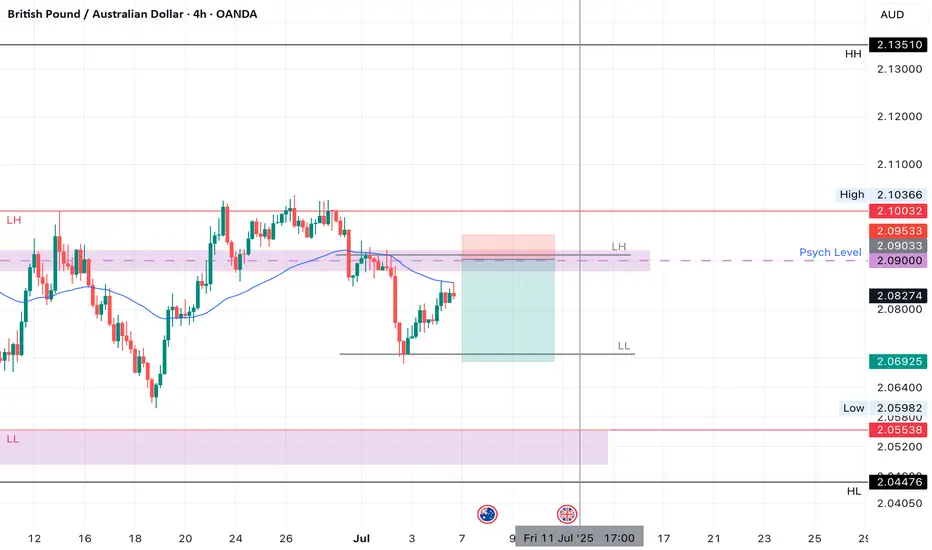
GBPAUD SHORTMarket structure bearish on HTFs DH
Entry at both Daily and Weekly Rejection
Weekly Rejection at AOi
Daily Rejection At AOi
Previous Structure point Daily
Around Psychological Level 2.09000
H4 Candlestick rejection
Rejection from Previous structure
Levels 4.22
Entry 95%
REMEMBER : Trading is a Game Of Probability
: Manage Your Risk
: Be Patient
: Every Moment Is Unique
: Rinse, Wash, Repeat!
: Christ is King.
Stock Index: ES, NQ, YM Weekly Update📈 S&P 500, Nasdaq & Dow Jones – All-Time Highs, But Caution Creeping In
🟩 S&P 500 | Nasdaq | Dow Jones
All three indices hit new all-time highs to close out June.
Powered by:
🔋 AI optimism
💰 Solid earnings
🕊️ Dovish Fed tone and falling bond yields
SPX continued its breakout run
Nasdaq surged as big tech led the charge
Dow followed with slower but steady strength
⚠️ But Watch the Signs Beneath the Surface
Consumer confidence dropped sharply
Home sales weakened
Fed speakers remained non-committal on cuts
All three indices now look extended — particularly Nasdaq
Momentum remains bullish, but these rallies are now resting on softening macro, yield compression, and hope that the Fed stays on hold.
🧠 Key Takeaway
Price action is euphoric — but fundamentals are flashing mixed signals.
When tech leads the market at extremes, volatility risk is elevated.

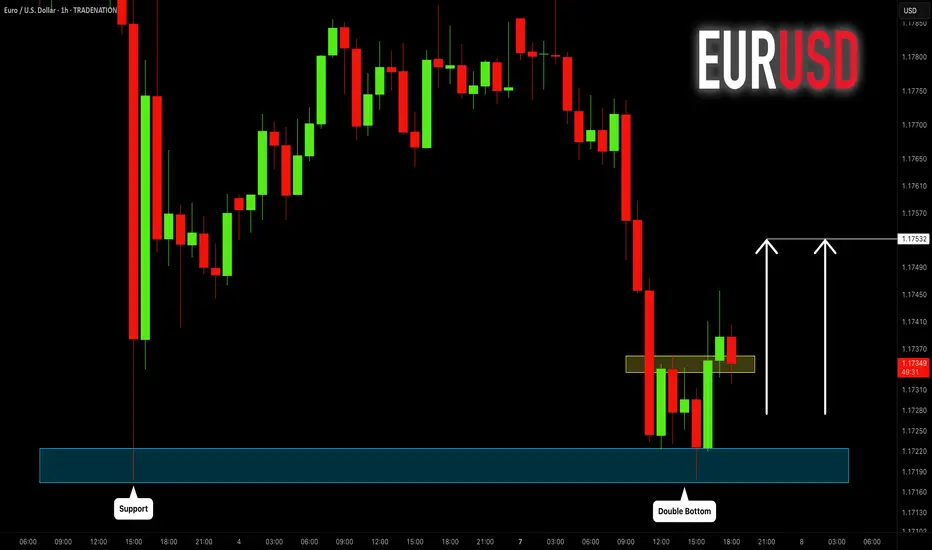
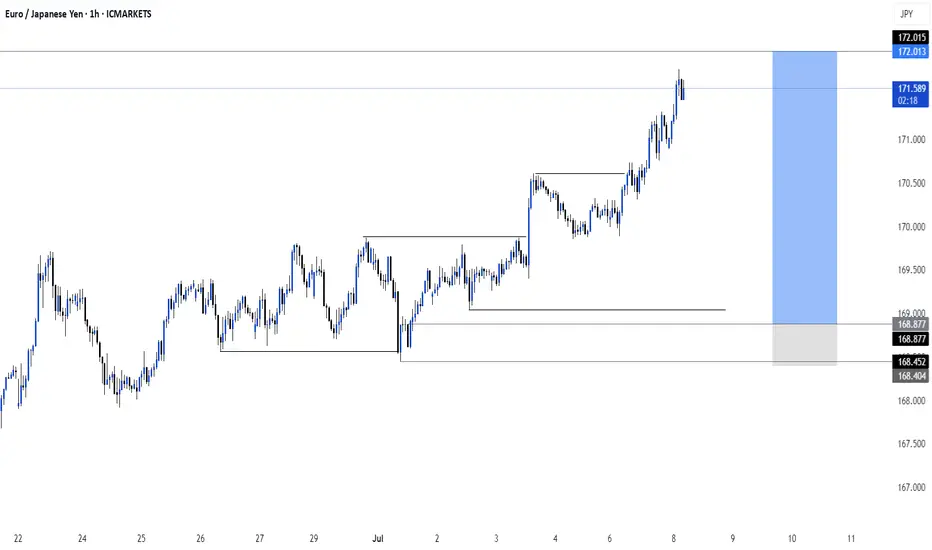
EURUSD: Another Pullback Trade for Today 🇪🇺🇺🇸
EURUSD formed a double bottom pattern on a key daily horizontal support.
Its neckline violation signifies a local strength of the buyers.
I think that the pair may move up and reach 1.1753 level.
❤️Please, support my work with like, thank you!❤️
I am part of Trade Nation's Influencer program and receive a monthly fee for using their TradingView charts in my analysis.