Multiple Time Frame Analysis
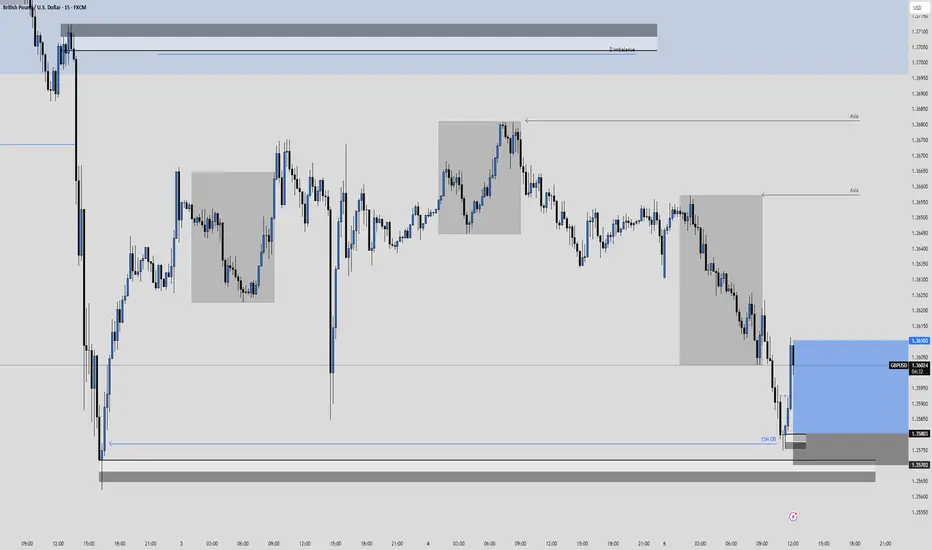
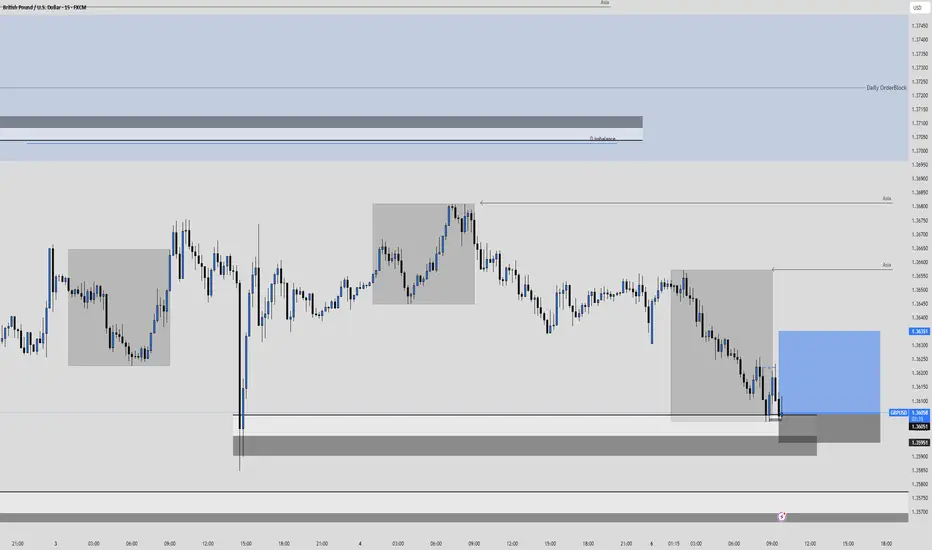
GBPUSD Long Re-entry, 07 JulyAsia Fill & Volume-Based Setup
This is a momentum-driven long based on Asia Fill and a strong bullish shift on LTF, with clear DXY correlation. HTF doesn't offer major confluence, but intraday price action supports the idea.
📍 Entry: Waiting for a retest of the 5m OB left behind after a strong bullish move
📈 Confluence: 1m BOS + 15m Extreme OB + high buyer volume
🔁 Risk: Price may not return to 5m OB – if missed, it's a no-trade
🎯 Target: Asia high (but first 1:3 RR), quick BE if we catch the move
Clean setup with structure and volume in our favor – execution depends on retest.
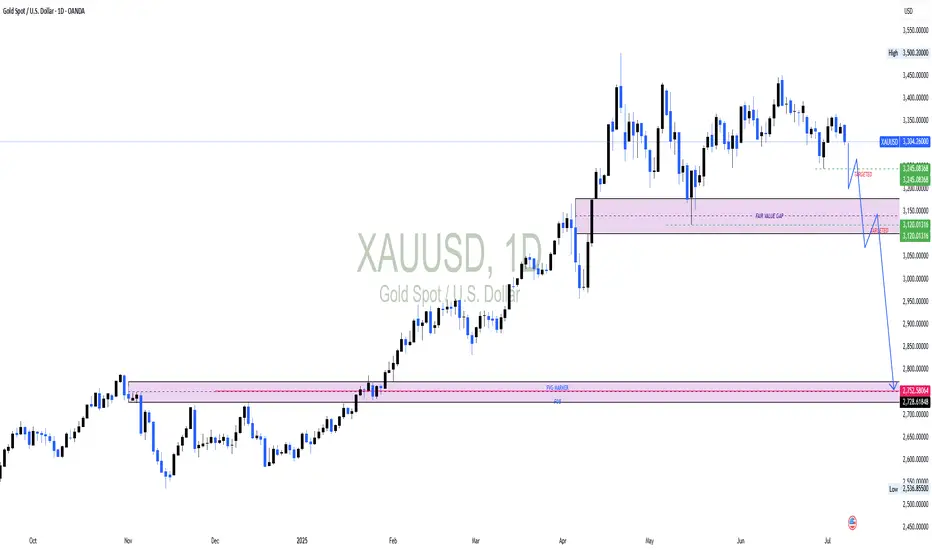
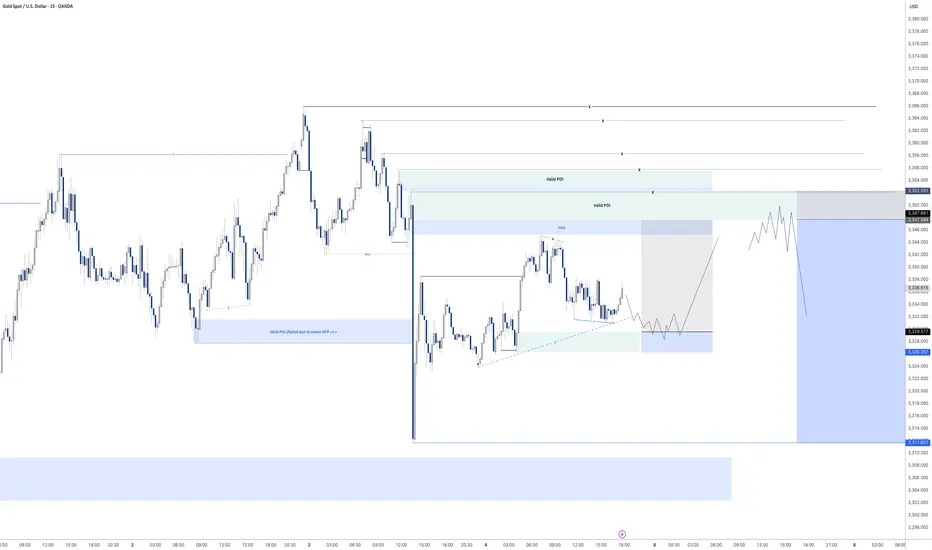
Could Gold slide below 3000?Could Gold slide below 3000?
On the monthly charts, price action shows an imbalance when Gold surged to 3500. Equilibrium must be restored and price action suggests, Gold has to correct by mitigating demand at 2700 price levels. On the weekly and daily charts, there are signs of price weakening suggesting a reversal is not so far. On the daily chart, Gold has mitigated a short term FVG and formed an intermediate low. Once this low is broken, it will confirm our reversal of Gold targeting the monthly FVG at 2760
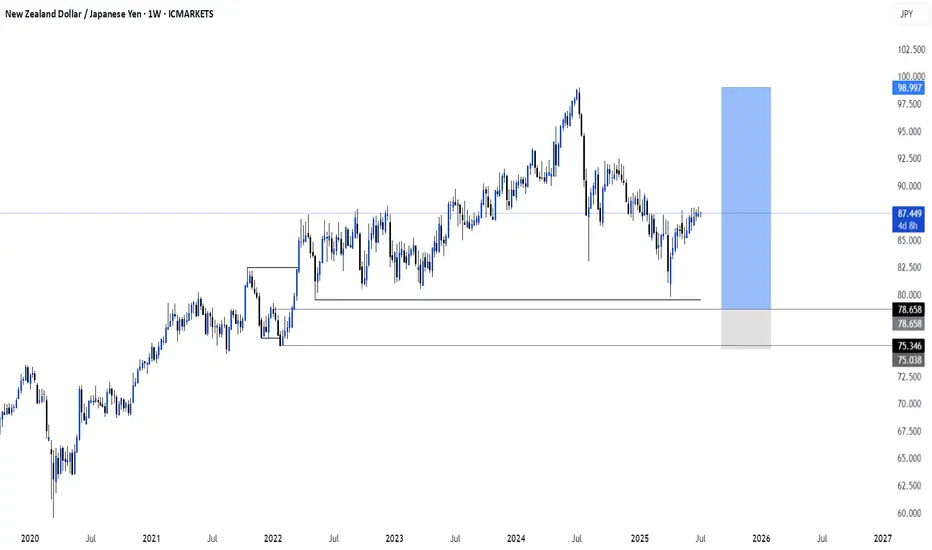
AUDJPY OUTLOOKOn the monthly charts, the AUDJPY has shifted in market structure indicating the long term outlook is bearish. In the interim (weekly), price action is pushing higher to mitigate price inefficiency and fair value gaps. After mitigation, we will look for sell opportunities targeting liquidity below the relative equal lows.

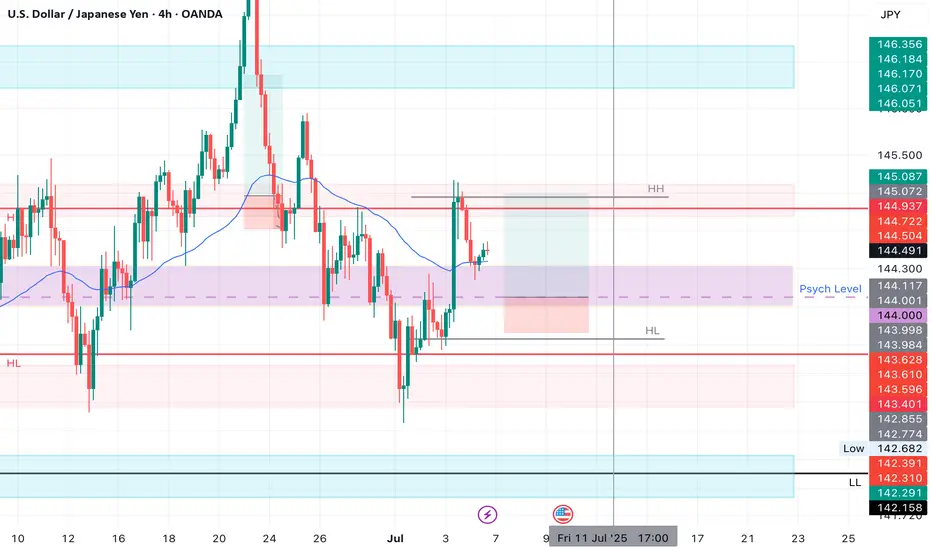
USDJPY LONGMarket structure bullish on HTFs DH
Entry at both Weekly and Daily AOi
Weekly Rejection at AOi
Daily Rejection At AOi
Previous Structure point Daily
Around Psychological Level 144.000
H4 Candlestick rejection
Rejection from Previous structure
Levels 2.91
Entry 95%
REMEMBER : Trading is a Game Of Probability
: Manage Your Risk
: Be Patient
: Every Moment Is Unique
: Rinse, Wash, Repeat!
: Christ is King.
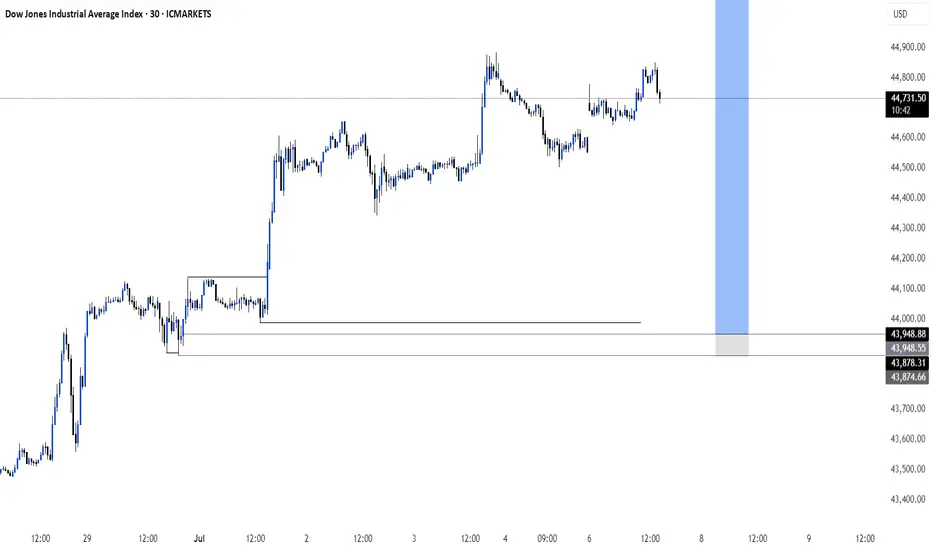
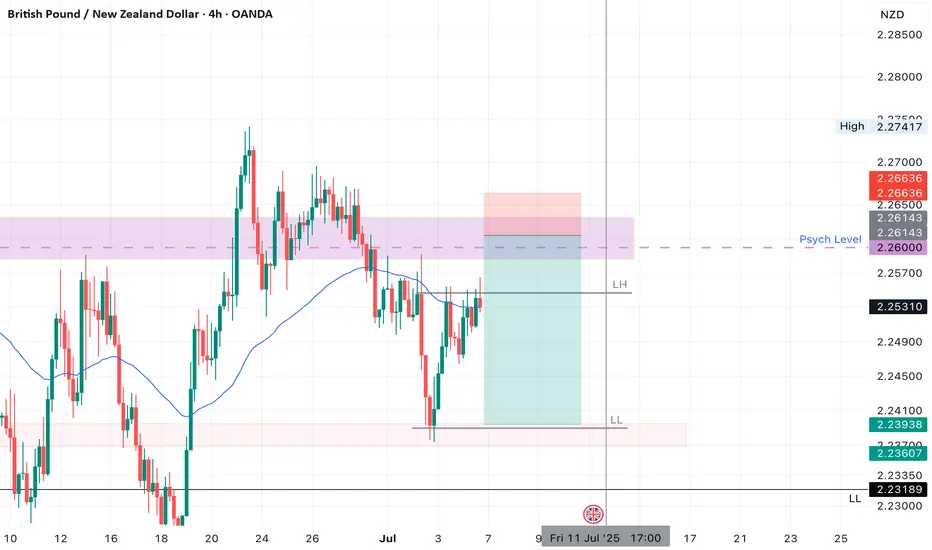
GBPNZD SHORT Market structure bearish at AOi DW
Entry at Weekly and Daily AOi
Weekly Rejection at AOi
Previous Structure point Weekly
Daily Rejection at AOi
Previous Daily Structure Point at AOi
Around Psychological Level 2.26000
H4 Candlestick rejection
Levels 5.14
Entry 95%
REMEMBER : Trading is a Game Of Probability
: Manage Your Risk
: Be Patient
: Every Moment Is Unique
: Rinse, Wash, Repeat!
: Christ is King.
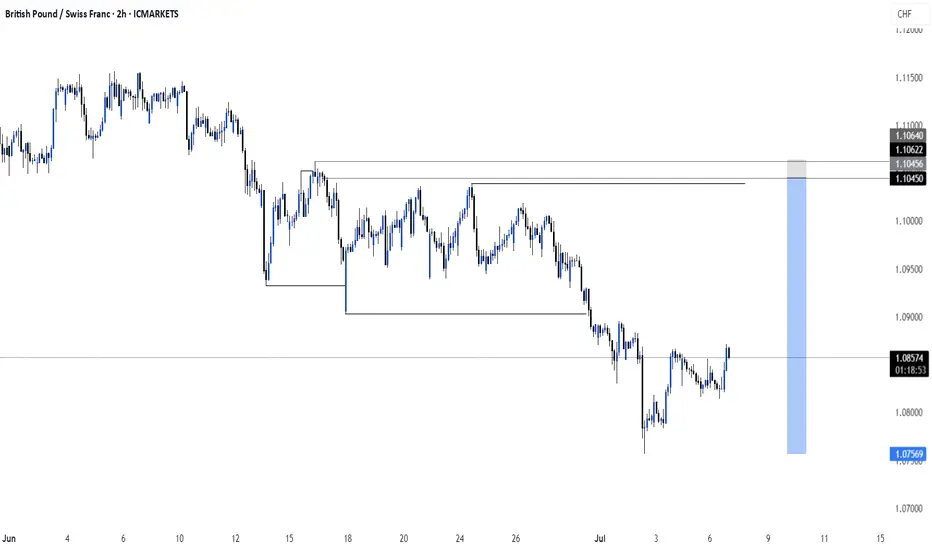
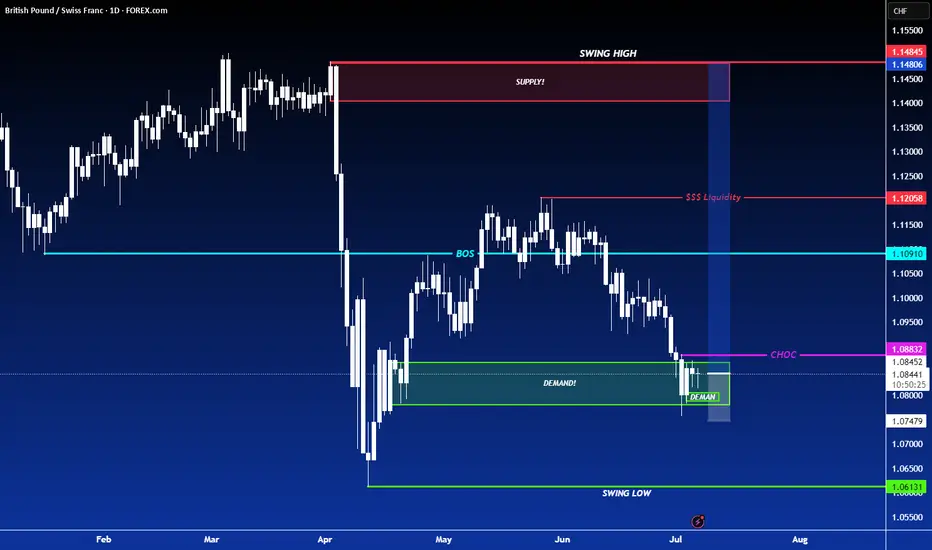
LONG ON GBP/CHFGBP/CHF has tapped into a major demand zone and has lots of buy side liquidity to the upside near the supply zone to collect.
I will be buying GBP/CHF to the supply zone looking to catch 400-600 pips.
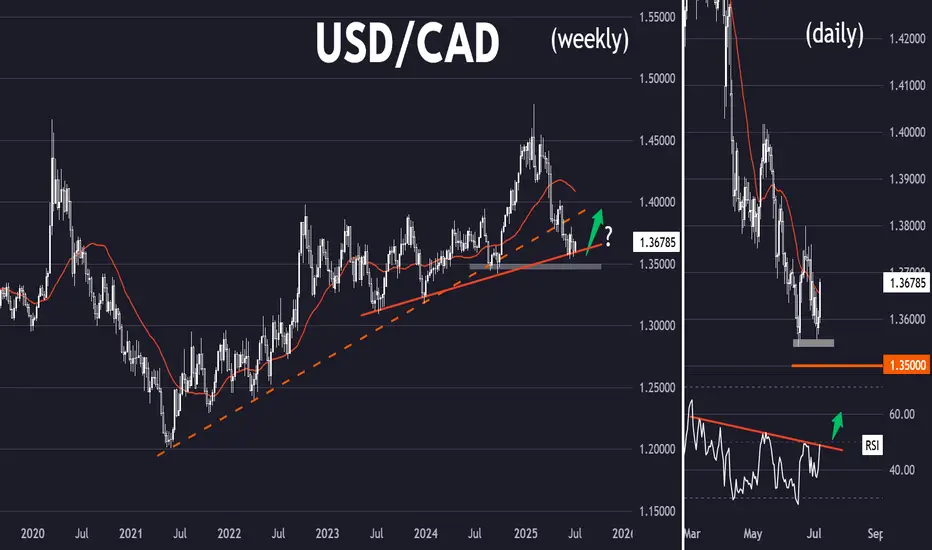
Bullish Maple Syrup (USD/CAD)Setup
USD/CAD has broken below its long term uptrend line and is making lower lows while below the 30 week SMA, indicating a downtrend.
Signal
The daily chart shows a steep downtrend with RSI having twice been oversold at the May and June lows. However, on the most recent re-test of the lows RSI has held up. A double bottom pattern confirmed by a break back over 50 RSI could signal a more sustained bounce.
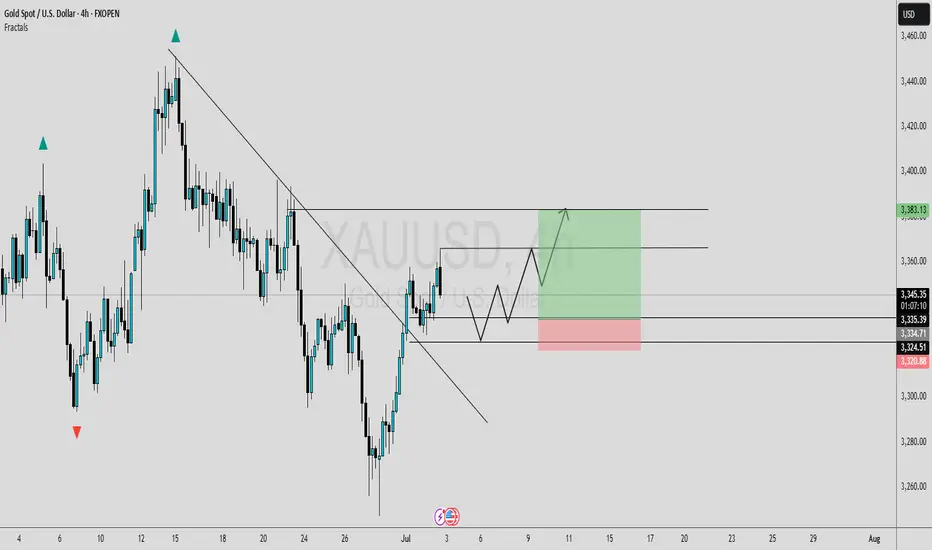
TRENDLINE BREAKOUT [LONG]In this analysis we're focusing on 4H timeframe. As we know that price move impulse toward upside and break trendline, now I'm waiting for retracement. Once price reach my zone and give any type of bullish confirmation than we'll execute our trade. This is a higher time frame analysis and key levels. Let's analyze more deeply into smaller time frame and potential outcomes.
Always use stoploss for your trade.
Always use proper money management and proper risk to reward ratio.
#XAUUSD 4H Technical Analysis Expected Move.
GBPUSD Long, 07 JulyAsia Fill Setup
This is a pure Asia Fill trade, backed by recent bullish LTF structure and a clean reaction from a 15m decisional OB. Although HTF isn’t perfectly aligned for longs, the momentum and intraday structure make this setup valid.
📍 Entry: 1m BOS from 15m OB, refined entry from 1m OB
📈 Confluence: Trend, structure, and Asia high as a clear target
🔁 Risk: SL doesn’t fully cover the OB, but BOS + clean reaction justifies the entry
🎯 Target: Asia High (1:3 RR), with BE secured quickly if price moves favorably
Not a perfect setup HTF-wise, but strong intraday alignment makes it worth the shot.
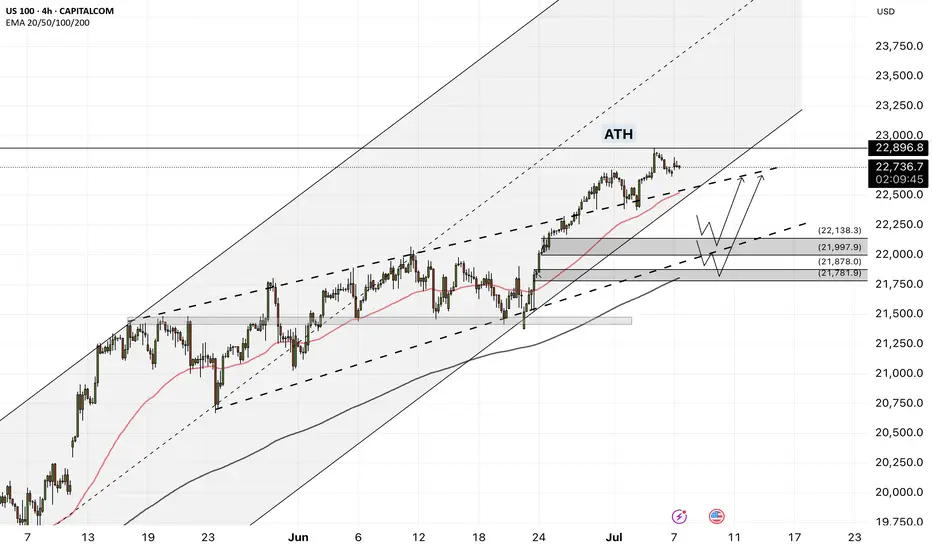
NAS100 - Stock market is waiting for tariffs!The index is above the EMA200 and EMA50 on the four-hour timeframe and is trading in its ascending channel. Maintaining the ascending channel will lead to the continuation of the Nasdaq's upward path to higher targets, but if it does not rise and corrects towards the demand limits, you can buy the Nasdaq index with appropriate reward and risk.
Three months ago, Donald Trump postponed the imposition of severe retaliatory tariffs, granting America’s major trading partners more time to reach new agreements that Washington views as “fairer.” Now, as the White House’s July 9 deadline approaches, only two official trade deals have been finalized—one with the United Kingdom and another with Vietnam. As for China, merely a fragile temporary truce has been reached, which has so far prevented any additional tariffs from being enforced.
Although reports suggest promising progress in negotiations with India, Japan, and South Korea, no final agreements have been secured with these countries yet. Interestingly, talks with the European Union—which had previously stalled—have suddenly taken a positive turn, and prospects for a deal with Canada in the coming days have also improved.
However, given the limited time left, it seems unlikely that trade agreements with all of America’s 18 key partners will be reached before the deadline. This situation has raised a critical question for the markets: Will Trump set a new deadline for the remaining countries, or will the suspended tariffs be reinstated?
The prevailing view is that the U.S. president will once again resort to threats before granting any extensions—this time not merely by reviving the “Liberation Day” tariffs, but also by promising even heavier tariffs to extract the last concessions from the remaining trade partners.
U.S. Treasury Secretary Scott Bassett stated that if no agreements are reached by August 1, tariffs will revert to the levels announced in April. He also emphasized that Washington’s core strategy in these trade talks is to apply maximum pressure. According to Bassett, letters will be sent to various countries, outlining the August 1 deadline for reaching deals. This news, which broke during the market’s closing hours, sparked a wave of risk appetite in the financial markets.
In a week when the U.S. economic calendar is notably devoid of major data releases, investors are focusing their attention on the minutes from the Federal Reserve’s June FOMC meeting—a document that could offer fresh insights into the trajectory of interest rates for the second half of the year.
June’s strong employment report, which exceeded market expectations, has effectively dashed hopes for an interest rate cut this month. Now, if the positive economic momentum persists, the likelihood of a rate cut in the September meeting may also gradually be priced out by the markets.
According to data from Challenger, Gray & Christmas, U.S. employers announced 47,999 job cuts in June, marking a sharp decline from 93,816 in the previous month. Compared to June of last year, layoffs have dropped by 2%. However, total job cuts in the second quarter of 2025 reached 247,256—a 39% increase from the same period last year (177,391) and the highest second-quarter layoff figure since 2020.
With no significant economic reports scheduled for the coming days, investors will be closely analyzing Wednesday night’s Fed minutes and the limited remarks from central bank officials—statements where every word has the potential to significantly move the markets.
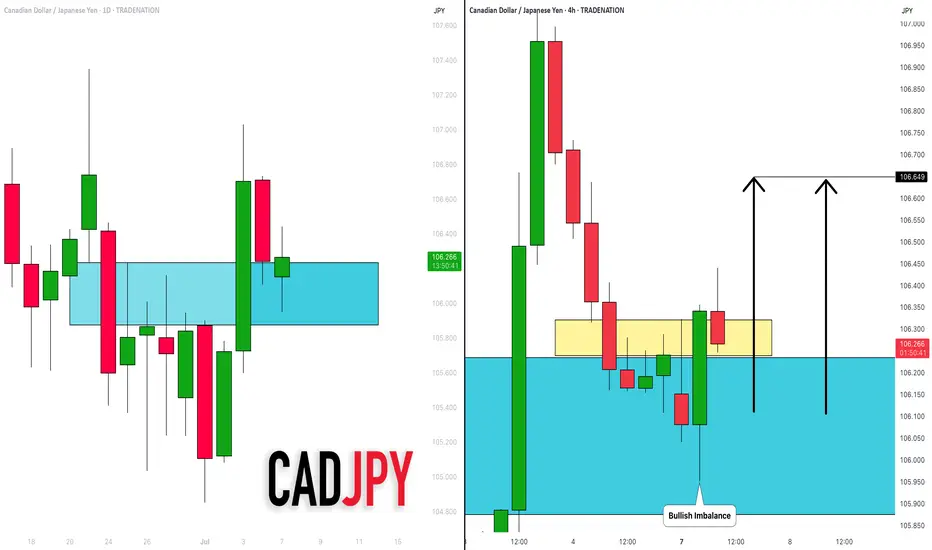
CADJPY: Bullish Move From Support Confirmed?! 🇨🇦🇯🇵
CADJPY may bounce from a key daily horizontal support cluster.
As a confirmation signal, I spotted a bullish imbalance candle
on a 4H time frame after its deep test.
I expect a pullback to 106.65
❤️Please, support my work with like, thank you!❤️
I am part of Trade Nation's Influencer program and receive a monthly fee for using their TradingView charts in my analysis.
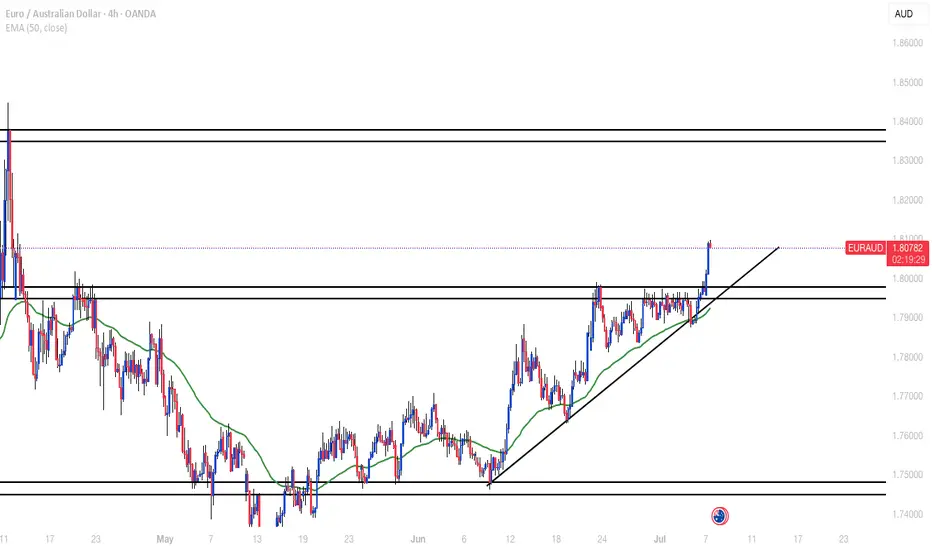
EURAUDH4 resistance broken and also have a support trendline. Waiting for a retest to take buys to the next H4 resistance zone around 1.83500. Watch the fundamentals too.
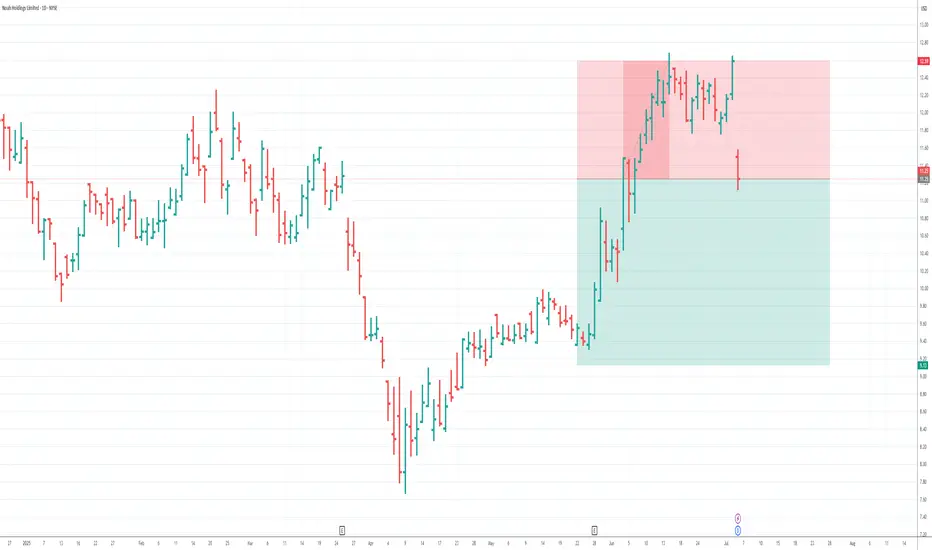
7/3/25 - NOAH: new SELL mechanical trading signal.7/3/25 - NOAH: new SELL signal chosen by a rules based, mechanical trading system.
NOAH - SELL SHORT
Stop Loss @ 12.59
Entry SELL SHORT @ 11.25
Target Profit @ 9.13
Analysis:
Higher timeframe: Prices have stayed below the upper channel line of the ATR (Average True Range) Keltner Channel and reversed.
Higher timeframe: Victor Sperandeo's (Trader Vic) classic 1-2-3/2B SELL pattern...where the current highest top breakout price is less or only slightly peaking higher than the preceding top price.
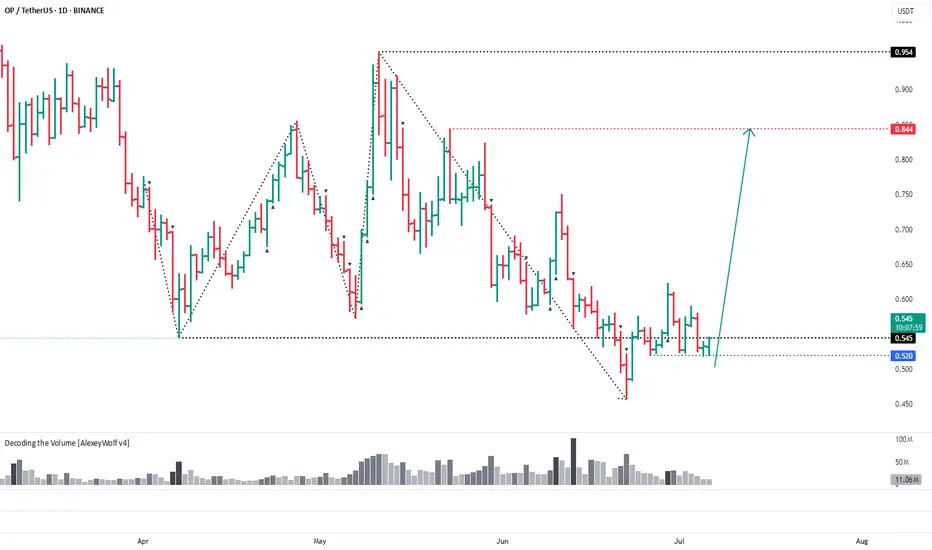
OPUSDT: Buyers try to regain control inside the rangeHi traders and investors!
On the daily timeframe, OPUSDT is trading in a sideways range. The price has repeatedly dipped below the lower boundary at 0.545, but each time, buyers managed to bring it back.
Now, we’re seeing another attempt to return into the consolidation zone — a possible sign of renewed buyer initiative.
If the price secures above 0.545, the path opens toward the next targets at 0.844 and 0.954. However, a short-term dip below 0.52 may occur within this bullish scenario.
Therefore, buying becomes a priority once the price is firmly back above 0.545.
This analysis is based on the Initiative Analysis concept (IA).
Wishing you profitable trades!
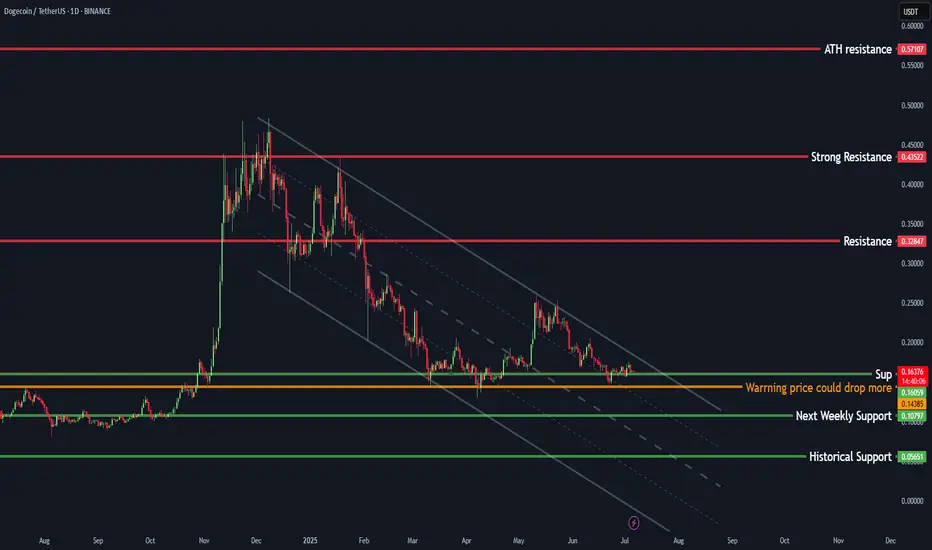
Are you ready for New Miracle ? Doge is one of them#Gold #XAUUSD #PriceAction #Fibonacci #EMA50 #TradingView #Scalping #TrendTrading #LiquidityGrab #AltcoinsSpeakLouder #TradeWithMky
What happens when price dives, grabs liquidity, and kisses the 50 EMA with a bullish shadow candle?
You get what I call a "Miracle Shot" setup.
🔹 Price retraced deeply into a golden zone (between 50–61.8% Fibonacci).
🔹 The candle with a long lower wick shows liquidity grab.
🔹 Immediate bullish rejection right from the EMA50 = clear entry signal.
🎯 Entry: Near EMA50 + confirmation candle
🛑 SL: Below the shadow
✅ TP: Fibonacci extensions at 161%, 261%, and 414%
You can already see how price exploded after this textbook setup.
In the next move (second screenshot), price creates a wick to the upside—classic sign of profit-taking or potential trap for late buyers.
✍️ If price retests EMA50 again with a valid setup, this could be your Re-entry Shot.
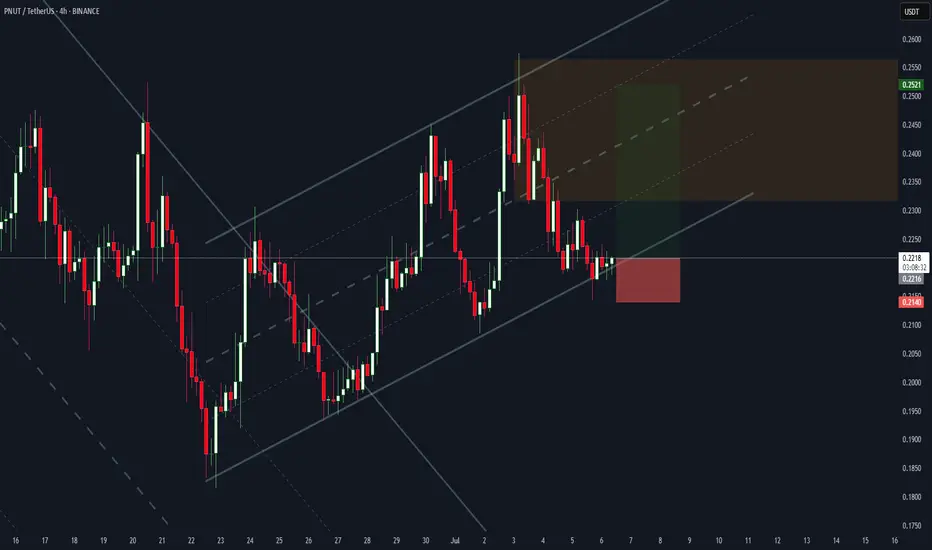
PNUT/USDT – Bullish Rebound from Channel Support | Long SetupPNUT/USDT is currently respecting the ascending parallel channel on the 4H timeframe. Price bounced off the lower boundary of the channel, showing signs of a potential bullish continuation. A long position is entered near support, with a target toward the upper range of the channel and a tight stop loss just below the structure.
🔹 Entry: ~0.2218
🔹 Stop Loss: ~0.2140 (below channel support)
🔹 Take Profit: ~0.2521 (upper channel resistance)
🔹 Risk-to-Reward: ~4.2R
The trade aligns with the trend structure and offers a favorable R:R setup. Break of the channel may invalidate the setup.
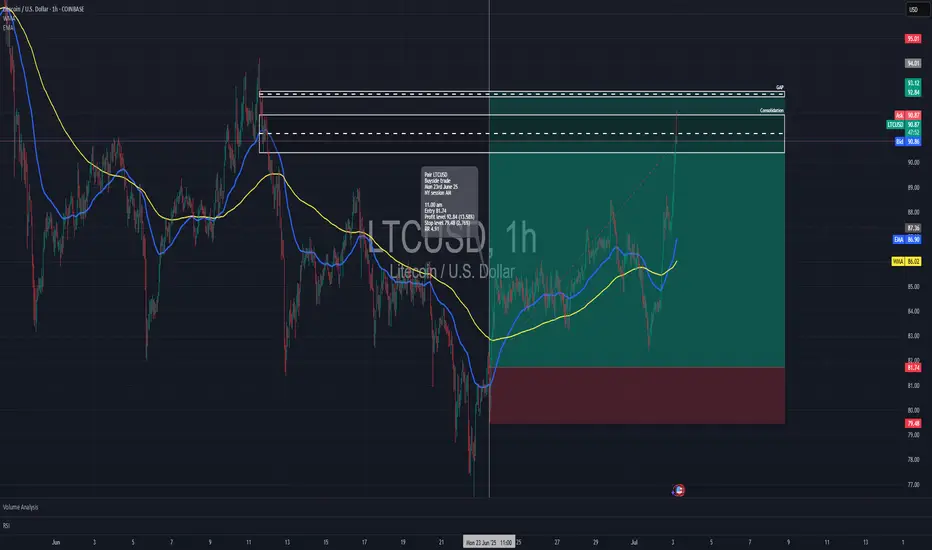
Long trade
Trade Details
Pair: LTCUSD (Litecoin / US Dollar)
Trade Type: Long (Buyside)
Session: NY AM, Monday, June 23rd, 2025
Time: 11:00 AM
Entry & Exit
Entry: $81.74
Take Profit (TP): $92.84 (+13.58%)
Stop Loss (SL): $79.48 (-2.76%)
Risk-Reward Ratio (RR): 4.91R
Trade Setup & Rationale
Structure: Price was consolidating above its moving averages; bullish momentum was building after the pullback. Confirmation: Entry followed the break above both the EMA (86.90) and WMA (86.02), with strong upward volume.
Target Zones: Take profit set at the top of prior consolidation and gap-fill zone.
Stop: Below the key structural low.
GOLD - POTENTIALLooking at gold. Its still in a bit of limbo after the NFP reaction on Friday. However it is looking like the draw on liquidity is higher. Therefore my bias on gold for the start of the week is bullish so will be looking to get the most optimal entry to take some buys to the upside.
If we can manage to find a decent enough move price really could rally upwards.
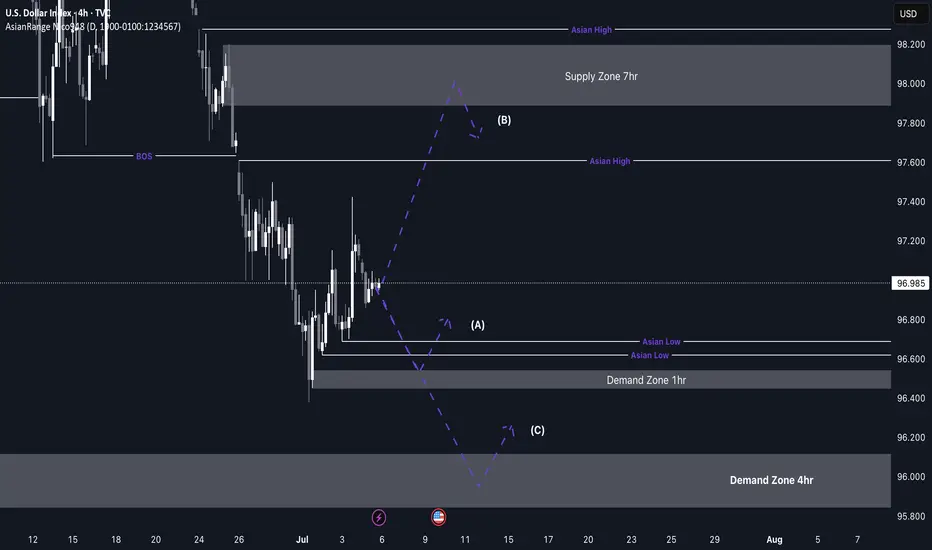
DXY (Dollar Index) longs to shortsThe dollar has been bearish for several weeks, but we’re now starting to see signs of a potential retracement due to price being in oversold territory. Last week, DXY reacted from a key weekly demand level, suggesting that we could see some short-term bullish movement before any continuation to the downside.
I’ll be watching closely for price to either push higher into liquidity or retrace slightly deeper into more discounted demand zones for a cleaner long setup. This would also align with my short setups across other major pairs, making DXY strength a key narrative this week.
Confluences for DXY Longs:
DXY has been bearish for an extended period — now showing signs of accumulation on higher timeframes
Price may retrace upwards to collect liquidity before continuing its macro downtrend
Recently reacted from a major weekly demand zone
Imbalances and liquidity above, including Asia highs, remain untapped
P.S. If price fails to react from any of my current POIs, I’ll patiently wait for new zones to develop and adjust accordingly — always staying aligned with what price tells us.
Let’s stay sharp and crush the week ahead!