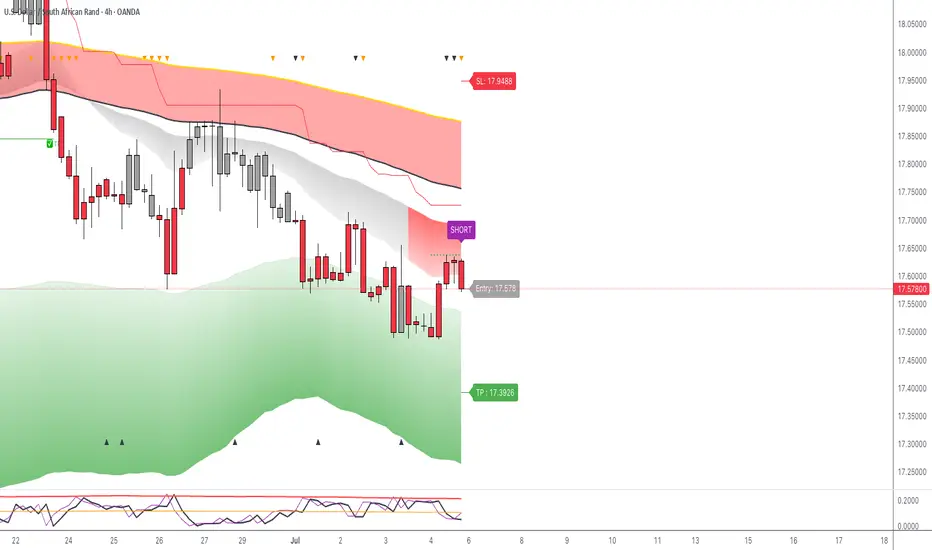
USDZAR: Sell Trigger on 4HGood morning and happy weekend everyone,
today I bring the chart of the UsdZar pair which shows a sell trigger via my LuBot Ultimate indicator which goes in favor of the short-term trend and the bearish market structure, both on the 4H and on the Daily, highlighted by the color of the candles in red.
The signal is also confirmed by the reversal signals shown above and a close below the previous 2 candles.
The indicator automatically shows exit levels that I will follow for my trade as the stop loss is far enough away to give the market room to breathe if it needs it and to avoid unnecessary stops. Stop which will subsequently be approached if the market moves in the direction of the trade.
The take profit is at the right distance given that we are close to a support zone indicated by the green area of the indicator.
Finally, the EVE indicator below has not shown any major excesses of volatility so we could still expect a strong movement before a possible reversal.
FX:USDZAR FOREXCOM:USDZAR SAXO:USDZAR FX_IDC:USDZAR OANDA:ZARJPY OANDA:EURZAR OANDA:GBPZAR OANDA:CHFZAR SAXO:AUDZAR SAXO:NZDZAR
Multiple Time Frame Analysis
GOLD LIQUIDITY MASTERCLASS: The Smart Money Playbook Revealed🧠 INSTITUTIONAL MINDSET
At $3,365: "Perfect! Time to sell into retail buying"
At $3,337: "Let's see how this plays out"
At $3,318: "Preparing for the hunt"
At $3,270: "Starting to accumulate"
At $3,245: "Loading the truck! This is what we've been waiting for"
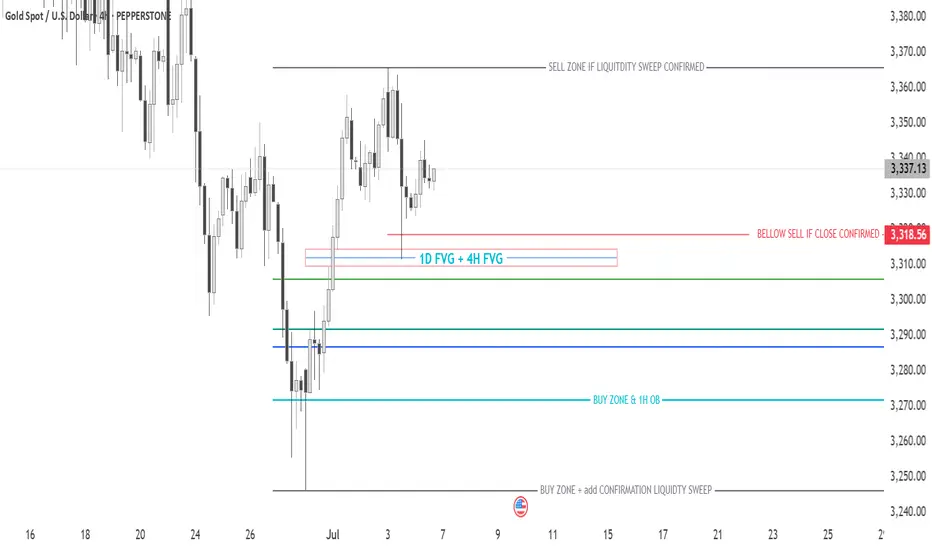
🔍 LIQUIDITY ZONES DECODED: The Hidden Treasure Map
🎯 BELLOW SELL IF CLOSE CONFIRMED: $3,318
Significance: Close below = bears take control
Time Frame: 4H close confirmation needed
________________
🛡️ BUY ZONE & 1H OB: $3,270
The Fortress: Major institutional buy zone
Order Block Significance: 1H order block provides additional support
Risk/Reward Sweet Spot: Excellent entry for swing positions
_______________
⚡ BUY ZONE + ADD CONFIRMATION LIQUIDITY SWEEP: $3,245
The Ultimate Accumulation Zone: Where smart money loads up
_________ 🎯 STRATEGY _________
Entry: $3,238-$3,2440 (after liquidity sweep confirmation)
Stop Loss: $3,230 (below the sweep low)
Target 1: $3,290 (Risk:Reward 1:3)
Target 2: $3,320 (Risk:Reward 1:5)
Target 3: $3,365 (Risk:Reward 1:8)
🚨 RISK WARNING 🛡️ DYOR 🚨 DISCLAIMER - JUST FOR EDUCATION PROPOSAL ⚠️
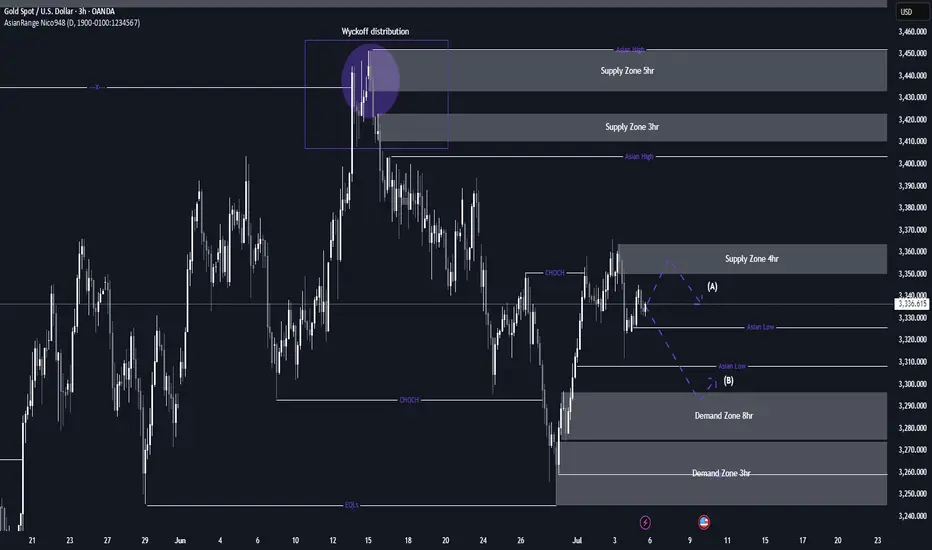
XAU/USD possible shorts from 3,350 towards 3,290 longsThis week, my focus is on a potential sell setup that could form within the 4-hour supply zone, which is currently near price. I’ll be patiently watching for signs of Wyckoff distribution within this point of interest (POI), which could confirm a short opportunity.
Given that price action has been bearish, this would be a pro-trend setup, especially with the visible liquidity resting below that we can look to target. Additionally, there is an 8-hour demand zone further below, which may provide a potential long opportunity once price reaches that level.
Confluences for GOLD Sells:
- Bearish market structure: Gold has been trending downward and has recently left behind a clean, unmitigated 4-hour supply zone, which could prompt a bearish reaction.
- Liquidity targets below: There's significant liquidity under recent lows, including Asia session lows and the 8-hour demand zone, which can be targeted.
- DXY correlation: The dollar has reacted strongly from a notable demand zone, suggesting potential upside for DXY, which may add bearish pressure on gold.
- Higher timeframe Wyckoff: A Wyckoff distribution pattern has also formed on the higher timeframe, which may indicate temporary bearish order flow.
P.S. If price disrespects the current 4-hour supply zone, I will shift focus to an extreme 3-hour supply zone above. Until price reaches that level, I may look for short-term buy setups to trade the move up.
Wishing everyone a great and profitable trading week! Stay disciplined and manage risk accordingly.
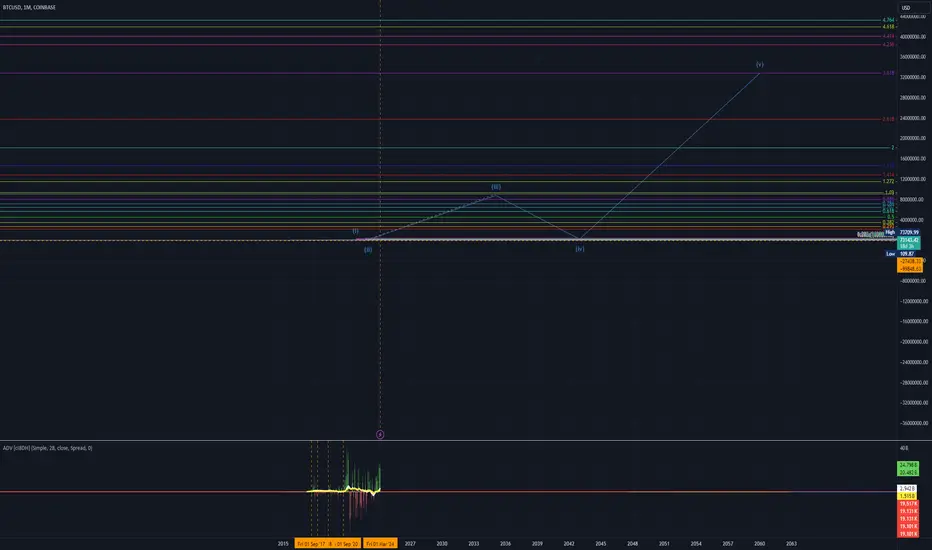
40 Year Rough EstimateThis chart looks silly, I know. Turn on log to see it a bit better. It sounds absurd, but so does just about any market.
The only thing I can see stopping this is a return to the gold standard. As long as money can be printed for free, it will. Bitcoin can't.
I suspect we'll start seeing the qSAT (quadrillionSAT) shorthand or something, because you can always add more zeroes.
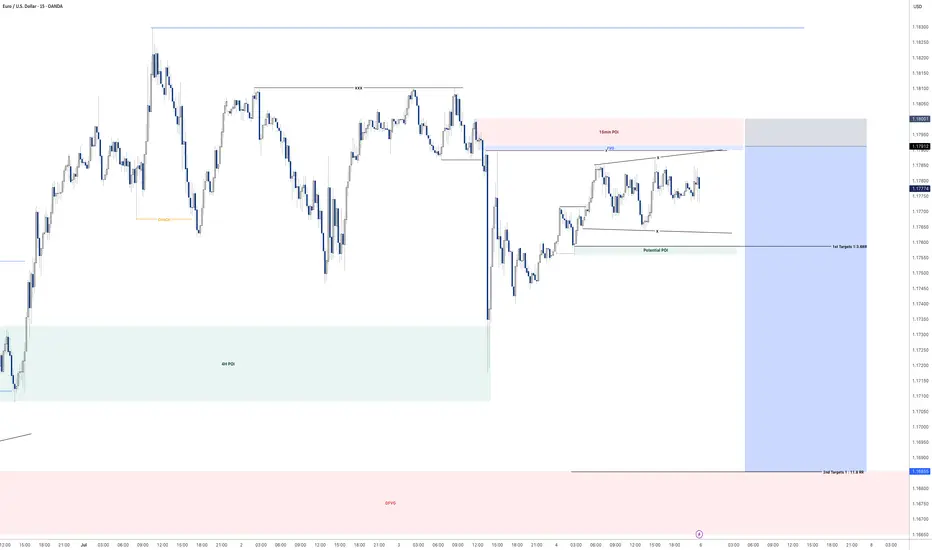
EURUSD - Where next?Looking at EURUSD
I still feel like we are due some sort of deeper retracement to the downside considering how bullish the 4H and Daily time frame have been in recent times.
Although the market does not care how I feel in all honesty haha. I will play the short term short until the 15min orderflow switches bullish once again.
The expansion that is currently happing right now is very interesting and makes a good watch to see what we will do come market open as we are engineering liquidity for both a buy and sell with both POI's looking primed for entries.
Will be keeping a close and keen eye on EURUSD when the market opens
Any questions feel free to give me a message
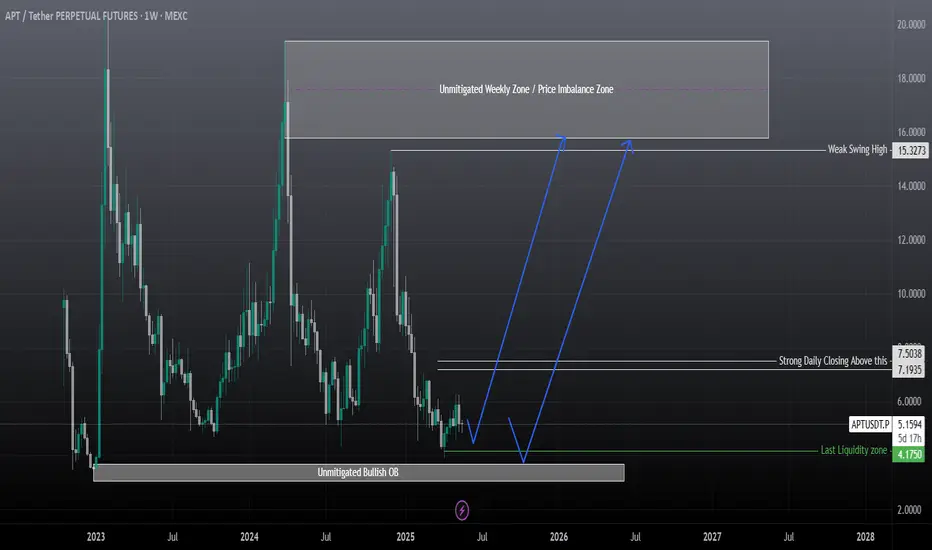
Aptos Long Term ViewAptos taken out almost all liquidation from below side, it can fall more towards 3.5$ to take out all new buyers and then push towards 15$, remember 15-16$ is an unmitigated zone, sooner or later this imbalance zone will be filled. So if your an investor and want easy 3x gain then buy apt from 5$ 2nd entry 4$ and last buying from 3.5$, ignore lower timeframe volatility and BTC movement, these entries are easily achievable if market crashes by any chance so you can close your position at breakeven. While 7.19-7.50$ area is crucial to break, once this zone is broken there is nothing upside that can stop Aptos from hitting 15$. Any daily candle closing above the marked zone will confirm trend shift, before this trade setup is like high risk n reward. While I'm very confident on Aptos that it will hit 15% mark.
GOLD (XAUUSD) | 4H OB Respected | waiting for 30m LH BreakPair: XAUUSD
Bias: Bullish
Timeframes: 4H, 30M, LTFs
• 4H showing strong bullish structure — OB respected cleanly, confirming higher timeframe demand.
• On 30M, now patiently waiting for the break of LH to confirm continued bullish intent. After that, looking for a sweep off a fresh internal OB for LTF entry confirmation.
🔹 Entry: After LH break + sweep + CHoCH on LTFs
🔹 Entry Zone: Within fresh internal OB post-LH break
🔹 Target: Near structure highs
Mindset: Let the structure speak. No guesswork — wait for your levels, your break, and your confirmation. Precision over prediction.
Bless Trading!
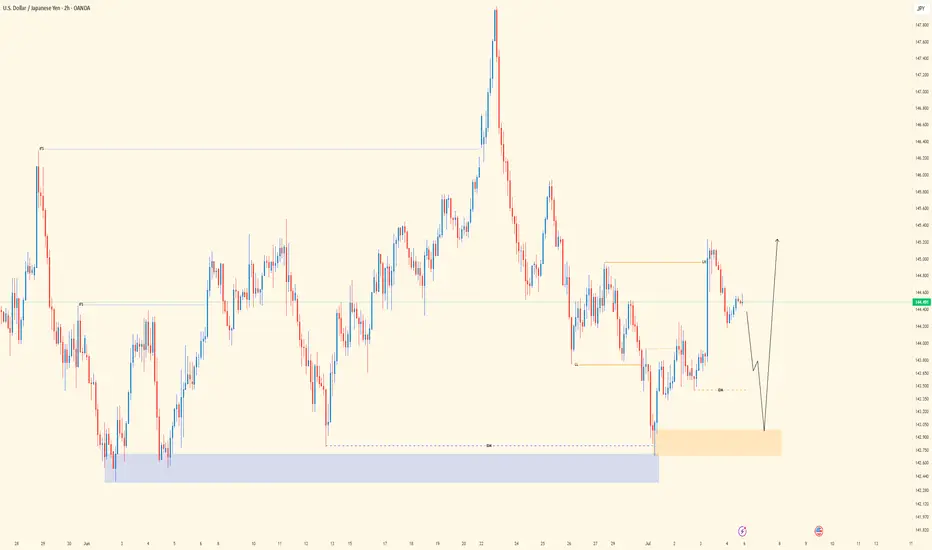
USDJPY| - Bullish Structure Holding | Waiting For Mitigation Pair: USDJPY
Bias: Bullish
Timeframes: 4H, 30M, LTFs
• 4H is showing clean bullish structure — internal high was breached, confirming bullish pressure.
• 30M broke the LH, showing further signs of demand holding.
• Now waiting on price to return and mitigate the OB zone for possible LTF confirmation.
🔹 Entry: Once price hits OB and gives CHoCH/sweep confirmation on LTFs
🔹 Entry Zone: Marked OB on 30M
🔹 Target: Near structure highs (continuation path if demand holds)
Mindset: Ride the wave, not the noise. Let the structure print, and don’t blink when price gives your cue.
Bless Trading!
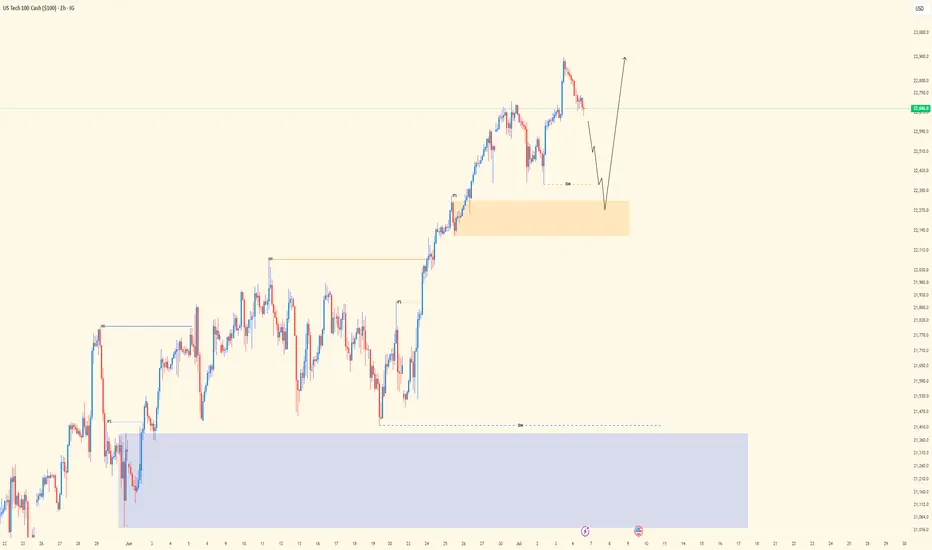
NASDAQ | - Structure Refined | Bullish Intent Into Next WeekPair: NAS100
Bias: Bullish
Timeframes: 4H, 2H, LTFs
• 4H broke structure to the upside with a new HH — clear sign of bullish intent stepping in.
• 2H gives clarity on the move — beginning of the week was messy, but price cleaned up nicely and gave us refined structure to work with.
• Now we wait for mitigation into the OB zone to see if price respects and gives us the setup.
🔹 Entry: After price mitigates OB and confirms with CHoCH on LTFs
🔹 Entry Zone: Marked OB zone — wait for confirmation
🔹 Target: Near structure highs — continuation if bulls step in
Mindset: Messy beginnings don’t mean bad outcomes. Structure eventually reveals the truth — just stay patient and ready.
Bless Trading!
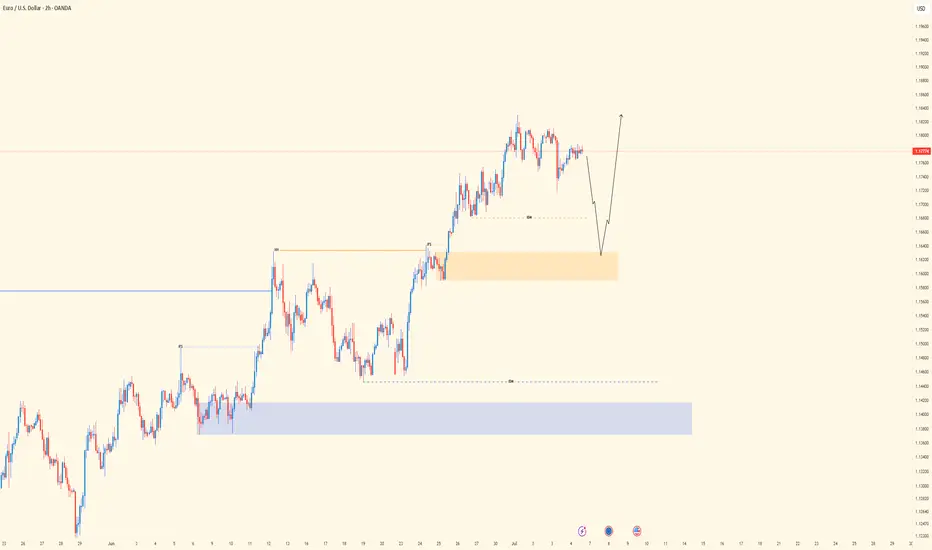
EU| - Bullish Structure Intact | Watching for SSL Sweep and RunPair: EURUSD
Bias: Bullish
Timeframes: 4H, 2H, LTFs
• 4H structure is clean and bullish — momentum’s been steady, and the market looks ready to ride higher going into next week.
• 2H gives clarity — I’m watching for a sweep of SSL into OB to set the stage for LTF confirmation.
• Entry process remains the same: wait for CHoCH, followed by sweep inside the OB zone.
🔹 Entry: After CHoCH + sweep inside OB (LTF process repeated)
🔹 Entry Zone: After confirmation within OB
🔹 Target: Structure highs — letting price unfold with the trend
Mindset: Patience pays the most. Wait for the market to come to you, not the other way around.
Bless Trading!
GU| - Bullish Ride in Motion | Key Zone Hold into New WeekPair: GBPUSD
Bias: Bullish
Timeframes: 4H, 2H, 30M
• 4H showing strong bullish momentum — price pushed aggressively, and we caught the move. Heading into next week, the bullish continuation is still valid unless price tells us otherwise.
• 30M gave a sweep from a refined OB zone — circled area shows the key move. Watching closely to see if bulls truly hold that ground.
• 2H gives a clear picture of structure — smooth directional flow confirming the bias.
🔹 Entry: After break of micro LH for confirmation
🔹 Entry Zone: Will be found within price flow — post-shift
🔹 Target: Structure highs — same continuation goal if bulls follow through
Mindset: No chasing. We wait, let price do the heavy lifting. Our job is to react with clarity, not emotion.
Bless Trading!

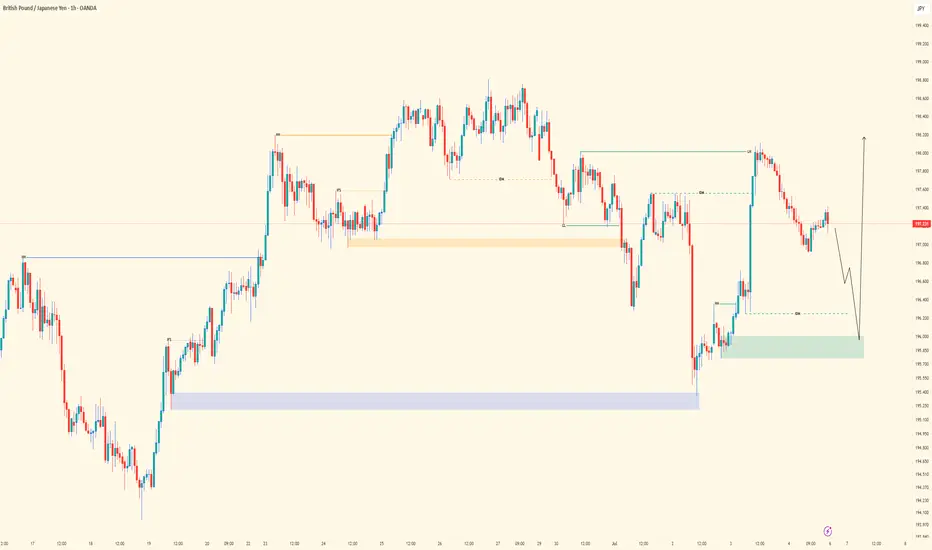
GJ| - Bullish Flow Maintained |Continuation into Next Week Pair: GBPJPY
Bias: Bullish
Timeframes: 4H, 1H, 30M
• 4H structure remains clean and bullish — no break in flow. Price is still respecting HTF order and momentum.
• 30M gave us that deeper SSL sweep, likely grabbing the early buyers and fast hands. But we stayed patient and followed the structure.
• 1H shows my view clearly — bullish pressure confirmed with reaction from OB and shift in momentum.
🔹 Entry: After sweep of SSL into demand (OB)
🔹 Entry Zone: Green zone marked — same level from earlier in the week
🔹 Target: Near structure highs — letting price flow up clean
Mindset: Week played out with precision. All levels still valid going into next week — no need to erase, just observe how price continues to respect our framework.
Bless Trading!
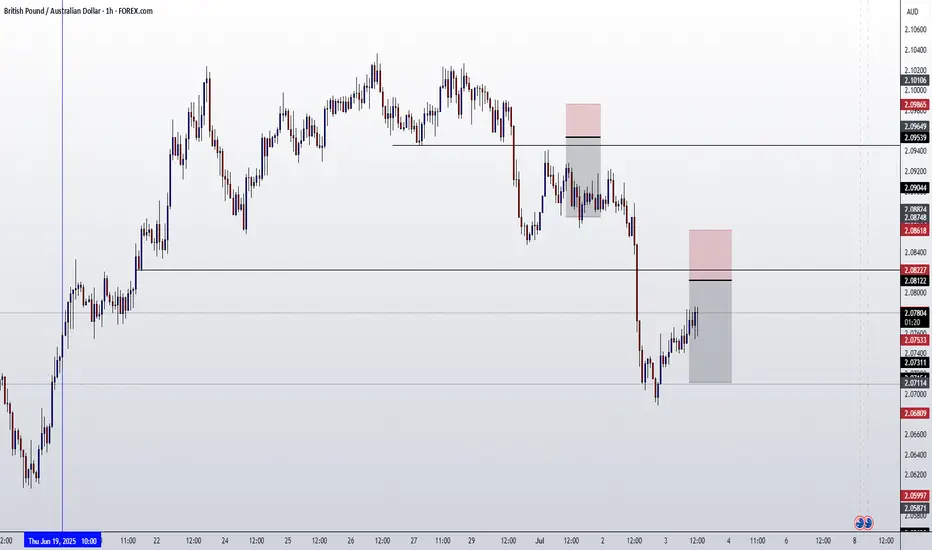
GBPAUD ENTRY CHARTOn this Pair, we are still BEARISH, as TREND is Obviously still DOWN, also in our Intra-day trend, We are having BOS to the Down-side, we took our based of FVG confirmation with our MA+ Zones with our Additional Confluences, If this matches with your idea, you can look to join us, with a Good Risk Management, Thank You.
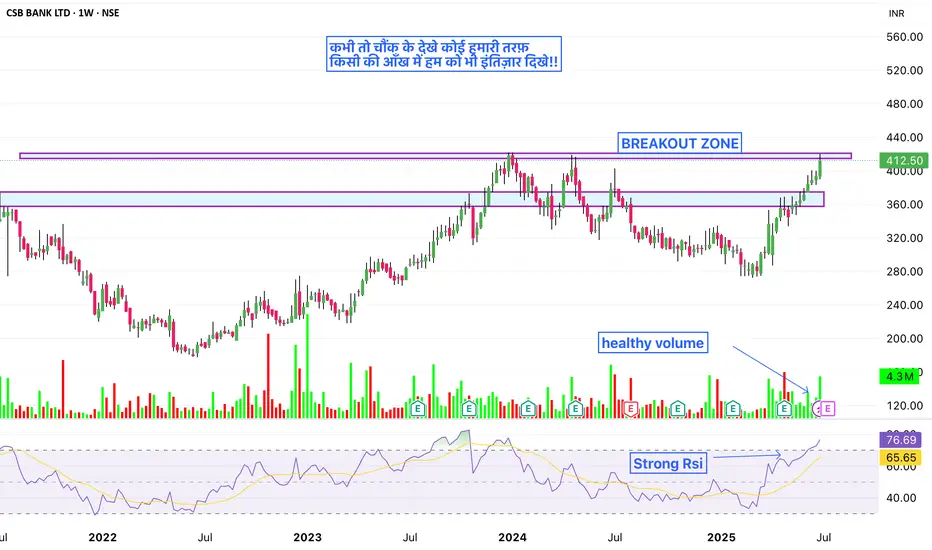
strong RSI, strong VOLUME, strong PRICE ACTIONthe banknifty is nbear life high. this stock is eyeing a multimonth, breAKOUT .
RSI: ABOVE 70 strong
volume: huge spike
price action: strong uptrend
the above could lead to strong follow up
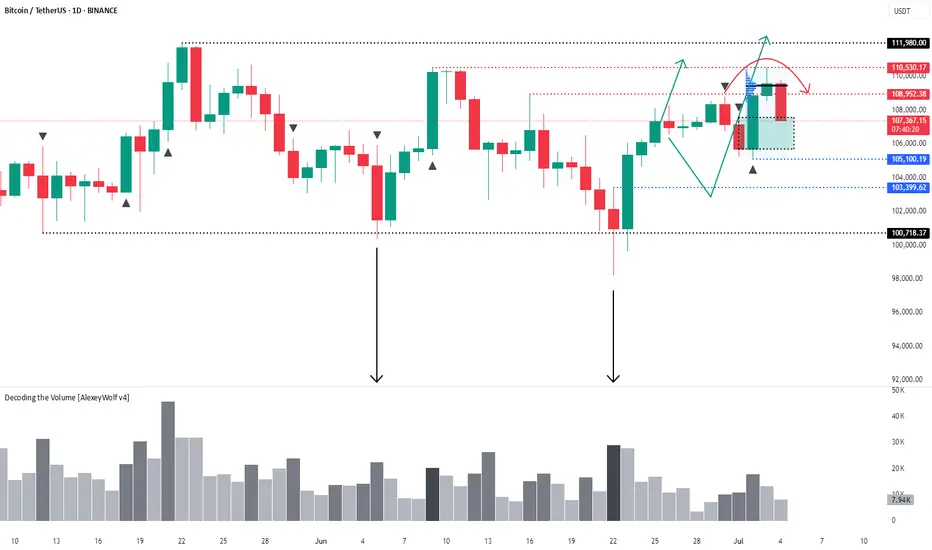
Final move by the bears? Bulls lining up for ATHHi traders and investors!
Buyers have reached the first target at 108,952.
On Binance spot, BTC missed the second target (110,530.17) by just 99 cents.
Is this a setup for a breakout and a run toward a new ATH?
So far, the price action looks like a level manipulation around 108,952: volume in all 3 bars interacting with this level is concentrated above it.
Just below lies a buyer zone (107,500 – 105,100).
I am watching for buyer reaction once the price reaches this area.
This analysis is based on the Initiative Analysis concept (IA).
Wishing you profitable trades!
3 PM Market Update _ USDCADWhat happened was that the market reversed into a buy sentiment which i was able to take advantage of by using my strategy!!

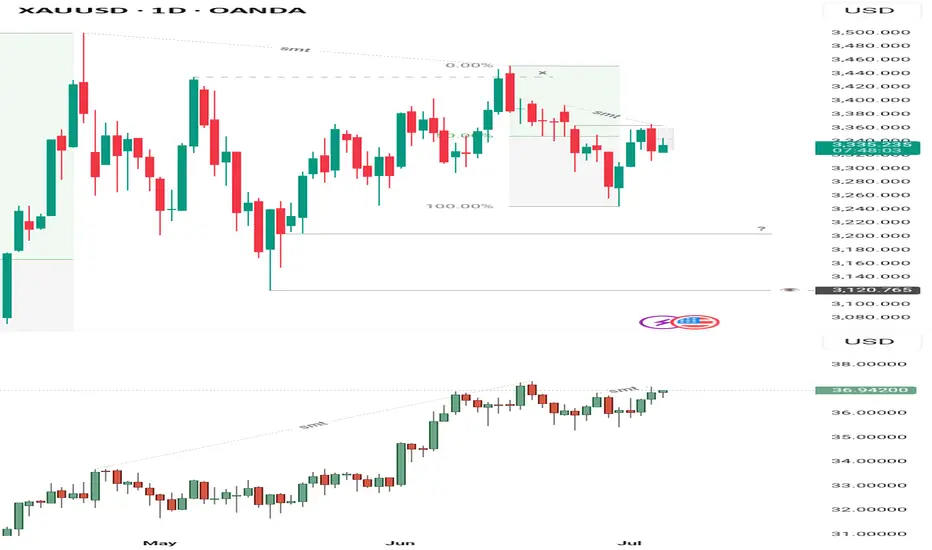
Gold-Silver Discrepancy Analysis – Reevaluation After NFP ReactiAfter taking a loss yesterday, I had to reassess my outlook on Gold. The market behavior leading into and following the NFP event revealed significant discrepancies between Gold and Silver that can’t be ignored.
Since April 24th — the day Gold printed its highest price in human history — the daily chart has shown consistent lower low formations. In contrast, Silver had been forming higher highs on the daily during this same period, showing relative strength.
However, this dynamic began to shift. On the 4-hour chart, Silver is now printing lower lows from last month’s high, aligning more closely with Gold, which has been bearish on both the daily and 4-hour timeframes since its peak.
A key moment occurred just before the NFP release: Silver made a strong run above last week’s high, while Gold failed to even trade above Wednesday’s high — which coincides with the gap fill from last week Tuesday’s open. This divergence in price behavior is crucial.
Gold closed yesterday with a full-bodied bearish engulfing candle, rejecting that same gap area. Meanwhile, Silver’s breakout above last week’s high, despite its internal weakness, is a clear discrepancy of value.
Now, with Silver beginning to shift into lower low structure on the daily and no bullish market structure shift present on the 4-hour chart, the bullish narrative weakens. This divergence between both metals—especially as Silver shows signs of internal breakdown—suggests a high-probability case that the market may be preparing for a broader downside move rather than continuation to the upside.
That said, the key level at 3225/3200, which I marked during my previous bullish outlook, remains on watch. Price reaction at this zone will be critical in determining whether the market still has a chance to reclaim bullish intent or if the short bias continues to play out. If the bearish pressure holds, 3120 becomes a likely target—and a deeper fall toward 2960 wouldn’t be surprising either, considering it aligns with a key discount zone from the weekly timeframe.
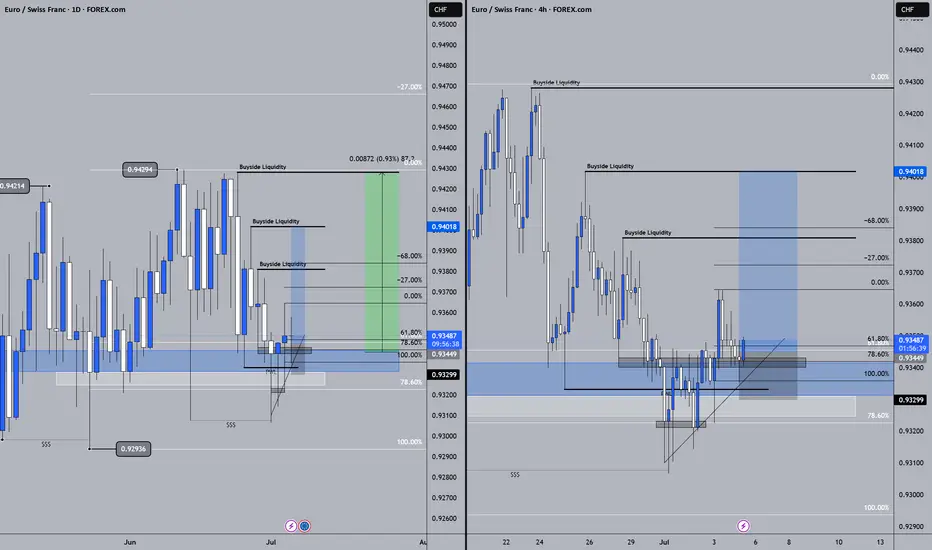
EURCHF 04/07/2025Weekly:
-Inverse H&S pattern.
-Previous week low liquidity sweep.
-Expecting a bullish reaction.
Daily:
-Bullish M pattern.
-Liquidity sweep.
-Daily lows.
4H:
-Inverse H&S pattern.
-Double bottom.
Trade Idea For USDCADDon't forget to follow!!
Eurusd on our medium timeframe is CT to the higher timeframe so at this stage we only targeting a fixed 1:5RR.

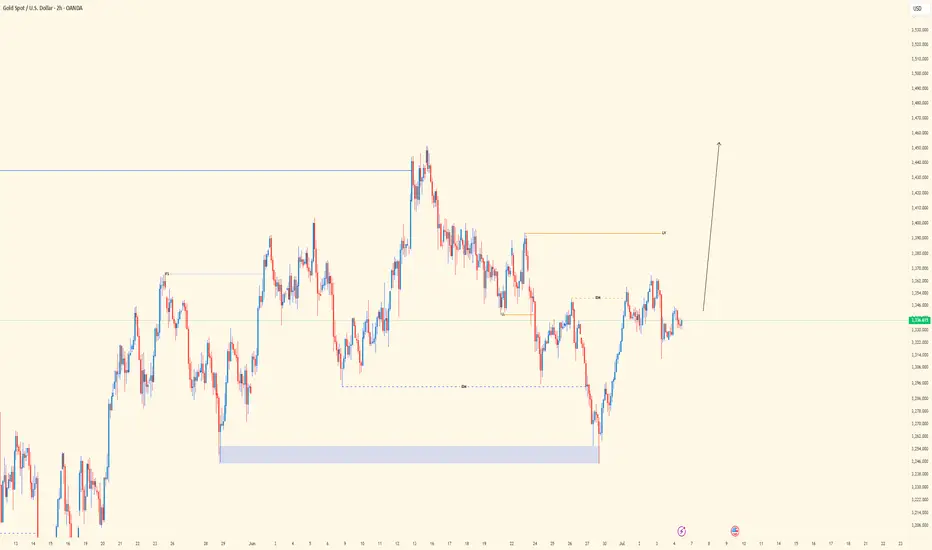
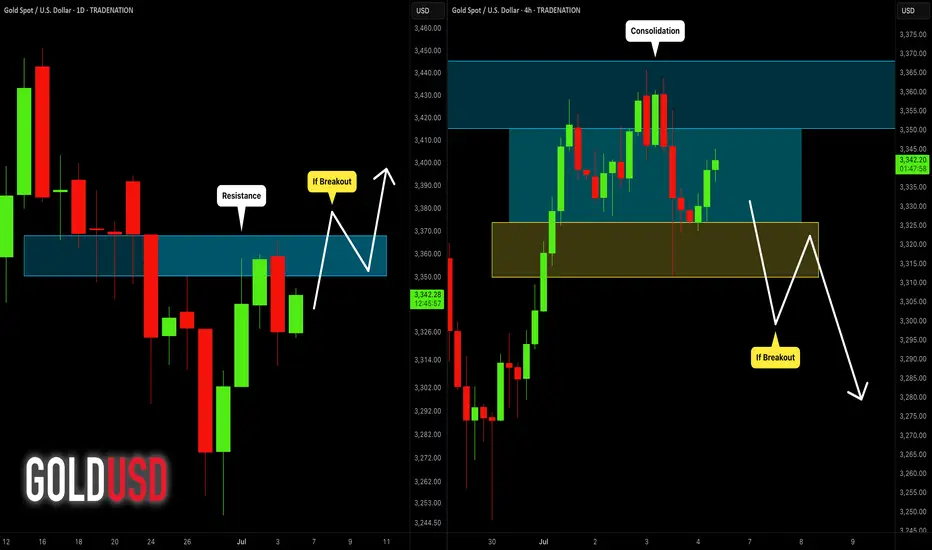
GOLD (XAUUSD): Potential Scenarios Explained
Here is my updated technical outlook for Gold with potential scenarios.
Bullish Scenario
The price is currently testing a significant daily resistance cluster.
Its bullish breakout and a daily candle close above 3368 will
provide a strong confirmation.
More growth will be expected then.
Bearish Scenario
For now, the market is consolidating on the underlined resistance.
The price is stuck within a horizontal range on a 4H time frame now.
Your bearish signal will be a breakout of its support and a 4H candle
close below 3310.
It will provide a strong bearish confirmation.
The market might be weak and remain within a 4H range today.
But, everything can happen, so watch carefully.
❤️Please, support my work with like, thank you!❤️
I am part of Trade Nation's Influencer program and receive a monthly fee for using their TradingView charts in my analysis.
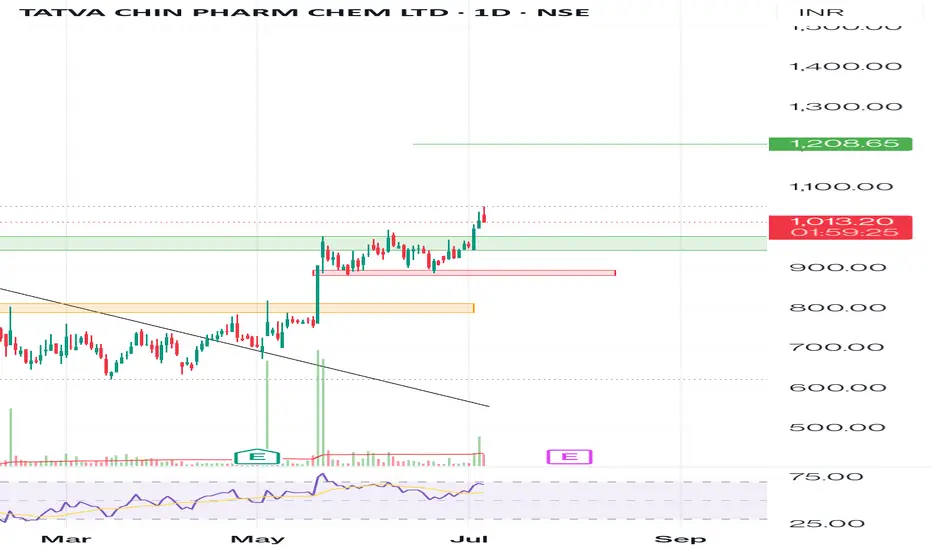
Tatva chintan Buy - 980-1015
Stoploss - 940
Target - 1200 short term
Long term hold for target of 2650
Skeptic | Dogwifhat (WIF): Precision Triggers for Spot & FuturesWelcome, traders, Its Skeptic! 😎 Is Dogwifhat (WIF) the next meme coin rocket or a risky gamble? I’m diving into a pro-level breakdown of WIF, the Solana-based meme coin with a $882.06M market cap, ranked #75 globally. This analysis covers recent performance, ecosystem strengths, and technical triggers for spot and futures trading, grounded in cycle-based strategies. Trade with no FOMO, no hype, just reason. Let’s dissect WIF! 🚖
📰 Recent Performance & Key Events
Dogwifhat (WIF) , a Solana-based meme coin launched in late 2023, trades at 0.886 with a $882.06M market cap, ranking #75 globally. Featuring a Shiba Inu in a pink beanie, it leverages Solana’s high-speed, low-fee blockchain and a deflationary burn mechanism with a 998.9 million token supply. Listed on major exchanges like Binance, KuCoin, and Gate.io, WIF enjoys strong liquidity. In July 2025, it’s up 5.26% in 24 hours and 24.57% over 7 days, with a 24-hour trading volume of $450M. However, it’s down 80.94% from its all-time high of $4.84 (March 31, 2024), reflecting meme coin volatility :)
Technical & Market Position
WIF benefits from Solana’s scalable ecosystem, a hub for DeFi and NFTs, with 160,000+ TPS and low fees, outpacing slower networks. Its community-driven appeal, active on X, Reddit, and Discord, fuels its momentum, with posts highlighting a cult-like following. Compared to Pepe ($4.08B market cap, 456,000+ holders, 37% holding over a year), WIF’s smaller but vocal community shows dedication. However, its lack of real-world utility and reliance on social media hype mirror Pepe’s 25.7% year-to-date drop, raising concerns about sustainability.
Risks : Speculative volatility, pump-and-dump schemes, and dependence on Solana’s performance and social media sentiment make WIF a high-risk bet. Use stop loss to manage swings.
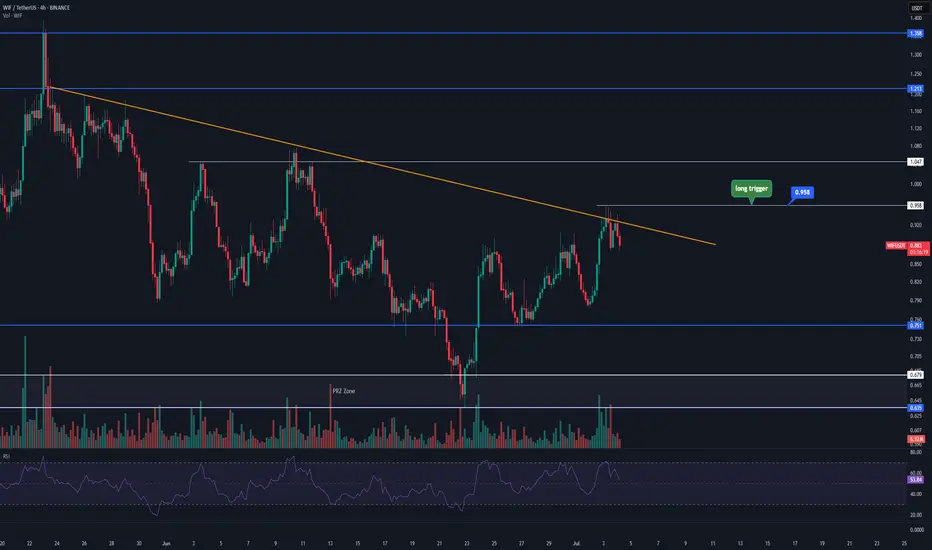
📈 Technical Analysis
Daily Timeframe
The Weekly (HWC) is bearish, entering a major bearish trend after forming a double bottom and breaking support. However, the Daily (MWC) started an uptrend, achieving 350 % growth before correcting to the 0.5 Fibonacci retracement —a healthy correction without breaking the uptrend momentum. Key support zones are $0.635–$0.679 . A break below could resume the Weekly bearish trend, so stay alert.
Spot Trigger (Long): Break above resistance at $ 1.047 , confirmed by a volume surge (ideally 2x the average of the prior 5–7 candles). Volume is critical—technical analysis is an art, not a science, so don’t fixate on exact numbers.
Key Insight: The Daily uptrend holds, but a volume spike is essential to confirm bullish moves and avoid fakeouts.
4-Hour Timeframe (Futures Triggers)
On the 4-hour chart (LWC), for longs:
Trigger: Break of the downward trendline and resistance at $ 0.958 , with volume confirmation (strong volume seen in the prior uptrend leg). Additional confirmation: RSI re-entering overbought.
Shorts: No short trigger currently. Despite the Weekly bearish HWC, the Daily MWC uptrend and strong support at $0.635–$0.679 make shorting illogical. Wait for a support break and MWC turning bearish for a safer short with better R/R.
Pro Tip: Longs are viable with volume and RSI confirmation. Avoid shorts until the MWC aligns bearish to minimize fakeout risk. Always use MAX 1%–2% risk per trade.
Final Vibe Check
This WIF breakdown delivers precise triggers for spot ($1.047) and futures ($0.958 long, no short yet), leveraging cycle-based strategies. With a bearish Weekly but bullish Daily, prioritize volume confirmation to navigate meme coin volatility. Solana’s ecosystem and exchange listings give WIF an edge, but its hype-driven nature demands caution. Want more cycle setups or another pair? Drop it in the comments! If this analysis sharpened your game, hit that boost—it fuels my mission! 😊 Stay disciplined, fam! ✌️
💬 Let’s Talk!
Which WIF trigger are you watching? Share your thoughts in the comments, and let’s crush it together!
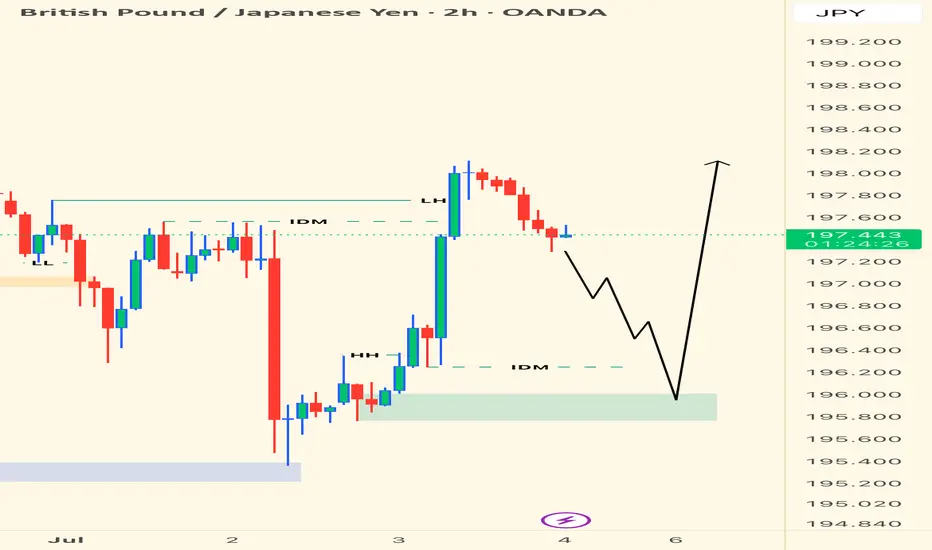
GBPJPY - Bullish Bias • Waiting to Execute from LTFPair: GBPJPY
Bias: Bullish
HTF Overview (2H): Price delivered the sweep I was patiently waiting for—textbook clean across multiple timeframes. The market has now tapped into the deeper range where real interest lies.
LTF Confirmation: All I need now is a structure shift + inducement on the 5M/1M to step in. I only move when the market shows its hand.
Entry Zone: Green zone marked on chart—expecting LTF sweep + shift before executing.
Targets: Short-term target is near the previous structure high around 198.200+.
Mindset Note: This setup has been cooking all week. Now the prep is done, I just need precision. Watching like a hawk. When it confirms—I strike.
Bless Trading!