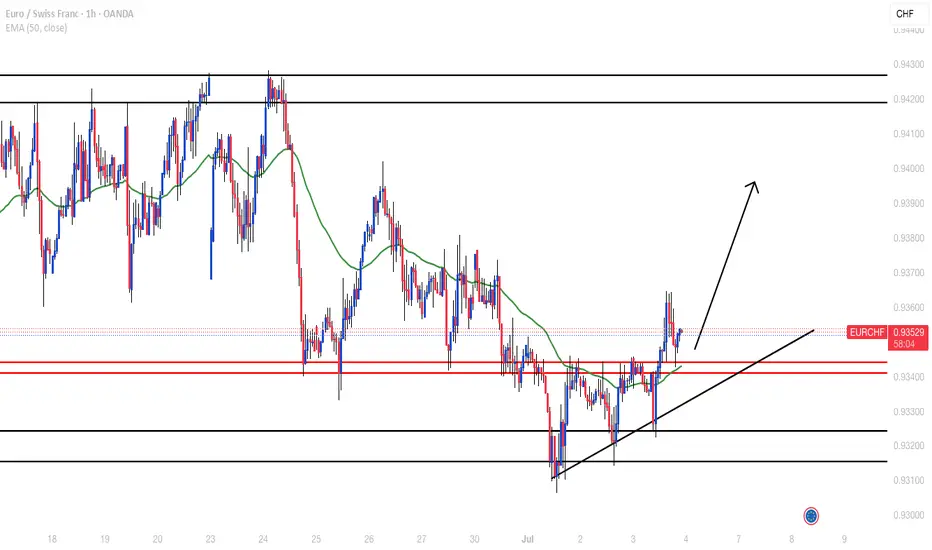
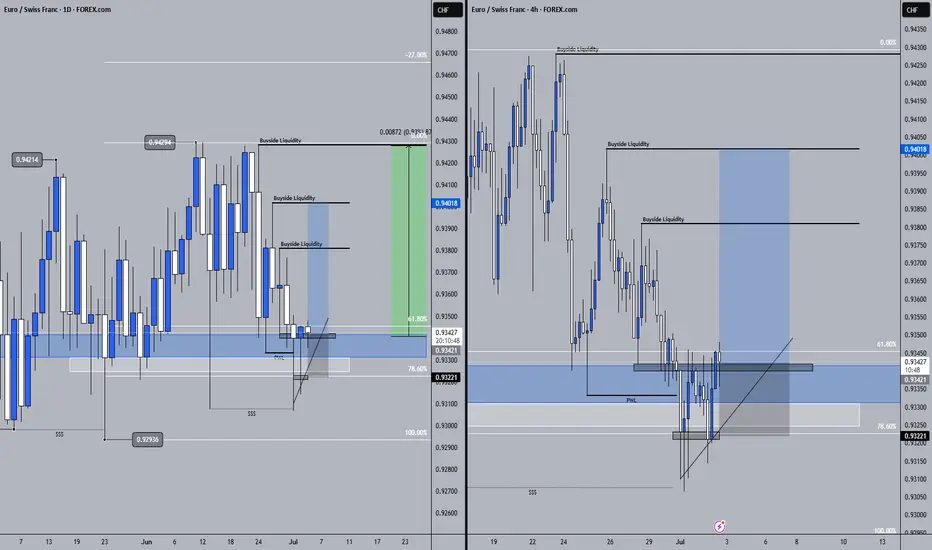
EURCHFPair still in an H4 range. Bounced off support zone, broke H1 resistance and retested. Looking to go long to next H1 resistance zones
Multiple Time Frame Analysis
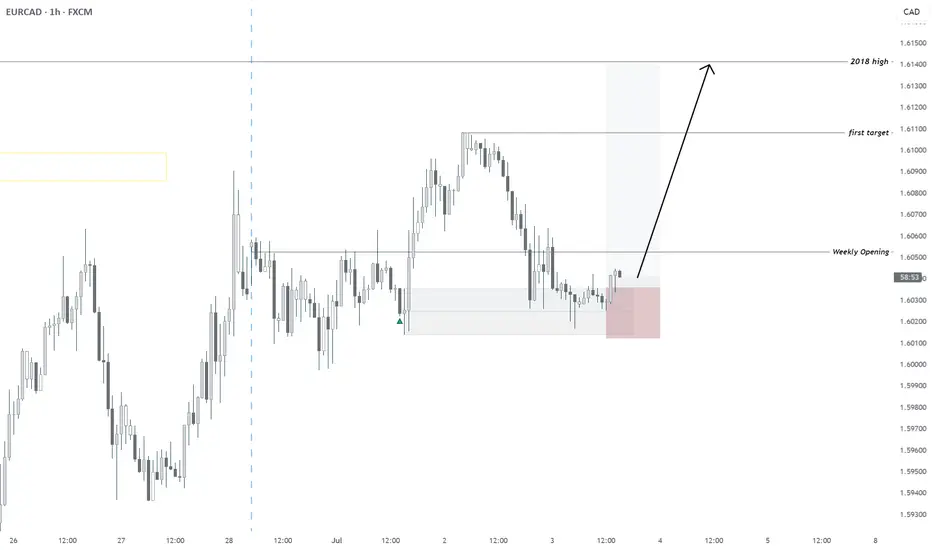
07/02/2025 | EURCAD | BULLISH - REACHING MULTI-YEAR HIGHDaily FX Outlook today:
All timeframes Bullish
Invalidation: 1.60055
First TP: on chart
Second: 2018 High
Skeptic | SUI Breakdown: Precision Triggers for Spot & FuturesWelcome, traders, its Skeptic! 😎 Ready to unlock SUI’s next big move? I’m delivering a pro-level breakdown of SUI, the #12 crypto with a $10.4B market cap.This Analysis dives into recent performance, ecosystem growth, and technical triggers for spot and futures trading, all rooted in cycle-based strategies. Trade with no FOMO, no hype, just reason , Let’s conquer SUI! 🚖
Recent Performance & Key Events
SUI , trading at $ 2.98 with a $ 10.4 billion market cap, ranks as the # 12 cryptocurrency globally. A Layer-1 blockchain using the Move programming language, it boasts parallel transaction processing with over 160,000 TPS. In July 2025, SUI showed strong momentum, surging 10% in 24 hours and 12% weekly after bottoming in the $2.30–$2.40 range. However, a 44 million token unlock ($122M) on July 1 introduces potential selling pressure. 📊
Technical & Market Position
SUI’s Total Value Locked ( TVL ) reached $ 2.1 billion in early 2025, ranking it the 8th largest blockchain by TVL. Its DeFi ecosystem is exploding, with stablecoin volume jumping from $ 400M to $ 1.2B . Bitcoin integration and a Microsoft partnership bolster institutional adoption, signaling strong fundamentals despite volatility.
Technical Analysis
Daily Timeframe
The Daily (HWC) is in an uptrend, holding above the upward trendline (marked in blue). The major trend remains bullish unless this trendline breaks. However, the MWC is bearish, with declining volume during recent price rises suggesting a secondary corrective trend rather than a primary bullish trend. As Mark Andrew Lim notes in The Handbook of Technical Analysis, rising prices need increasing volume to confirm trader conviction and bullish momentum. Low volume indicates trend weakness, typical of corrective moves.
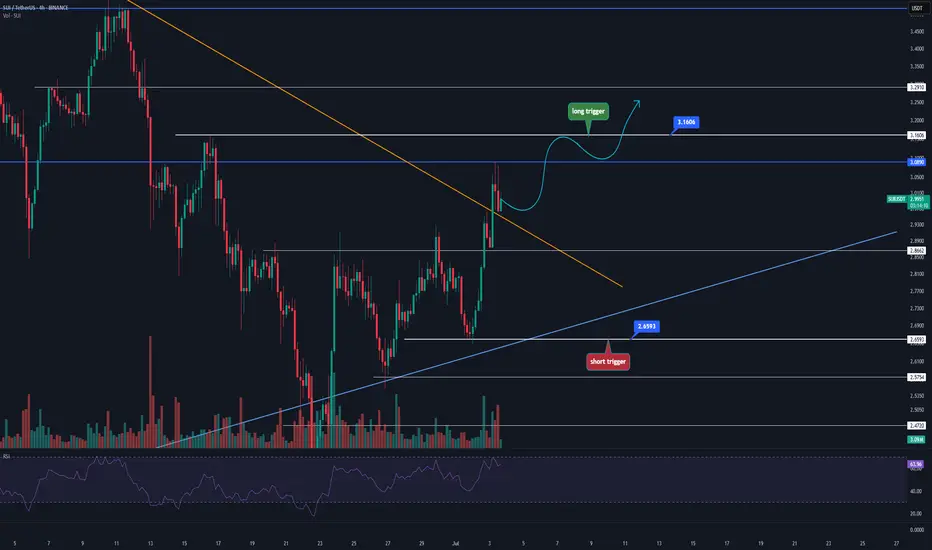
Spot Trigger (Long): Break of the downward corrective trendline with consolidation above resistance at $ 3.0408 . The last series breaking this trendline saw 85 % growth, but don’t rush in. Confirm with:
Falling BTC.D (Bitcoin dominance).
Total 3 long triggers (market-wide altcoin signals).
SUI/BTC uptrend, with an initial trigger on breaking its downward trendline and a primary trigger at 0.00003998 resistance.
Key Insight: Volume confirmation is critical. Without a volume surge on breakout, the risk of fakeouts is high.
4-Hour Timeframe (Futures Triggers)
On the 4-hour chart, if price reacts again at resistance $ 3.0890 , you can go long on a breakout, confirmed by RSI entering oversold. If it rejects sharply, the next long trigger is a break of $3.1606. For shorts, a break below support at $2.6593 is a strong trigger, especially with volume confirmation.
Pro Tip: Volume is king for all triggers. Without a volume spike on breakout, fakeout risk is high. Always apply capital management—1%–2% risk per trade to stay safe.
Final Vibe Check
This SUI Analysis equips you with precise triggers for spot ($3.0408) and futures ($3.0890/$3.1606 long, $2.6593 short) trading, leveraging cycle-based strategies. Want more cycle setups or another pair? Drop it in the comments! If this analysis sharpened your edge, hit that boost—it fuels my mission! 😊 Stay disciplined, fam! ✌️
💬 Let’s Talk!
Which SUI trigger are you eyeing? Share your thoughts in the comments, and let’s crush it together!
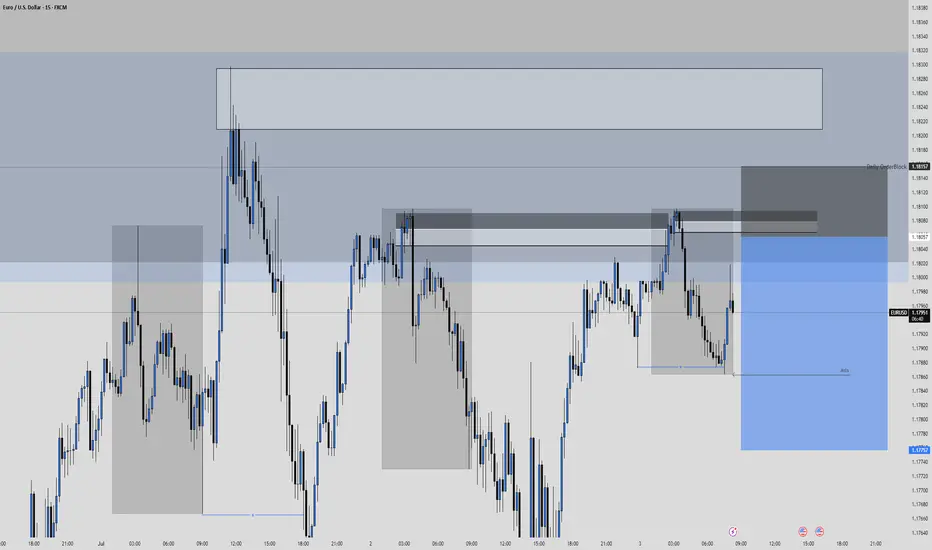
EURUSD Short, 03 JuneHTF shows clear Bearish OBs on both W and D, with doji & hammer formations hinting at buyer exhaustion. Expecting a pullback into imbalance below.
On LTF, we’ve had a clean BOS in Asia, followed by a retrace into the last 15m extreme OB – an ideal scenario for forming a new lower high in the ongoing bearish trend.
📉 Entry: 1m BOS + reaction from 15m POI
🧩 Confluence: Asia BOS, LTF structure, DXY alignment
🎯 TP: Asia Low (less than 3RR), potential to run further into HTF imbalance
🛡️ Context: All factors align – HTF bias, LTF trend, and precise entry logic.
A textbook continuation play – if we’re going to turn, this is the zone to do it.
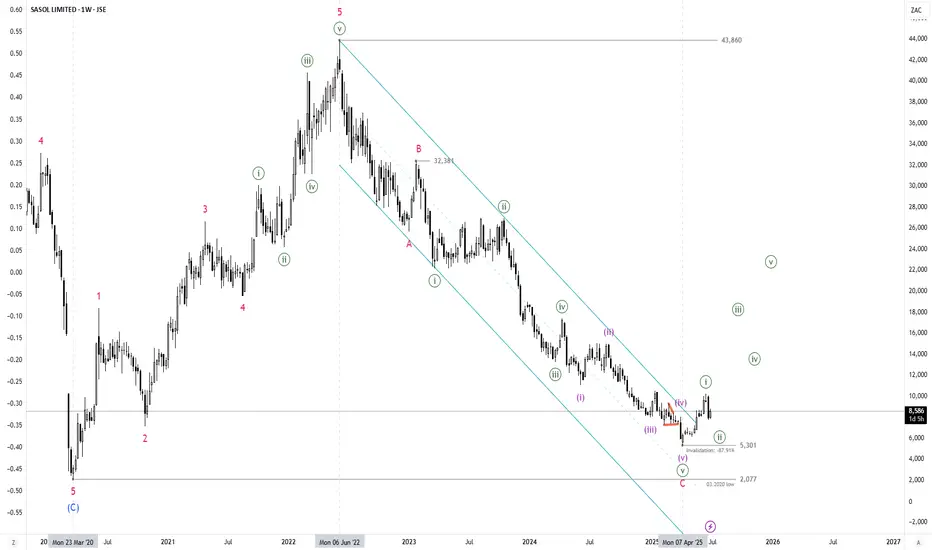
$JSESOL - Sasol: 5301 cps The Key Level To WatchTrade summary:
The major correction from 43860 cps has seen the share price decline by 87.91%.
The decline traced out a zigzag pattern and has potentially bottomed at 5301 cps, which is the key invalidation level.
The bounce from 5301 can be labelled as a five-wave advance when looked at in the daily timeframe.
Any retracement must hold above 5301 cps for the bullish outlook to remain valid.
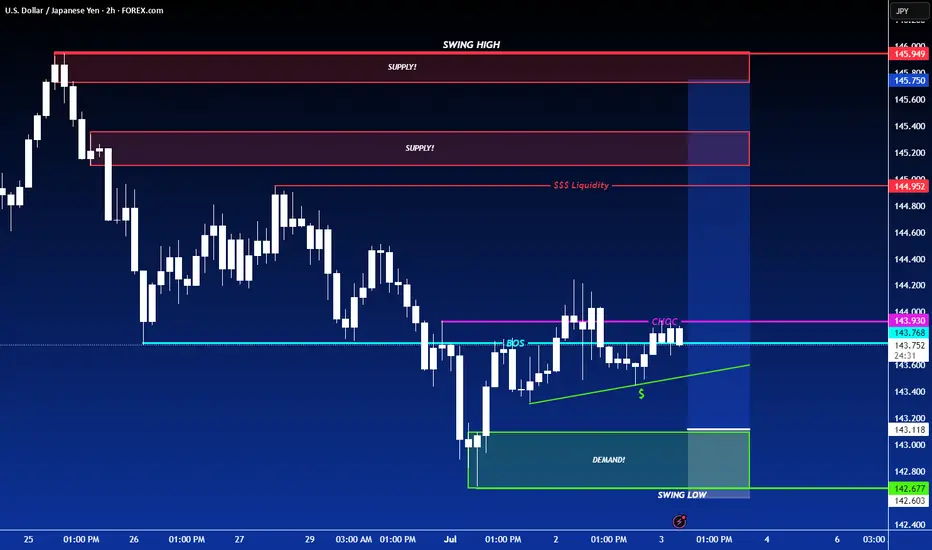
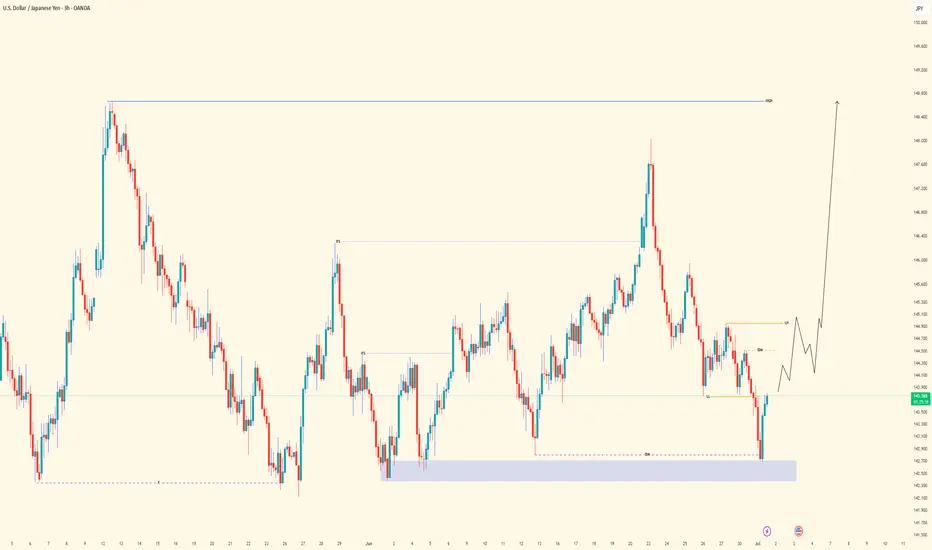
LONG ON USD/JPYUSD/JPY has given us a CHOC (change of character) from down to up.
It has engineered sell side liquidity right above a demand zone.
I expect price to sweep sell side liquidity, tap into the demand zone then take off to the upside.
looking to catch 150-250 pips on UJ. (Economic News could set this trade on Fire!)
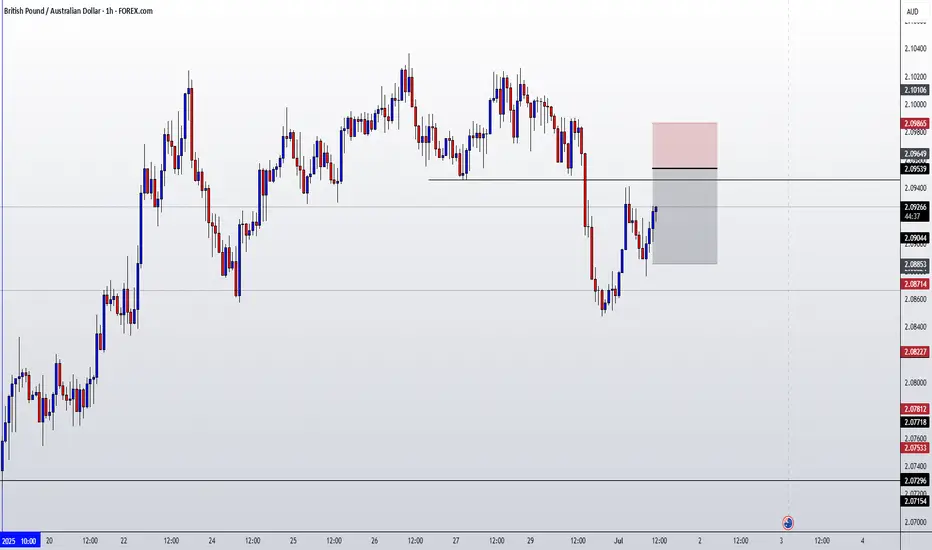
GBPAUD ENTRY CHARTOn this pair, we are anticipating for a SELL CONTINUATION, the intra-day time is BEARISH, but also we have strong BEARISH ENGULFING CANDLE on the daily close, the H1 is bearish, with a BB that is in confluence with the H4 SUPPLY, also we have additional confluence on this pair, So if this matches with your Idea, You can do well to join us with a Good Risk. THANK YOU and HAPPY NEW MONTH.
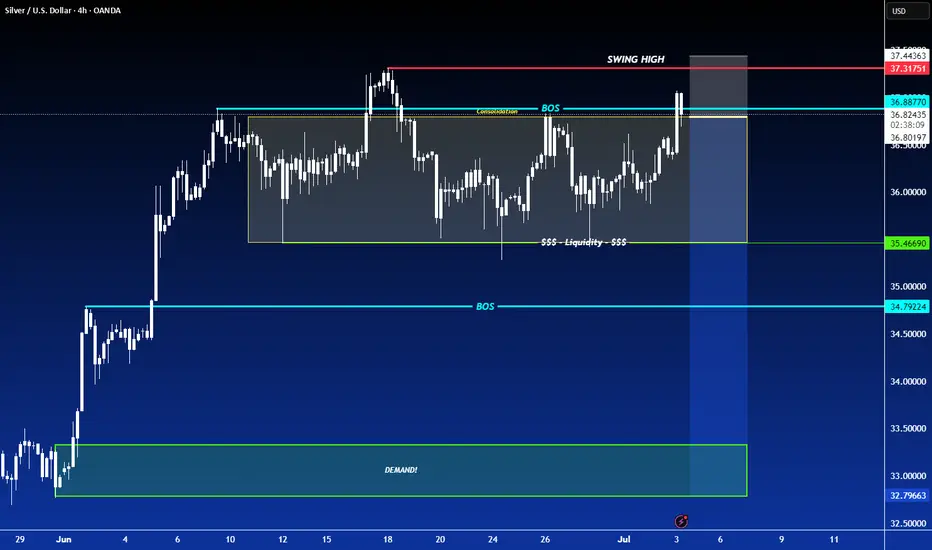
SHORT ON SILVER XAG/USDSilver has built lots of sell side liquidity since June 10 and should now be ready to sweep it.
I will be selling silver to the next demand level.
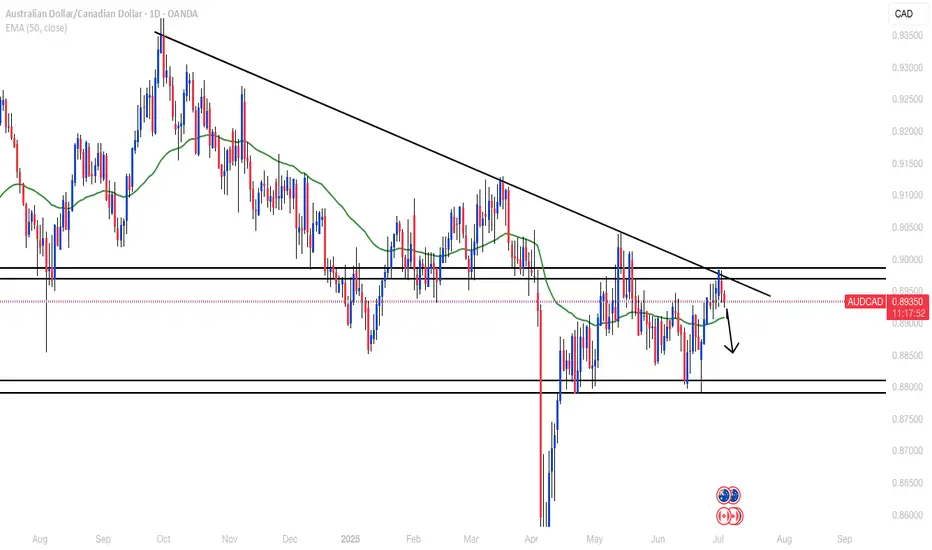
AUDCADRejecting off the daily resistance zone and trendline. Waiting for break below H4/H1 support, retest then look for selling signals
US30 buy(low probability because of low volatility)Weekly candle formation: OHLC/OLHC
Structure>liquidity>orderblock!
Bullish structure
Internal liquidity
Orerblock pojnt of interest.
07/02/2025 | EURJPY | BULLISH - QUICK SCALPALL TIMEFRAME:
Bullish
Invalidation: 169.482
Target: 170.045
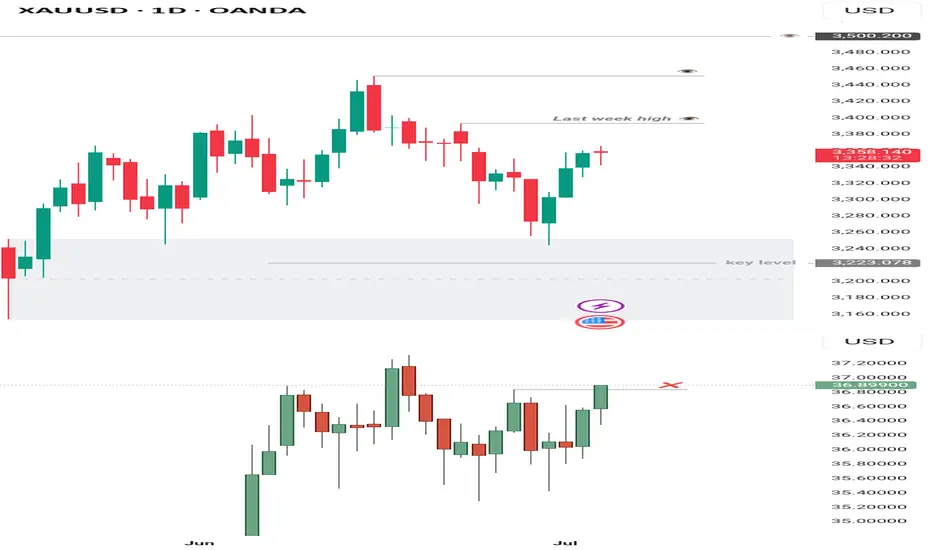
Gold Analysis – Daily Outlook
I initially anticipated a deeper move toward 3225 — the 25–30% retracement zone of the discount array — but price bounced quickly during Monday’s open, then confirmed a market structure shift by breaking above 3350. However, the buy signal wasn’t convincing at the time, as Silver lagged and leaned bearish.
Following the latest 4H chart, Silver has now invalidated the short idea by trading above 36.83, which offers stronger confirmation for the bullish bias — far clearer than what was seen on Monday.
Retracement might occur around last week’s high at 3394, offering a possible discount re-entry point before further upside. Still, price could head straight toward ATH, so keeping 3394 in view remains wise.
EURCHF 02/07/2025Weekly:
-Inverse H&S pattern.
-Previous week low liquidity sweep.
-Expecting a bullish reaction.
Daily:
-Bullish M pattern.
-Liquidity sweep.
-Daily lows.
4H:
-Inverse H&S pattern.
-Double bottom.
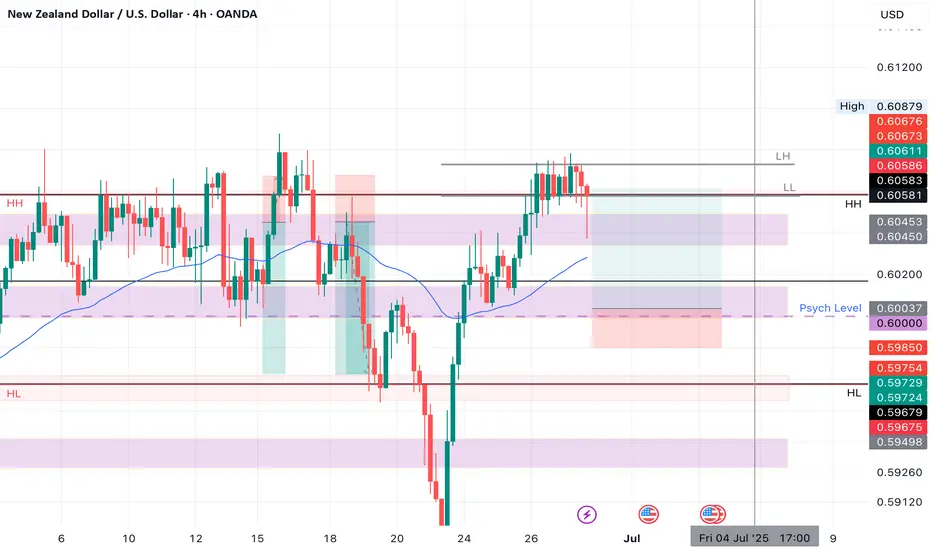
NZDUSD LONG Market structure bullish on HTFs DW
Entry at both Daily and Weekly AOi
Weekly Rejection at AOi
Previous Weekly Structure Point
Daily Rejection at AOi
Previous Daily Structure Point
Around Psychological Level 0.60000
H4 Candlestick rejection
Levels 3.07
Entry 95%
REMEMBER : Trading is a Game Of Probability
: Manage Your Risk
: Be Patient
: Every Moment Is Unique
: Rinse, Wash, Repeat!
: Christ is King.
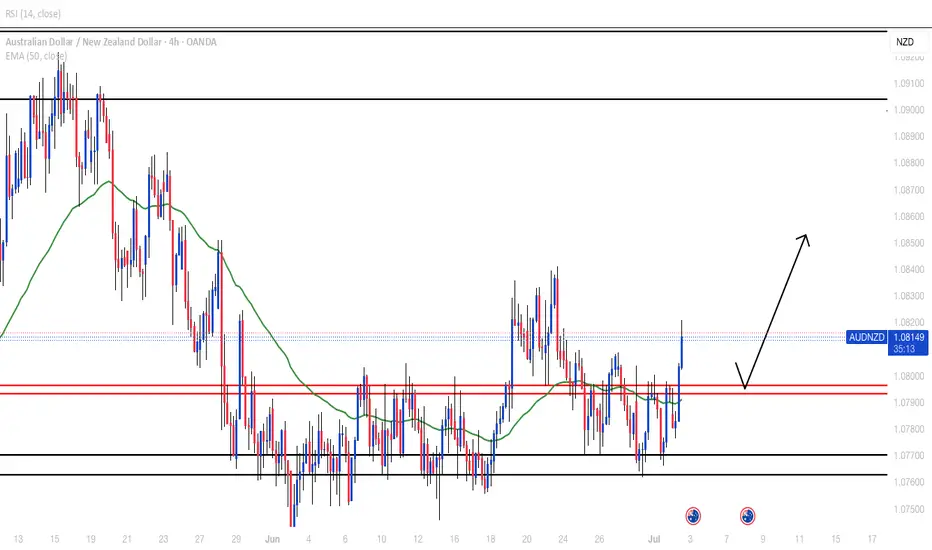
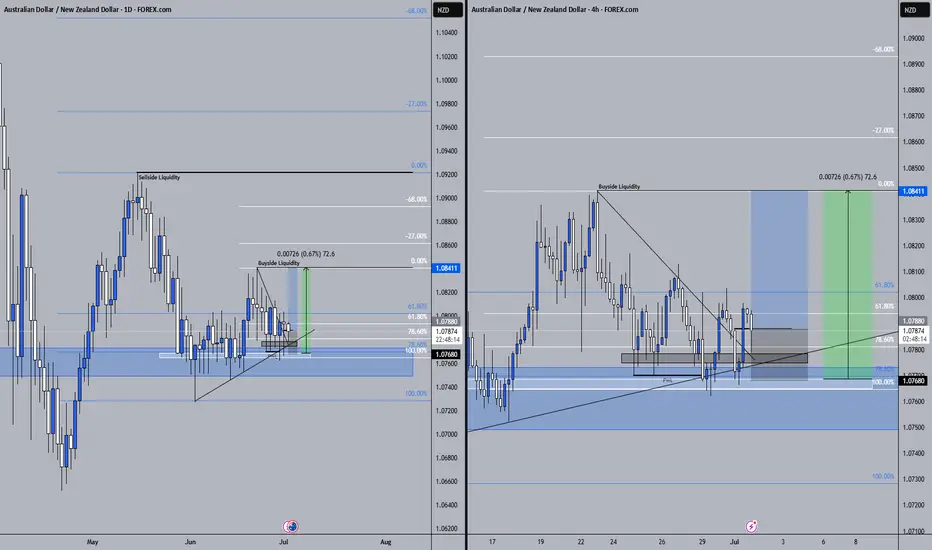
AUDNZDH4 double bottom off the daily support. Looking for longs only if price retests the neckline and gives bullish signals
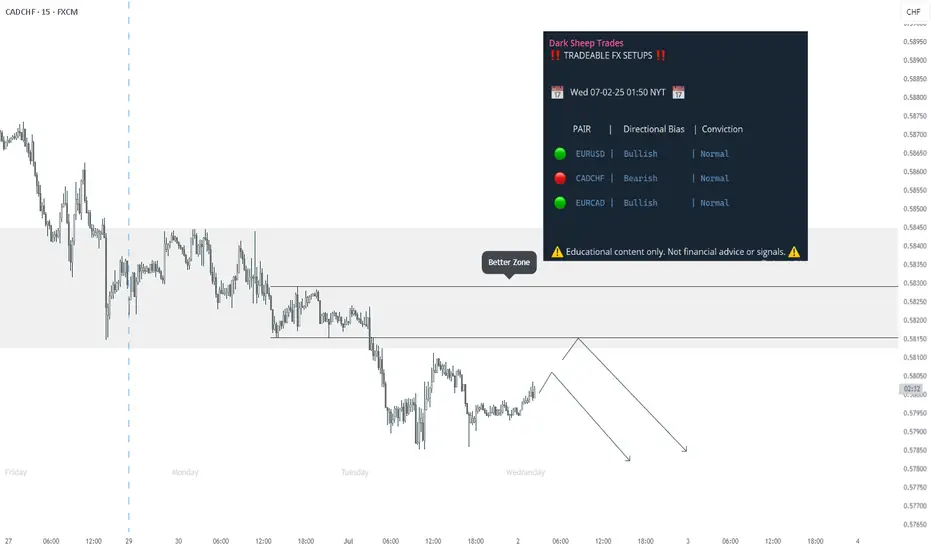
CADCHF - BEARISH - QUANT-LEVEL FX LISTDaily: Downtrend
H4: Downtrend
H1: Downtrend
m15: Downtrend
Risk of Entering Now: Better Zone a little higher
Target at least previous day low
tg@darksheeptrades
EURUSD Long, 02 JulyAsia Fill Trade
Despite being inside a Daily Bearish OB, this trade is purely an Asia fill setup, so HTF bias is not heavily weighted here.
We had clear 1m BOS and retrace into the 1m OB, right inside a 15m Decisional POI, backed by inverted hammer rejections on both EU and DXY.
📉 Entry: 1m OB after BOS
📊 Confluence: DXY reacting from 15m POI + Asia
🎯 TP: Asia Low (1:3 RR)
🛡️ BE: 1.5RR or LTF BOS continuation
Clean execution based on intraday logic & structure, with correlation as additional confidence.
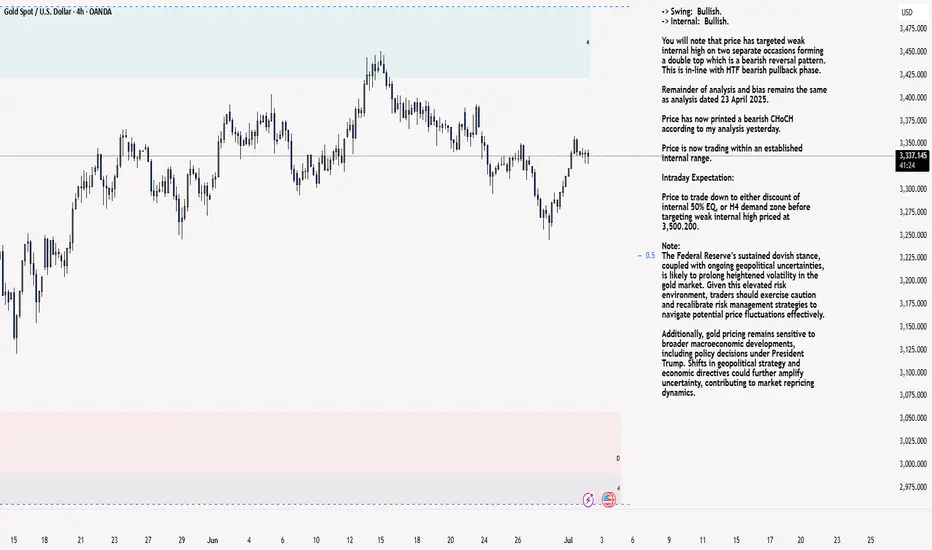
XAU/USD 02 July 2025 Intraday AnalysisH4 Analysis:
-> Swing: Bullish.
-> Internal: Bullish.
You will note that price has targeted weak internal high on two separate occasions forming a double top which is a bearish reversal pattern. This is in-line with HTF bearish pullback phase.
Remainder of analysis and bias remains the same as analysis dated 23 April 2025.
Price has now printed a bearish CHoCH according to my analysis yesterday.
Price is now trading within an established internal range.
Intraday Expectation:
Price to trade down to either discount of internal 50% EQ, or H4 demand zone before targeting weak internal high priced at 3,500.200.
Note:
The Federal Reserve’s sustained dovish stance, coupled with ongoing geopolitical uncertainties, is likely to prolong heightened volatility in the gold market. Given this elevated risk environment, traders should exercise caution and recalibrate risk management strategies to navigate potential price fluctuations effectively.
Additionally, gold pricing remains sensitive to broader macroeconomic developments, including policy decisions under President Trump. Shifts in geopolitical strategy and economic directives could further amplify uncertainty, contributing to market repricing dynamics.
H4 Chart:
M15 Analysis:
-> Swing: Bullish.
-> Internal: Bullish.
H4 Timeframe - Price has failed to target weak internal high, therefore, it would not be unrealistic if price printed a bearish iBOS.
The remainder of my analysis shall remain the same as analysis dated 13 June 2025, apart from target price.
As per my analysis dated 22 May 2025 whereby I mentioned price can be seen to be reacting at discount of 50% EQ on H4 timeframe, therefore, it is a viable alternative that price could potentially print a bullish iBOS on M15 timeframe despite internal structure being bearish.
Price has printed a bullish iBOS followed by a bearish CHoCH, which indicates, but does not confirm, bearish pullback phase initiation. I will however continue to monitor, with respect to depth of pullback.
Intraday Expectation:
Price to continue bearish, react at either M15 supply zone, or discount of 50% internal EQ before targeting weak internal high priced at 3,451.375.
Note:
Gold remains highly volatile amid the Federal Reserve's continued dovish stance, persistent and escalating geopolitical uncertainties. Traders should implement robust risk management strategies and remain vigilant, as price swings may become more pronounced in this elevated volatility environment.
Additionally, President Trump’s recent tariff announcements are expected to further amplify market turbulence, potentially triggering sharp price fluctuations and whipsaws.
M15 Chart:
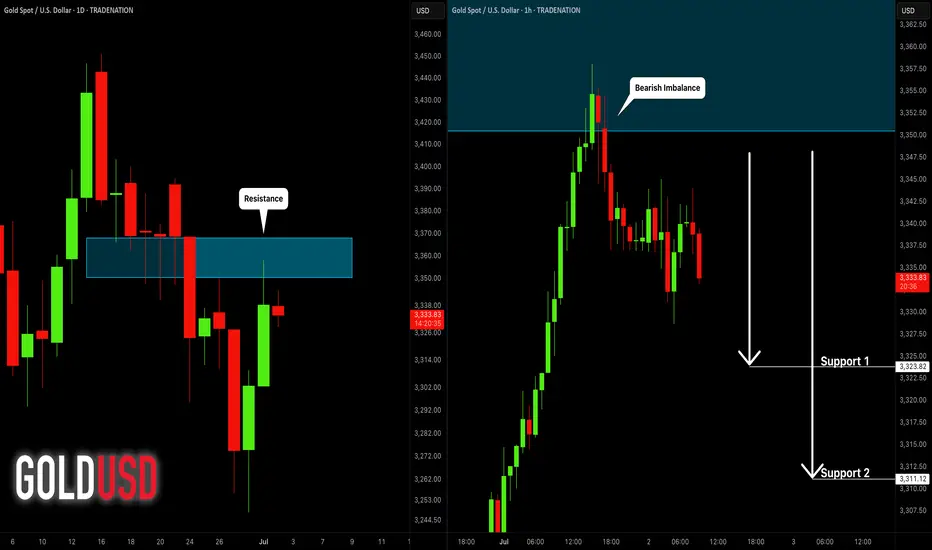
GOLD (XAUUSD): Bearish Move From Resistance
Gold went overbought after a test of a key daily resistance cluster.
A formation of multiple bearish imbalance candles on an hourly time frame
signifies a local dominance of the sellers.
The price will continue retracing at least to 3323 support.
❤️Please, support my work with like, thank you!❤️
I am part of Trade Nation's Influencer program and receive a monthly fee for using their TradingView charts in my analysis.
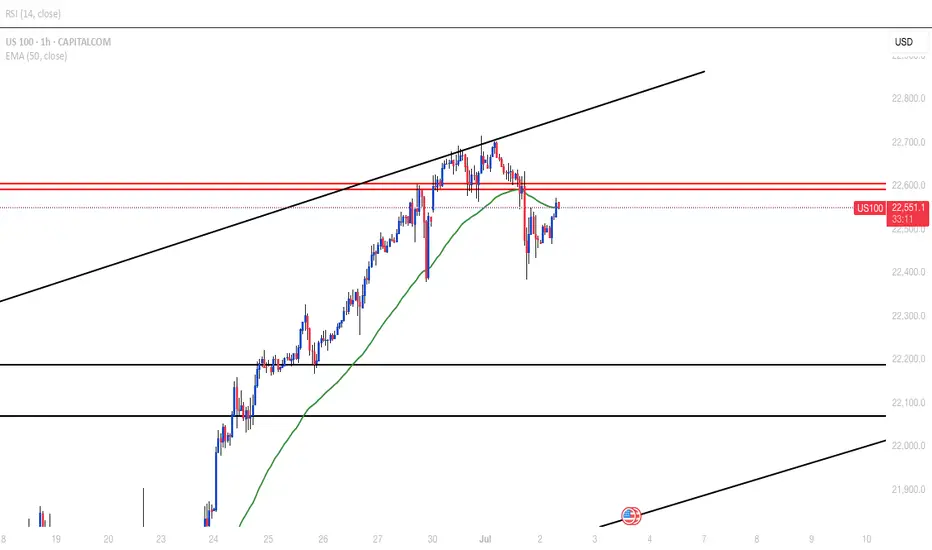
US100Price broke daily resistance last week and now looks like a retracement is on the way. H4 gave a double top at the rising channel resistance. Pulling back to retest the neckline. target is 22,200.
AUDNZD 01/07/2025Weekly:
-Inverse H&S pattern.
-Previous week low liquidity sweep.
Daily:
-Inverse H&S pattern.
-Bullish M pattern.
4H:
-Inverse H&S pattern.
-IC.
TradingView
USDJPY| - Weekky OutlookBias: Bullish
HTF Overview (4H):
Price has shown bullish intent by breaching a major internal high and taking out significant sell-side liquidity (SSL) before mitigating the 4H order block below. This suggests a bullish narrative is forming, even though the 4H swing high hasn’t been taken yet.
LTF Confirmation (30M):
Currently showing bearish momentum. I’ll wait for a clean CHoCH to confirm shift in intent. Once price sweeps liquidity and mitigates a valid 30M OB, I’ll look for entries.
Entry Zone:
After liquidity sweep + OB mitigation on 30M (or refinement on 5M), I’ll execute the setup.
Targets:
• Scalp: 5M structure highs
• Short-Term Hold: 30M structure highs
• Extended Hold: 4H structure highs (if price action is strong)
Mindset Note:
Structure tells the story, but price action confirms whether it’s worth riding. Even when structure looks awkward, respect is often still given—so stay fluid, but focused.
Bless Trading!
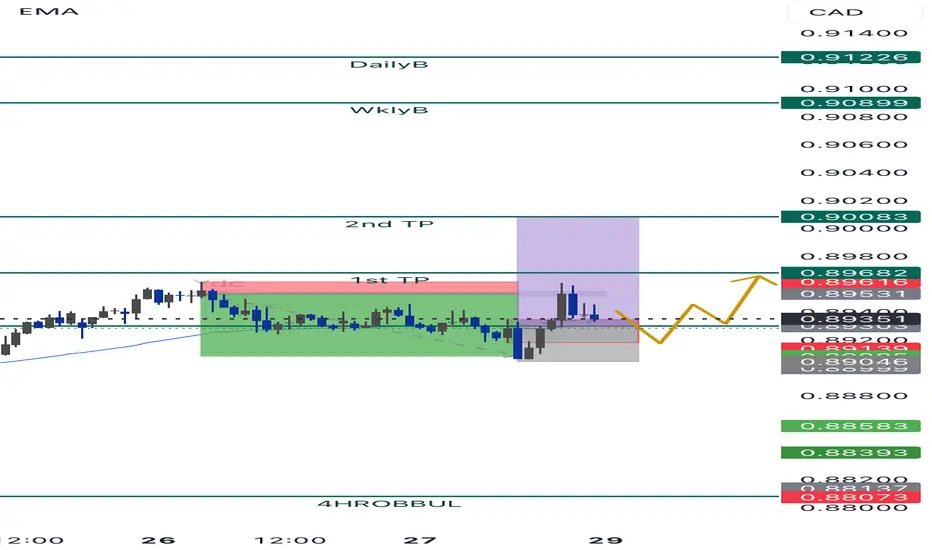
AUDCAD Bullish week AUDCAD Bullish Confluence Analysis:
1. Daily Timeframe: Bullish daily candle closed after sweeping the previous day’s sell-side liquidity — indicating a strong rejection and potential shift in momentum.
2. 4H Structure: Price closed decisively above the key support/resistance level at 0.89300, confirming a break and potential continuation.
3. Daily Imbalance: A breakaway fair value gap (FVG) remains unfilled, with buyers showing strong intent by driving price higher — suggesting bullish pressure is still active.
4. Intraday Confirmation: Both 1H and 15M charts show breaker blocks and fair value gaps being filled, aligning with bullish targets and providing refined 15 min entry zone.