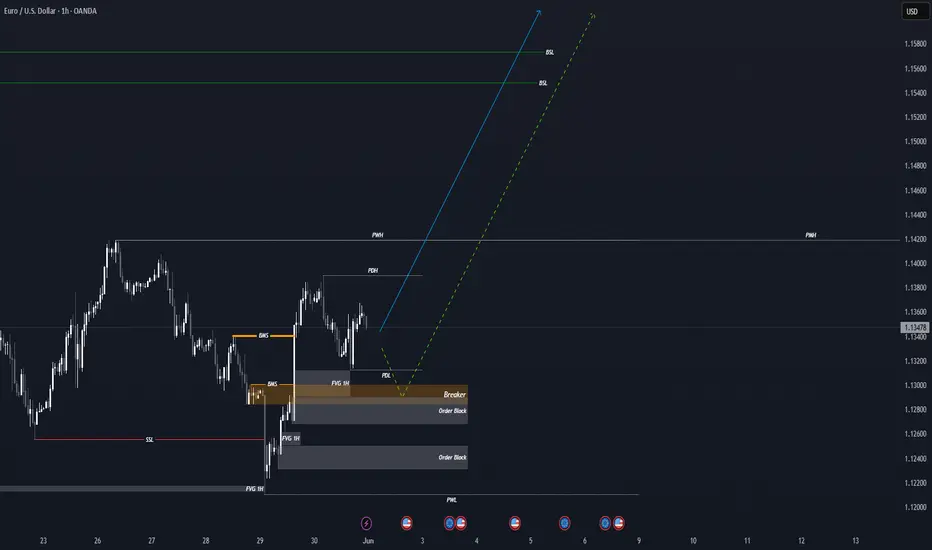
EURUSD – A Potentially Busy Day Ahead For TradersThis morning, EURUSD recorded a near 4 year high at 1.1807, the beneficiary of improving risk sentiment, uncertainty about the ECB’s next interest rate move, and concerns about what President Trump’s tax cut bill, that is progressing through the Senate currently, could mean for the sustainability of the US debt burden moving forward.
Now, with the FX quarter end rebalancing completed yesterday, it is possible to look forward to the upcoming scheduled events for today that could influence where EURUSD moves next.
First up, at 1000 BST this morning, traders receive the latest preliminary inflation (HICP) update for the Eurozone. The outcome of this release could provide further insight into whether the current market expectation for one more ECB rate cut in 2025 is possible, or if they may be on hold for the foreseeable future.
Next up, starting at 1430 BST is a panel discussion attended by ECB President Lagarde, Fed Chairman Powell, BoE Governor Bailey and BoJ Governor Ueda at the ECB’s Central Bank Forum in Portugal. The topic, “adapting to change: macroeconomic shifts and policy responses”. The comments of these central bank heads on inflation, interest rates, tariffs and economic growth could be important for the direction of all the major G7 FX pairs.
Then, at 1500 BST the ISM Manufacturing PMI survey is due for release. While US manufacturing activity is still expected to languish in contraction territory, below 50, traders will be focused on whether there has been any improvement in the headline print, and what the prices paid component could indicate for the direction of US inflation across the remainder of 2025.
These events, when taken with real time updates from President Trump and members of this administration on his tax bill, trade deals and flexibility of the July 9th tariff deadline, sets today up as a potentially volatile period for EURUSD trading.
Technical Update: Assessing the Recent Trend
From a technical perspective, a positive pattern of higher highs and higher lows remains in the EURUSD price and as the chart below shows, Tuesday has seen another new recovery high posted at 1.1807.
While much will continue to depend on market sentiment and price trends, it might be argued that the posting of this new price high for the current upside move, suggests a further phase of strength is still possible.
However, what are the levels traders may now be watching to gauge where the next directional price risks might lay over coming sessions?
Potential Support Levels:
Since posting the June 19th session low at 1.1446, EURUSD has rallied by over 3.00% (1.1446 to 1.1807) and while this doesn’t mean price weakness is necessarily on the cards, traders might become concerned a price correction is due after such a strong advance.
As the chart above shows, the 38.2% Fibonacci retracement of latest price strength, currently stands at 1.1668. This can mark a potential first support focus, after the recent move higher.
Closing breaks under 1.1668, while not a guarantee of further price declines, may then lead to a deeper phase of weakness towards 1.1583, which is equal to the 61.8% retracement level.
Potential Resistance Levels:
As a result of latest strength, EURUSD has traded to levels last seen in mid-September 2021 and to gauge the next potential resistance levels, we switch to the longer term weekly chart shown below.
If further price strength still emerges from current levels, traders may now be focused on 1.1909, the August 2021 failure high, as the next possible resistance level.
The material provided here has not been prepared accordance with legal requirements designed to promote the independence of investment research and as such is considered to be a marketing communication. Whilst it is not subject to any prohibition on dealing ahead of the dissemination of investment research, we will not seek to take any advantage before providing it to our clients.
Pepperstone doesn’t represent that the material provided here is accurate, current or complete, and therefore shouldn’t be relied upon as such. The information, whether from a third party or not, isn’t to be considered as a recommendation; or an offer to buy or sell; or the solicitation of an offer to buy or sell any security, financial product or instrument; or to participate in any particular trading strategy. It does not take into account readers’ financial situation or investment objectives. We advise any readers of this content to seek their own advice. Without the approval of Pepperstone, reproduction or redistribution of this information isn’t permitted.
Multiple Time Frame Analysis

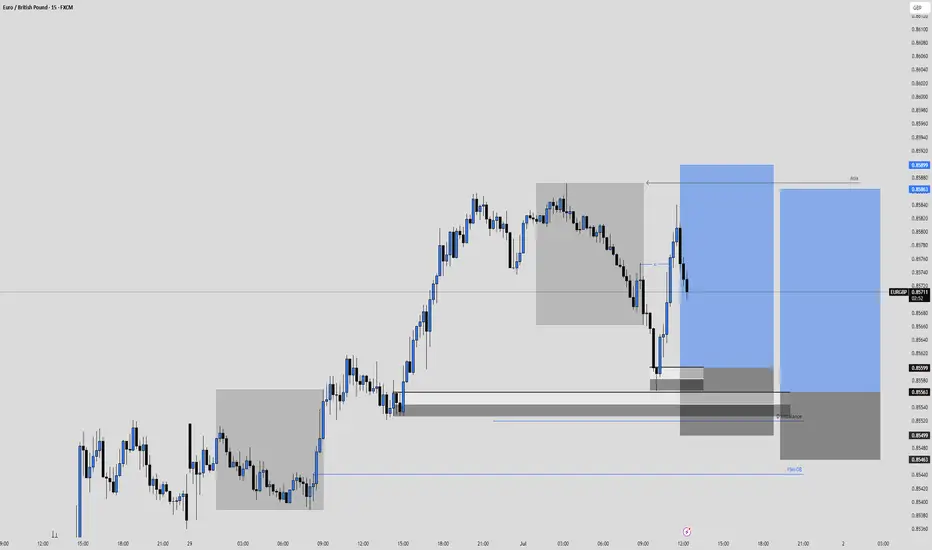
EURGBP sell, July 01HTF shows strong bullish trend, with price barely missing the Daily imbalance — signaling strong buyer momentum and no clear reversal point nearby.
On LTF, we had a clean 15m BOS, confirming bullish continuation, and price reacted from a 15m POI with imbalance left behind.
First entry missed by 1 pip, but it’s still in play — second entry aligns with the same narrative.
📍Entry: 15m imbalance
🧠 BOS in our favor, valid setup if triggered before London close
🎯 TP: Asia high for 1:3 RR
📉 Risk: 0.5% on each position
Looking to continue the upside trend, staying patient and letting price come to us.
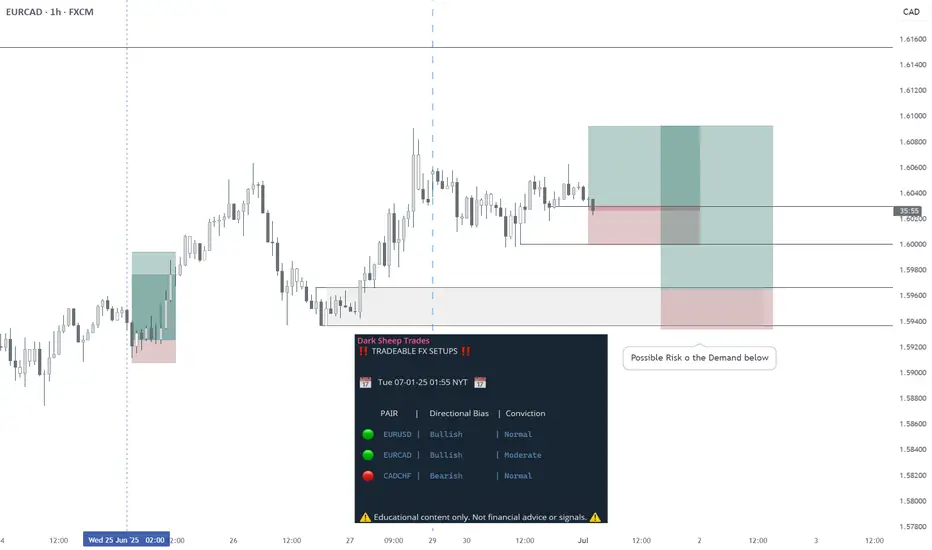
EURCAD - LONG - Statistically-backed FX shortlistEURCAD - LONG
Daily Outlook: Statistically-backed FX shortlist
@darksheeptrades
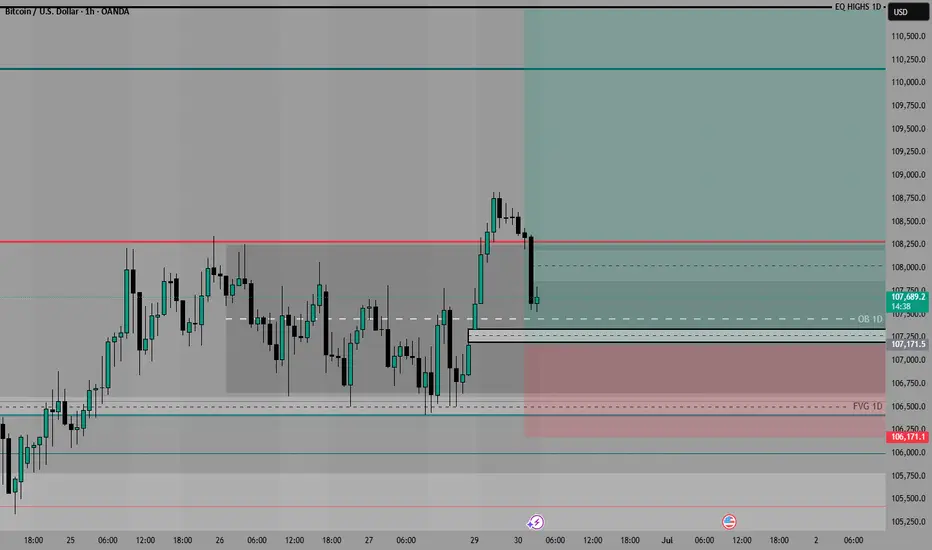
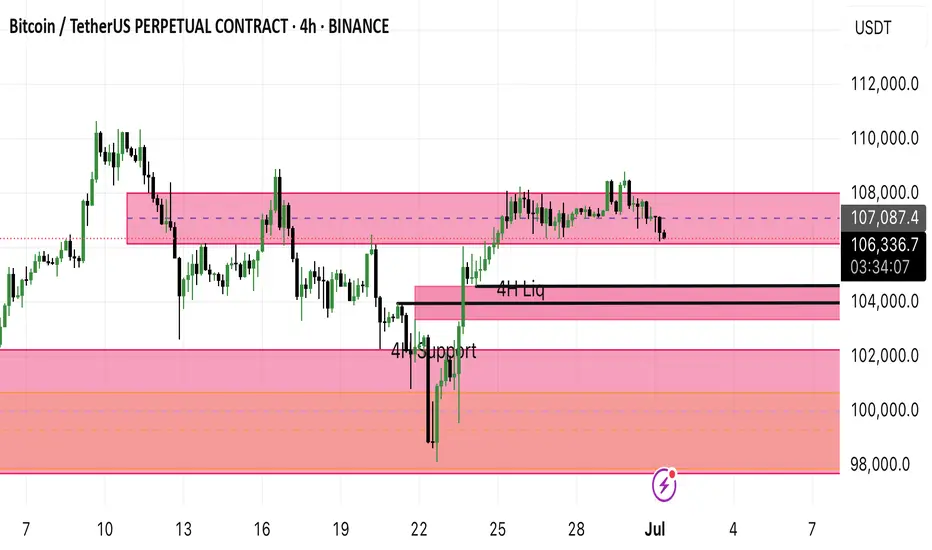
BTC/USDT – 4H Liquidity Sweep Likely Before Bullish ReactionBitcoin is showing signs of distribution within a daily FVG range. The recent failure to break above 107,000 with strength suggests a sweep of downside liquidity is likely.
🧩 Key Observations:
• Price is still respecting the daily FVG above (imbalance not fully filled).
• A visible liquidity pool is sitting below recent 4H lows near 104,000.
• Confluence with 4H support zone and lower daily FVG around 102,000.
🎯 What I Expect:
• Price to sweep 4H liquidity → tag 104K area
• Possible wick or reaction from there
• If momentum increases, price could tap into the deeper imbalance around 102K
📌 Setup Bias:
Short-term bearish (targeting liquidity grab), then reassessing for long setups near support + FVG convergence.
🧠 This setup is built on smart money principles — liquidity engineering, fair value gap fills, and mitigation.
⸻
Key Levels:
• 🔴 Resistance: 107,000–108,000 (Daily FVG top)
• ⚫ Target Zone: 104,000 (Liquidity + 4H support)
• 🟣 Potential Bounce Zone: 102,000 (Lower Daily FVG)
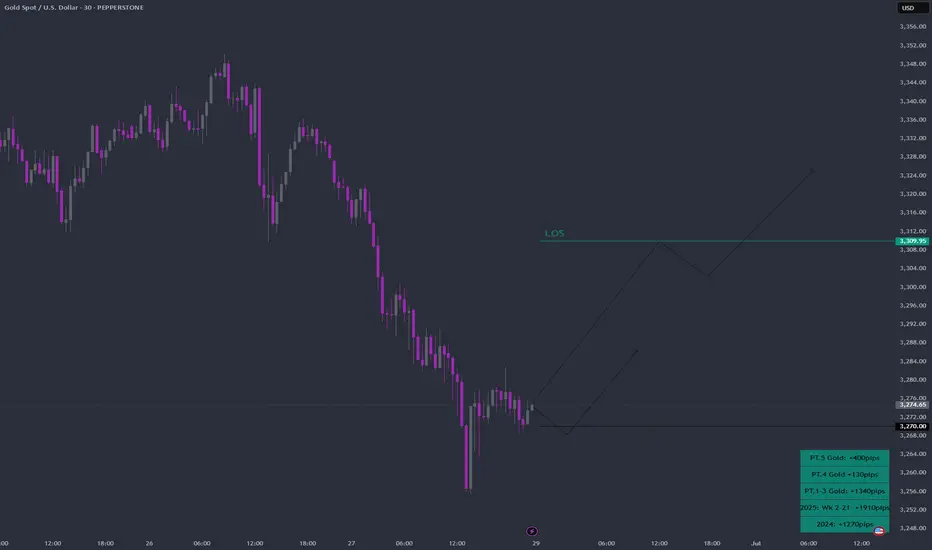
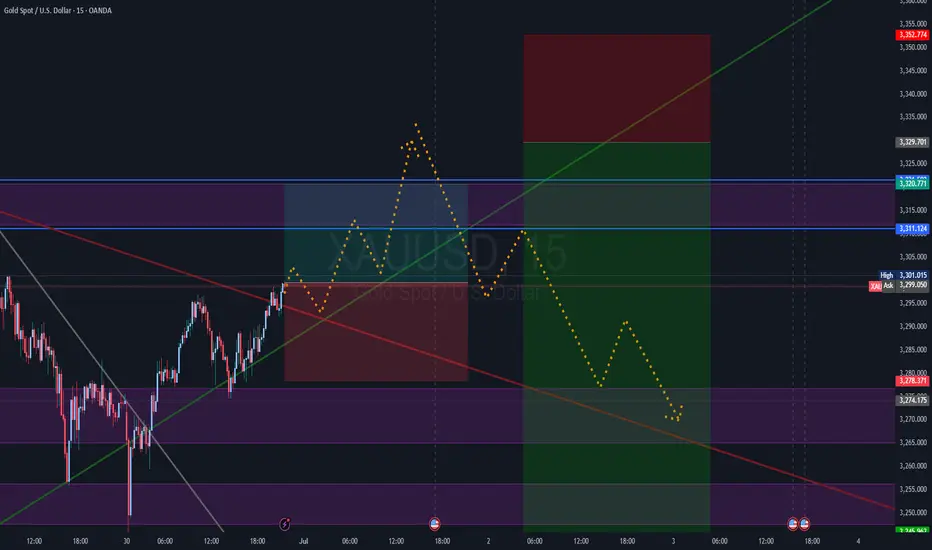
Everybody loves Gold Part 6Great week in Part 5.
Starting this week with a strong bias towards the upside.
Here's a breakdown of trading dynamics:
1. Expecting price to break past green line, level of significance (LOS) for continuation up
2. Price might bounce back for which; will be looking for a continuation from -50/-100 or -150pips to the upside
3. Will be looking for double tops/bottom along the way
As always price action determines trades
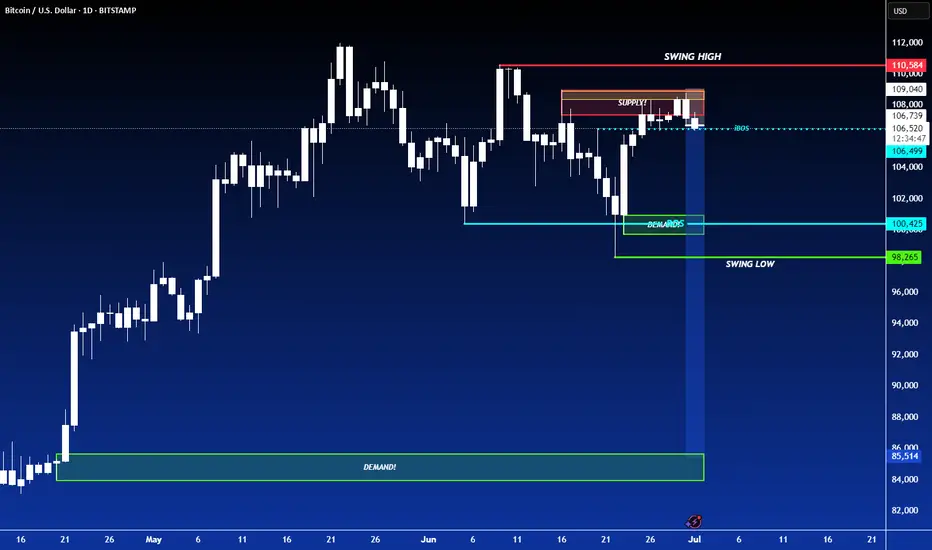
SHORT ON BITCOINBITCOIN has continue to create lower highs at a major resistance zone.
I will be selling bitcoin looking to make over 8000 to 20,000 points.
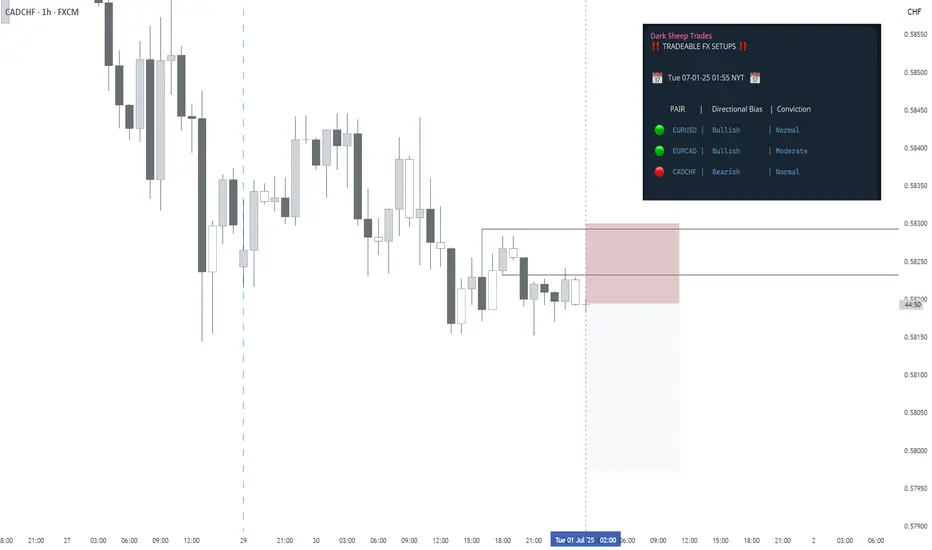
CADCHF - SHORT - Statistically-backed FX shortlistCADCHF - SHORT
Daily Outlook - Statistically-backed FX shortlist
@darksheeptrades
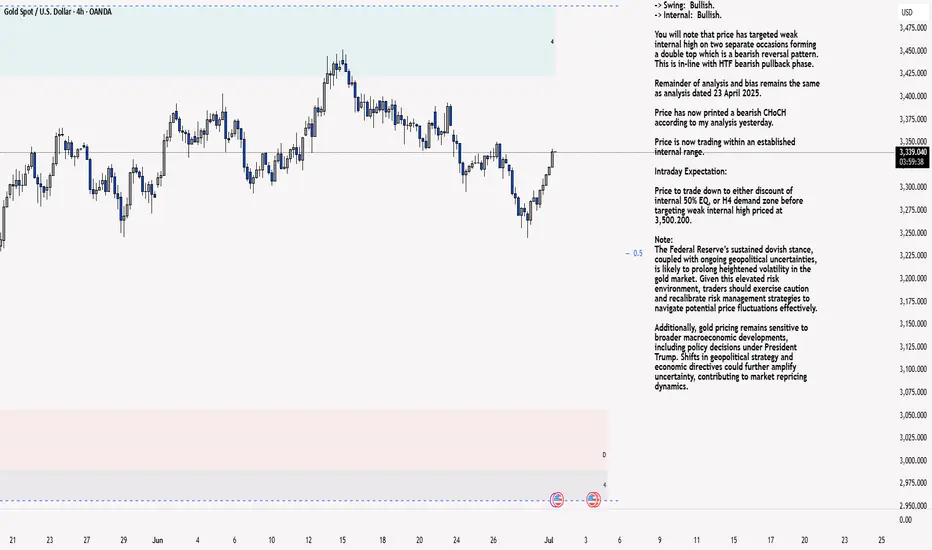
XAU/USD 01 July 2025 Intraday AnalysisH4 Analysis:
-> Swing: Bullish.
-> Internal: Bullish.
You will note that price has targeted weak internal high on two separate occasions forming a double top which is a bearish reversal pattern. This is in-line with HTF bearish pullback phase.
Remainder of analysis and bias remains the same as analysis dated 23 April 2025.
Price has now printed a bearish CHoCH according to my analysis yesterday.
Price is now trading within an established internal range.
Intraday Expectation:
Price to trade down to either discount of internal 50% EQ, or H4 demand zone before targeting weak internal high priced at 3,500.200.
Note:
The Federal Reserve’s sustained dovish stance, coupled with ongoing geopolitical uncertainties, is likely to prolong heightened volatility in the gold market. Given this elevated risk environment, traders should exercise caution and recalibrate risk management strategies to navigate potential price fluctuations effectively.
Additionally, gold pricing remains sensitive to broader macroeconomic developments, including policy decisions under President Trump. Shifts in geopolitical strategy and economic directives could further amplify uncertainty, contributing to market repricing dynamics.
H4 Chart:
M15 Analysis:
-> Swing: Bullish.
-> Internal: Bullish.
H4 Timeframe - Price has failed to target weak internal high, therefore, it would not be unrealistic if price printed a bearish iBOS.
The remainder of my analysis shall remain the same as analysis dated 13 June 2025, apart from target price.
As per my analysis dated 22 May 2025 whereby I mentioned price can be seen to be reacting at discount of 50% EQ on H4 timeframe, therefore, it is a viable alternative that price could potentially print a bullish iBOS on M15 timeframe despite internal structure being bearish.
Price has printed a bullish iBOS followed by a bearish CHoCH, which indicates, but does not confirm, bearish pullback phase initiation. I will however continue to monitor, with respect to depth of pullback.
Intraday Expectation:
Price to continue bearish, react at either M15 supply zone, or discount of 50% internal EQ before targeting weak internal high priced at 3,451.375.
Note:
Gold remains highly volatile amid the Federal Reserve's continued dovish stance, persistent and escalating geopolitical uncertainties. Traders should implement robust risk management strategies and remain vigilant, as price swings may become more pronounced in this elevated volatility environment.
Additionally, President Trump’s recent tariff announcements are expected to further amplify market turbulence, potentially triggering sharp price fluctuations and whipsaws.
M15 Chart:

Skeptic | PEPE : Spot & Futures Triggers for Maximum EdgeWelcome, traders, its Skeptic! Ready to dissect PEPE’s next moves? I’m diving into a pro-level analysis of PEPE, the #30 crypto and 3rd largest meme coin with a $4.08B market cap. This Analysis delivers a comprehensive breakdown—quick facts, 2025 performance, community strength, and technical triggers for spot and futures trading, all rooted in HWC, MWC, LWC cycles. Trade with no FOMO, no hype, just reason. 🙌 Let’s master PEPE! 🚖
Quick Facts
PEPE, an Ethereum-based meme coin launched in April 2023, is inspired by the Pepe the Frog internet meme. With a 420.69 trillion token supply, it features a deflationary burn mechanism and redistribution rewards for long-term holders. Currently trading at $ 0.00000946 , it ranks as the # 30 cryptocurrency and the 3rd largest meme coin behind Dogecoin and Shiba Inu, with a $ 4.08B market cap. Let’s unpack its 2025 performance and technical setup for actionable trades. 📊
2025 Performance & Community
PEPE has faced significant volatility in 2025, down 25.7% year-to-date and 35% this month. Despite this, its community remains robust with 456,000 + holders, and an impressive 37% haven’t sold in over a year , signaling diamond hands and strong belief in the project. This resilience suggests potential for recovery if market sentiment shifts.
Technical Analysis: Cycle-Based Breakdown
From a cycle perspective, Weekly/Monthly timeframes are range-bound, meaning lower timeframes drive most price action and shape near-term opportunities. Let’s break it down:
Daily Timeframe
After a 100% jump from May 6-22, 2025, PEPE retraced nearly the entire move. Momentum is currently bearish on the Daily, but declining volume during this pullback suggests traders view it as a correction rather than a trend reversal. Interest in heavy trading is low, indicating limited momentum for now.
Key Insight: The Daily is bearish but lacks strong selling pressure, hinting at consolidation. Watch for volume spikes to confirm directional moves.
Triggers for Spot Trading
Long Trigger: Break above resistance at $ 0.00001403 , confirmed by a volume surge during the breakout. For extra confirmation, check PEPE/BTC.
If PEPE/BTC breaks its downtrend line, it signals liquidity inflow and potential for strong growth. The primary trigger is a break of 0.0000000001399 on PEPE/BTC, which could spark explosive rallies for PEPE. Use indicators/oscillators (e.g., RSI) for additional confirmation, as PEPE/BTC volume is fake due to it being a ratio.
Key Insight: A PEPE/BTC breakout is a strong bullish signal, but volume confirmation is critical to avoid fake moves.
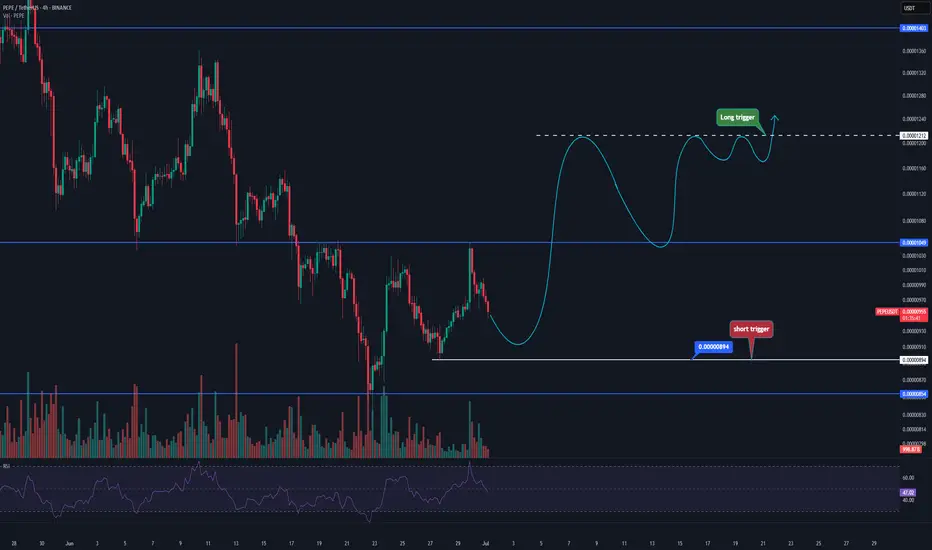
4-Hour Timeframe for Futures Triggers
On the 4-hour chart, PEPE has started an uptrend momentum. Should you go long on a break of resistance at $0.00001049? No —the Daily remains bearish, making the first wave risky. First-wave moves against the Daily often face high volatility and fake breakouts, lowering your win rate. Instead:
Long Trigger: Wait for the second uptrend wave after breaking $0.00001049, forming a range ceiling. Confirm with a volume increase, RSI entering overbought, or other oscillators to avoid fake breakouts or stop-loss hunts.
Short Trigger: Break below support at $ 0.00000894 is a strong short trigger, aligning with the bearish Daily. This setup offers favorable R/R ratios, especially if 4-hour momentum turns bearish. Set alarms for this level to catch the move.
Pro Tip: Shorts are safer due to Daily alignment. For longs, skip the first wave, wait for the second, and use tight risk management to navigate volatility.
Final Vibe Check
This PEPE Analysis arms you with precise triggers for spot and futures trading, leveraging cycle-based strategies. With a range-bound Weekly, focus on Daily and 4-hour for opportunities. Short at $0.00000894 aligns with the trend, while longs need second-wave confirmation above $0.00001049 or a PEPE/BTC breakout at 0.0000000001399. Protect your capital—stick to MAX 1%–2% risk per trade. Want more cycle-based setups or another pair? Drop it in the comments! If this analysis sharpened your edge, hit that boost—it fuels my mission! 😊 Stay disciplined, fam! ✌️
💬 Let’s Talk!
Which PEPE trigger are you watching? Share your thoughts in the comments, and let’s crush it together!
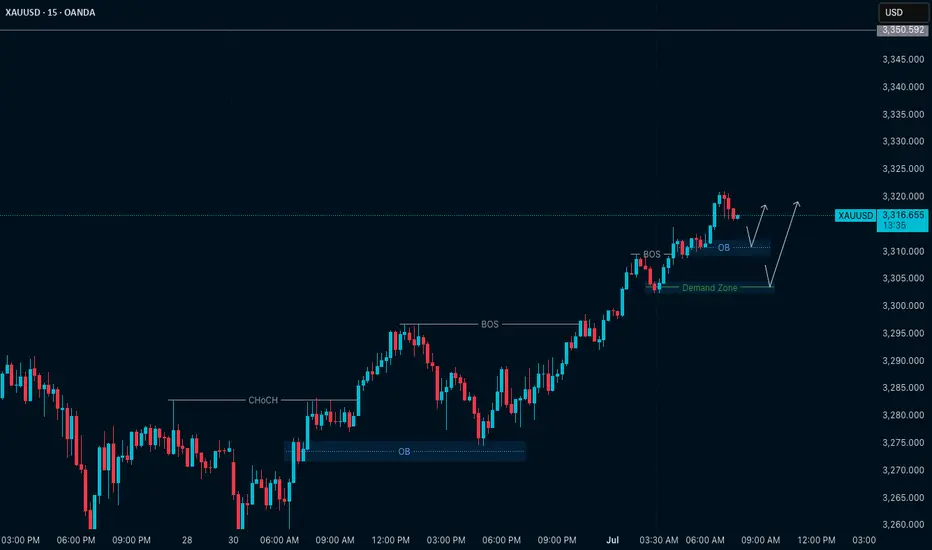
Gold (XAUUSD) – July 1 Analysis📍 H4 Key LH Zone: 3348.500 – 3350.500
This is a major decision zone.
Current market structure:
🔸 M15 is in an uptrend with confirmed ChoCh + BoS
What to watch:
We’re approaching the H4 LH supply zone — now we observe how price behaves here.
🔹 If price breaks above this H4 LH zone:
→ HTF and LTF trends align to the upside
→ Potential continuation of the bullish move
🔹 If price respects and stays below this LH zone:
→ Then this recent up-move could be a pullback
→ We may see a new low forming — so be cautious
📍 M15 Zones for Long Setup (if confirmed):
• 3309.500 – 3312.500 (Order Block Zone)
• 3302.500 – 3304.600 (Demand Zone)
We will watch these levels closely.
If price respects these zones and gives M1 confirmation (ChoCh + BoS) — we’ll plan for long entries accordingly.
📖 Let structure guide your decisions. Let price speak first.
📘 Shared by @ChartIsMirror
Author of The Chart Is The Mirror — a structure-first, mindset-grounded book for traders
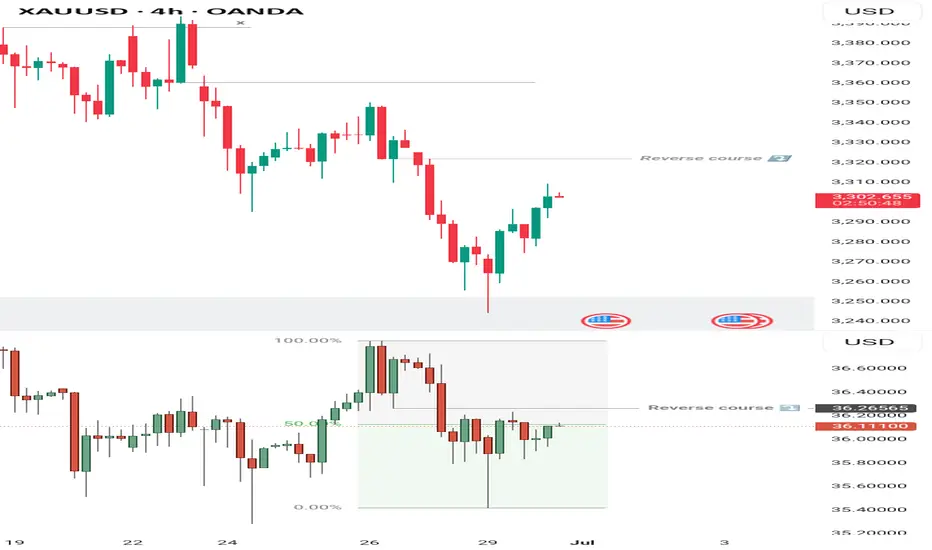
Gold (XAUUSD) 4H Technical Outlook
In line with my previous projection, price dropped from the 3330 region toward the key level around 3224, bottoming out at 3245 after sweeping liquidity—forming what now appears to be a potential double bottom.
However, the rally from 3245 looks more like a liquidity build-up than a true reversal. This suspicion is strengthened by Silver’s behavior, as it failed to confirm any bullish structure shift last week and isn’t participating in the rally as expected.
Currently, Silver is trading back into a premium zone around 36.27. With that in view, it would be ideal for Gold to revisit the 3322 region, offering a cleaner and more logical sell opportunity with defined risk. That said, overnight volatility during the Asian session could still lead to unexpected movements and early reversals.
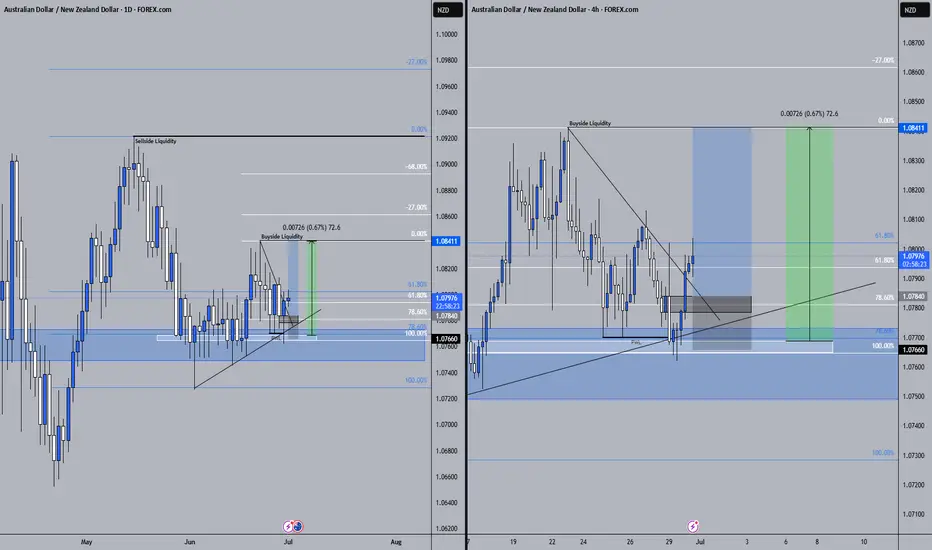
AUDNZD 30/06/2025Weekly:
-Inverse H&S pattern.
-Previous week low liquidity sweep.
Daily:
-Inverse H&S pattern.
-Bullish M pattern.
4H:
-Inverse H&S pattern.
-IC.
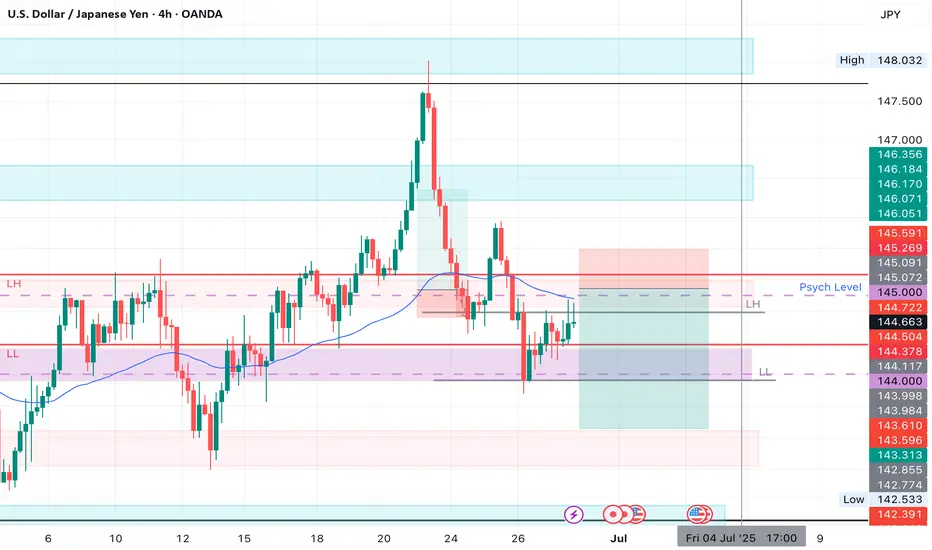
USDJPY SHORT Market structure bearish on HTFs 3
Entry at Daily AOi
Weekly Rejection at AOi
Daily Rejection at AOi
Daily EMA retest
Previous Structure point Daily
Around Psychological Level 145.000
H4 EMA retest
H4 Candlestick rejection
H4 Head and Shoulder Pattern, Retest of the neckline
Levels 3.56
Entry 95%
DUE TO H4 I WILL BE GOING 1/2 A % RISK TO SEE IF MY EDGE WILL WORK
REMEMBER : Trading is a Game Of Probability
: Manage Your Risk
: Be Patient
: Every Moment Is Unique
: Rinse, Wash, Repeat!
: Christ is King.
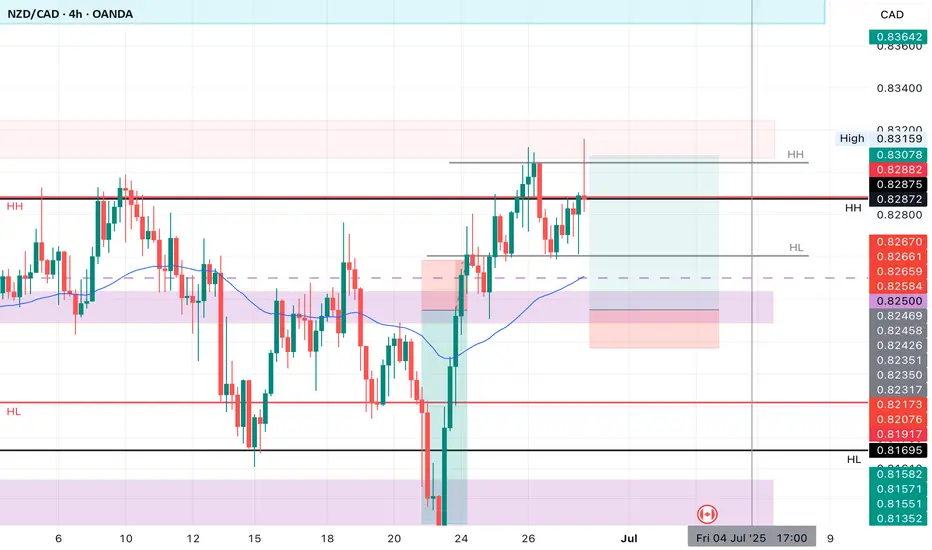
NZDCAD LONGMarket structure bullish on HTFs DW
Entry at Daily and Weekly AOi
Weekly Rejection at AOi
Weekly EMA retest
Previous Weekly Structure Point
Daily Rejection At AOi
Previous Daily Structure Point
Around Psychological Level 0.82500
H4 Candlestick rejection
Levels 4.08
Entry 105%
REMEMBER : Trading is a Game Of Probability
: Manage Your Risk
: Be Patient
: Every Moment Is Unique
: Rinse, Wash, Repeat!
: Christ is King.
COST Daily Chart Analysis: Key Levels, and Price StructureCostco Wholesale Corporation (COST)
Historical Context and Trend Channel:
From September 2024 through early 2025, COST was observed trading within a well-defined upward channel (indicated by the grey shaded areas). This channel represented a consistent bullish trend during that period. However, the price subsequently broke below the lower boundary of this channel around March 2025, suggesting a shift in the established trend.
Key Price Levels Identified:
Strong Support Level (870 to 880): Marked by the light blue shaded zone, this level has historically acted as a robust floor for the price, demonstrating strong buying interest on multiple occasions.
Good Level (930 to 940): The orange shaded area indicates an intermediate support zone. Should the immediate support fail, this level could come into play as the next area of interest for potential buyers.
1st Support (970 to 980): This green shaded area represents the most immediate support level based on recent price action. The price has recently found support within this range.
Key Resistance (1010): The horizontal red line with circled points highlights a critical overhead resistance level. This level has seen prior rejections, making it a significant hurdle for any sustained upward movement. It also appears to act as a potential "neckline" for current price formations.
Target (1060 to 1070): The red shaded zone at the top represents a significant resistance area and a prior peak. If the "Key Resistance -1010" is overcome, this zone could become the next potential target.
Recent Price Action and Pattern Observations:
Following the break from the long-term uptrend channel, COST rallied to form a peak around the "Target 1060 to 1070" zone in May. The subsequent decline from this peak, followed by a bounce and another attempt at the "Key Resistance -1010" level, suggests the formation of a potential "M" top or double top pattern if 1010 holds. More recently, the price has pulled back to test the "1st Support 970 to 980" zone. The current price action around 988.07 indicates that COST is trading between this immediate support and the "Key Resistance -1010" level. The chart illustrates two potential paths (dotted blue lines):
1. A move upward, challenging and potentially breaking above the "Key Resistance -1010" to target the 1060-1070 zone. This would align with a potential bullish "W" pattern formation if the 1st support holds.
2. A decline to retest the "Good Level 930 to 940" before a potential rebound.
The "Key Resistance -1010" level remains pivotal. A sustained break above it could signal further upside, while rejection from this level could lead to a retest of lower support zones.
Disclaimer:
The information provided in this chart is for educational and informational purposes only and should not be considered as investment advice. Trading and investing involve substantial risk and are not suitable for every investor. You should carefully consider your financial situation and consult with a financial advisor before making any investment decisions. The creator of this chart does not guarantee any specific outcome or profit and is not responsible for any losses incurred as a result of using this information. Past performance is not indicative of future results. Use this information at your own risk. This chart has been created for my own improvement in Trading and Investment Analysis. Please do your own analysis before any investments.

AUDCAD Bulls update! Price is now approaching our first take profit (TP#1) at respected resistance level. I'm anticipating a small pullback from this area, followed by a potential continuation above the 0.89700 level.

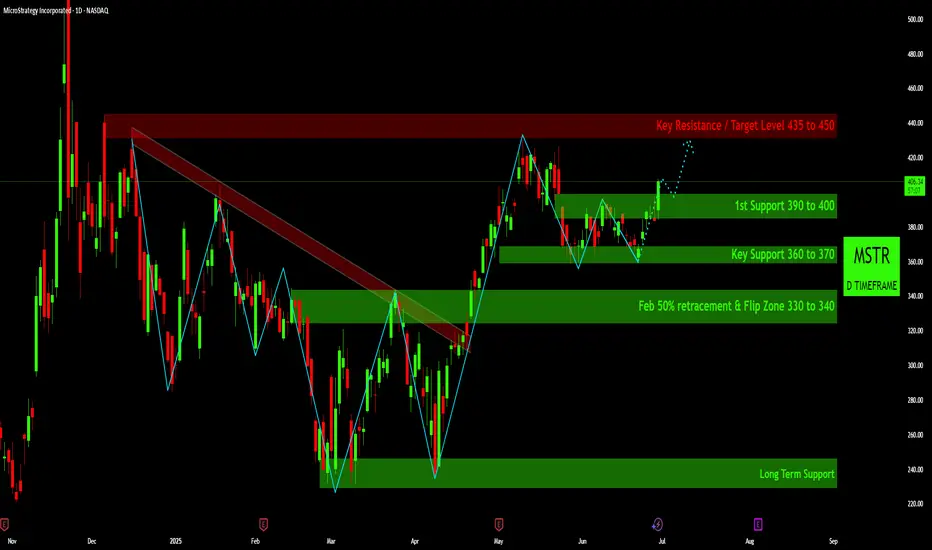
MSTR Daily Chart Analysis: Key Price LevelsThis analysis focuses on the daily chart of MicroStrategy (MSTR), highlighting significant price action, identified patterns, and predefined support and resistance levels.
Price Action Overview:
Starting from late 2024/early 2025, MSTR experienced a notable downtrend, characterized by a series of lower highs and lower lows, leading to a test of the "Strong Support" zone, illustrated by the grey shaded area around the 230-240 price level.
Following this decline, the chart illustrates a distinct "W" pattern formation, often interpreted as a potential bullish reversal signal. This pattern culminated in a decisive breakout above the overhead descending trendline (marked in red), indicating a shift in market structure from downtrend to a more bullish posture.
Post-breakout, the price saw a strong upward move into May. A subsequent pullback found significant support within the "Key Support 360 to 370" zone, which appears to have acted as a crucial pivot point, preventing further decline. More recently, the price has consolidated and is current
ly trading above the "1st Support 390 to 400" area.
Key Levels Identified:
Key Resistance / Target Level (435 to 450): The red shaded area at the top represents a significant overhead resistance zone. This level aligns with a previous peak and is identified as a potential target if the current upward momentum continues.
1st Support (390 to 400): This green shaded area serves as the immediate support level. The price has recently traded above this zone, suggesting it has transitioned into a new support area after potentially acting as resistance previously. Sustaining price action above this level would be a key observation.
Key Support (360 to 370): Located below the first support, this green zone has demonstrated its importance in recent price action, coinciding with the lows seen in June, where buyers stepped in.
Feb 50% Retracement & Flip Zone (330 to 340): This lower green shaded area represents a significant structural level, identified as a potential 50% Fibonacci retracement level from a previous move and a historical "flip zone" where price action shifted between support and resistance.
Strong Support (approx. 230-240): The grey shaded box at the bottom indicates a strong historical support level, representing the lowest point observed within this timeframe, acting as a critical long-term floor.
Current Observations:
The current price of 405.09 indicates MSTR is trading above its immediate "1st Support 390 to 400" zone. The dotted blue line on the chart illustrates a hypothetical continuation of the current upward momentum, projecting a potential move towards the "Key Resistance / Target Level 435 to 450."
Disclaimer:
The information provided in this chart is for educational and informational purposes only and should not be considered as investment advice. Trading and investing involve substantial risk and are not suitable for every investor. You should carefully consider your financial situation and consult with a financial advisor before making any investment decisions. The creator of this chart does not guarantee any specific outcome or profit and is not responsible for any losses incurred as a result of using this information. Past performance is not indicative of future results. Use this information at your own risk. This chart has been created for my own improvement in Trading and Investment Analysis. Please do your own analysis before any investments.
A potential scenario,- let`S see how it unfolds.Strong short term bullish movement. Strong area of resistance . Expect to see a SELL candle for the next month. Looking to take the upper 3295-3315 liquidity, before hunting the 3230 -3210 area.
Preponderance of (or Preposterous?) Evidence
I was just proposing yesterday staying neutral in SPY (the S&P 500 ETF). The FOMC meeting today (Jun 18th) was a big-nothing burger (so far), which supports my (non)position, but we'll see. I will update that post when the time is right (ATH, 200dma, or bust).
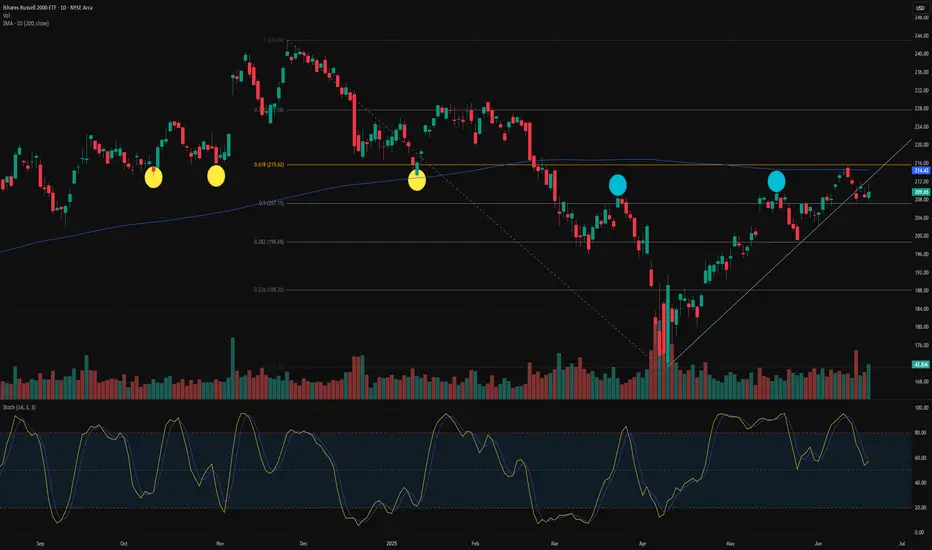
Today, though, the IWM (the Russell 2000 Small Cap Index ETF) and, surprisingly, a potential short position.
First, the IWM (see below) is overbought on a weekly chart, with the Stochastics being above 80 (more on Stochastics and weekly charts at a later date). For now, let's go with IWM being a little overbought, in the longer-term view.
Now, let's switch to the big daily chart at the top and look at the evidence for going short;
- IWM never really got above it's 200-day moving average (purple line),
- That same level was consistent with a lot of resistance ~213 (yellow circles),
- IWM has trailed this whole rally.
- It has broken and somewhat retested a trendline (light blue) from this most recent rally,
- It bounced off it's 61.8% Fibonacci level (orange line, not my favorite indicator for ETFs, but I often sneak a peek),
- It's at its previous resistance high around 209 (blue circles).
On the not-bearish side;
- The daily chart is less overbought (this has to happen on weakness, though),
- There's (a little) support at 199 but not really again until 172,
- I still feel like the All-Time-High (ATH) is a magnet for the S&P (but IWM has trailed).
That's (a lot) more (and better) points for being bearish.
I'll go short (via a ~90 day ITM put position*) if IWM breaks below 207.50, between that and 202. If it opens lower than 202, I'll wait for a pull-up.
The stop will be a close above the 200 day.
The target is 172 (the previous tariff low), but I will lighten/tighten up (by selling OTM puts* and/or moving stop down) as IWM drops (if it drops).
It may seem a bit duplicitous to be neutral on SPY while being bearish on IWM.
But sometimes you have to go with the Preponderance of Evidence (or will it prove Preposterous Evidence?)
An update will be coming.
*Sorry for bringing up options. One can just go short IWM. I will explain my option choice one day.
My ideas here on TradingView are for educational purposes only. It is NOT trading advice. I often lose money and you would be a fool to follow me blindly.
EURUSDHello, I hope you have a good day ❤
Please don't forget to support us so that our activities can continue!🚀
The trend of the above times is completely upward and this move is not far from expected.
But since it is the first week of the new month, be sure to observe capital management.
Be profitable💲💎
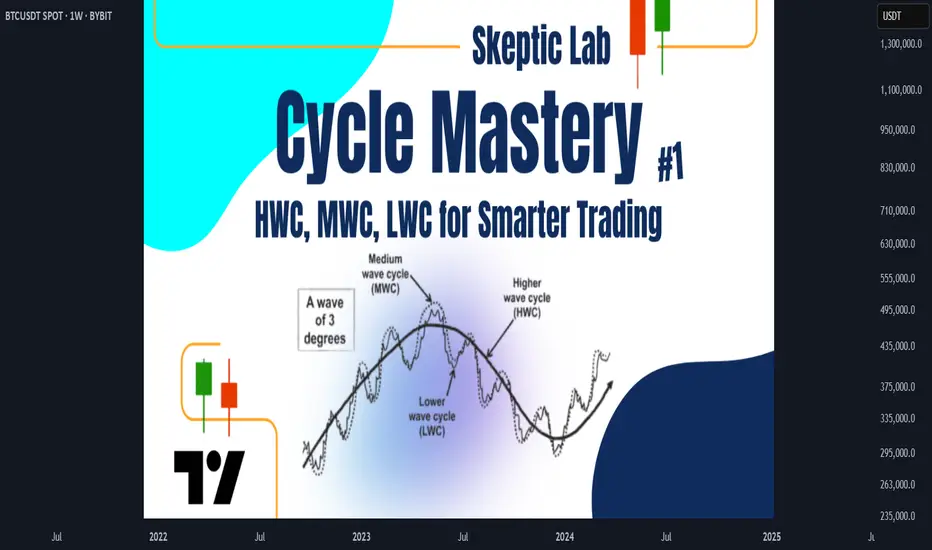
Skeptic| Cycle Mastery Part 1: HWC, MWC, LWC for Smarter TradingUnderstanding Higher Wave Cycle ( HWC ), Minor Wave Cycle ( MWC ), and Low Wave Cycle ( LWC ) is the key to making informed trading decisions, simplifying when to go long , short , or stay out . This Part 1 masterclass introduces these cycles, their relative nature, and how to align them with your strategy for precise entries and effective risk management . Let’s break it down. 📊
The Three Cycles: HWC, MWC, LWC
We trade across three market cycles:
HWC (Higher Wave Cycle) : The big-picture trend, like Bitcoin’s yearly uptrend.
MWC (Minor Wave Cycle): A medium-term trend, often an uptrend or corrective phase within the HWC.
LWC (Low Wave Cycle): The short-term daily trend, which can be range-bound, uptrend, or downtrend.
Knowing these cycles helps you decide when to e nter long, short, or avoid trading altogether, ensuring you align with the market’s rhythm.
Defining Your Cycles: It’s Relative
The main question before diving in: What timeframes are HWC, MWC, and LWC? The answer is relative—it depends on your strategy. Think of it like a temperature scale: 0°C isn’t “no heat” but a reference point (water’s freezing point). Similarly, your cycles are defined by the largest timeframe you analyze:
HWC: Your highest timeframe (e.g., Weekly for long-term traders).
MWC: The next level down (e.g., Daily).
LWC: Your shortest timeframe (e.g., 4-Hour or 1-Hour).
Ask yourself: What’s the largest timeframe I check? Set your HWC there, then scale down for MWC and LWC based on your trading style. This relativity ensures your cycles fit your unique approach.
While shorter cycles (LWC, MWC) form the HWC, the HWC’s power dominates, influencing smaller cycles. Let’s explore how to trade based on these relationships.
Trading Scenarios: When to Act
Scenario 1: HWC Uptrend, MWC Range
When the HWC is in an uptrend and the MWC is range-bound:
Action: Enter a long position on the first MWC wave when the LWC breaks the ceiling of the MWC range (e.g., a box breakout).
Why? The HWC’s bullish power supports the move, likely triggering an MWC uptrend. This makes the first wave a strong, low-risk entry.
Example: If the LWC (e.g., 4-hour) breaks the MWC range ceiling with a strong candle, you can confidently go long, backed by the HWC uptrend.
Scenario 2: HWC Downtrend, MWC Range
When the HWC is in a downtrend and the MWC is range-bound:
Action: Skip the first MWC wave. If the LWC breaks the MWC range ceiling, avoid going long—the bearish HWC could reject the move, resuming its downtrend.
Wait for the Second Wave: Let the MWC return to a range after the first wave. If the LWC breaks the range ceiling again, go long with confidence—the HWC’s influence is less likely to disrupt this second wave.
Risk Management Tips (if you trade the first wave against the HWC):
Reduce Risk: Lower your position size to minimize exposure.
Take Profits Early: Close the position or secure most profits (e.g., scale out) once you hit your R/R target, as volatility is high.
Wider Stop-Loss: Set a larger stop-loss to account for potential HWC-driven reversals, as stop-loss hunts are common in this scenario.
Adjusting Stop-Loss Size Based on Cycles
Aligned Cycles (HWC, MWC, LWC in Same Direction): When all three cycles align (e.g., all uptrend), set a tighter stop-loss relative to market conditions. Gradually scale out profits instead of closing the position, as the trend’s strength supports higher R/R (e.g., 5 or 10).
HWC Against MWC/LWC: If the HWC opposes the other cycles (e.g., HWC downtrend, MWC/LWC uptrend), use a wider stop-loss. The HWC’s power could reverse the LWC, lowering your win rate if stops are too tight. Expect volatility and plan accordingly.
Final Vibe Check
This Cycle Mastery Part 1 equips you to time MWC waves with precision, aligning HWC, MWC, and LWC for smarter entries. By mastering when to trade the first or second wave, you’ll avoid traps and maximize your edge. Part 2 will dive deeper with examples—stay tuned! At Skeptic Lab, we trade with no FOMO, no hype, just reason. Protect your capital—stick to 1%–2% risk per trade. Want Part 2 or another topic? Drop it in the comments! If this guide sharpened your game, hit that boost—it fuels my mission! 😊 Stay disciplined, fam! ✌️
💬 Let’s Talk!
How will you time your MWC waves? Share your thoughts in the comments, and let’s crush it together!