LONG ON NZD/USDNZD/USD is at a major demand level.
Dollar is bearish. Economic News this afternoon should assist and pushing this pair up.
Looking to catch 200 pips to the previous high.
Multiple Time Frame Analysis

EURUSD Sell Explained...+100 pips, 3 TPS, 1 StrategyHey Rich Friends,
Happy Wednesday. I wanted to updated you on the EURUSD sell idea I posted a few days ago:
All of my TPs were hit and I was able to secure more than 100 pips in this trade.
Here is a synopsis of my strategy:
- Draw support and resistance lines on 2-3 time frames
- Wait for a break of structure above or below previous support or resistance to enter
- Check confirmations on the stochastic (buy = if stoch is facing up and the blue line is on top. sell = if stoch is facing down and the orange line is on top)
I will make a full strategy video soon, but that is basically it. I follow the same process over and over again because it works.
If this video was helpful or you have any questions, let me know below in the comments.
Peace and Profits,
Cha

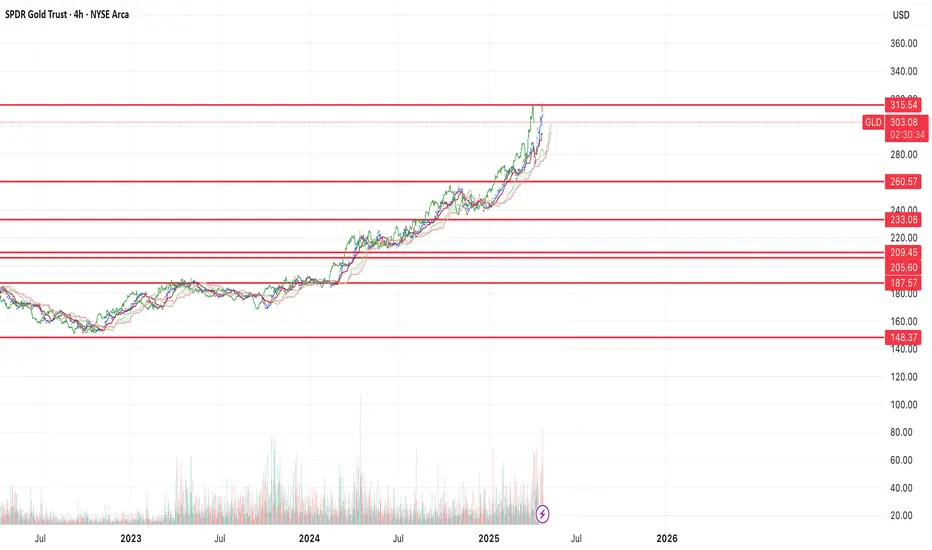
$GLD short term top in $260-148 target on the downsideAMEX:GLD looks a bit extended here. I could see the possibility of GLD falling back to the $260 support at a minimum and maximum all the way down to $148
The $209 support would be the 50% retracement of the recent run. I like that as a level for a bounce.
Let's see where we end up.
DLF is still struggling till today - {30/07/2025}2008 financial crisis it was so difficult for every corporate person in this living era,
Some companies have not yet recovered from the pre-2008 financial crisis level.
It is so hard to see them struggling,
I wish good luck to DLF company to make ALL TIME HIGH Soon,
Regards,
Happy Trading,
Stocks & Commodities Trade Analysis.

EURUSD Sell SetupHello traders!
Price has strong bearish momentum and is expected to move lower.
We're selling here with the target around the higher timeframe demand zone.
Manage your risk and trade safe!
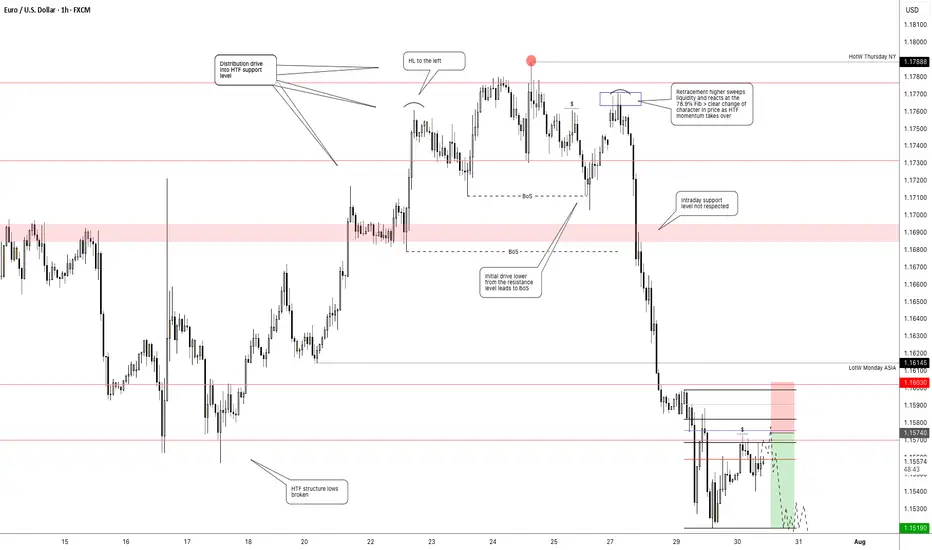
Getting short on EUR/USD!The dollar has looked set for a reversal and coming into the week it didn't hang around at all. I had a bit of a short bias on EUR/USD and was looking for confirmation signal which pretty much came at market open.
Price pushed higher back into the key level taking out a short term high, but was unable to follow through to form a new higher high. Heading into Monday London session, momentum immediately took hold with a clear bearish change of character and price didn't look back > breaking structure and key levels with minimal effort.
I was waiting for a pull back to get short early which didn't occur. But no need to chase price, waiting and patience is part of the game.
Price has now broken another key support level and is set to retest it as resistance. This will be my entry point (see screenshot) > using the 70.5%-78.6% fib retracement level and my stop above Tuesdays high. Keep it simple.
tradingview.sweetlogin.com/proxy-s3
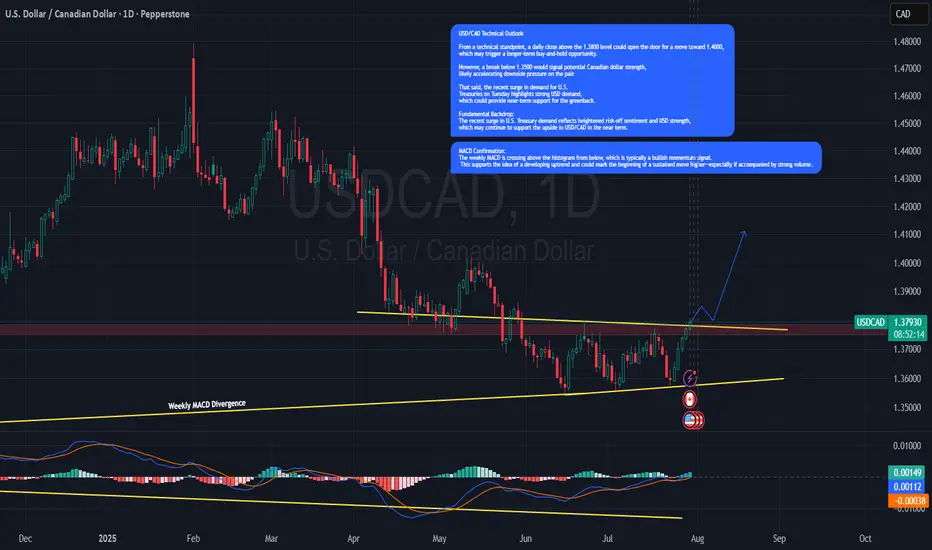
USD/CAD Eyes Breakout Above 1.38 as Weekly MACD Flashes BullishUSD/CAD Eyes Breakout Above 1.38 as Weekly MACD Flashes Bullish Signal
USD/CAD Weekly Technical Outlook
The pair is approaching a key resistance zone around 1.3800 . A weekly close above this level could signal a push toward the 1.4000 handle, opening the door for a longer-term bullish breakout and potential buy-and-hold scenario.
From the downside, a break below 1.3500 would likely trigger Canadian dollar strength, possibly driving the pair much lower.
MACD Confirmation:
The weekly MACD is crossing above the histogram from below, which is typically a bullish momentum signal. This supports the idea of a developing uptrend and could mark the beginning of a sustained move higher—especially if accompanied by strong volume.
Fundamental Backdrop:
The recent surge in U.S. Treasury demand reflects heightened risk-off sentiment and USD strength, which may continue to support the upside in USD/CAD in the near term.
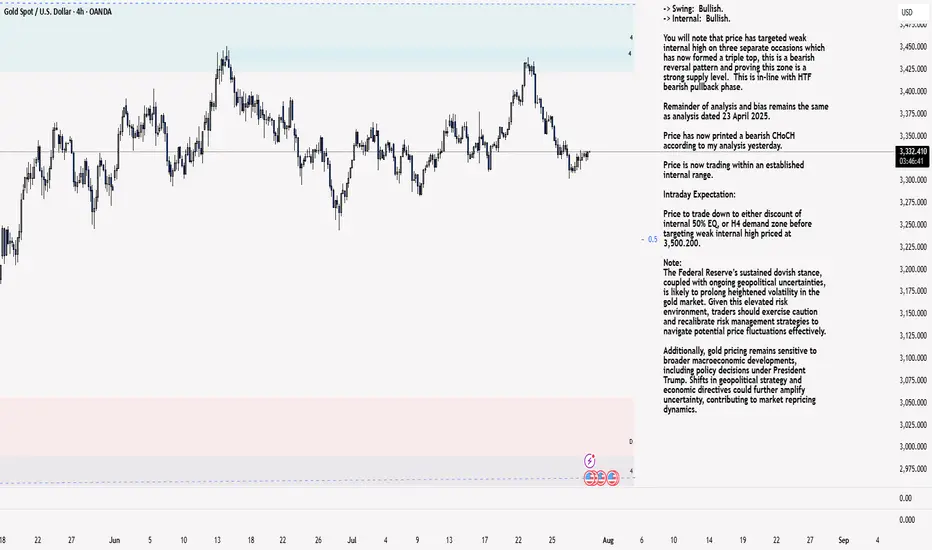
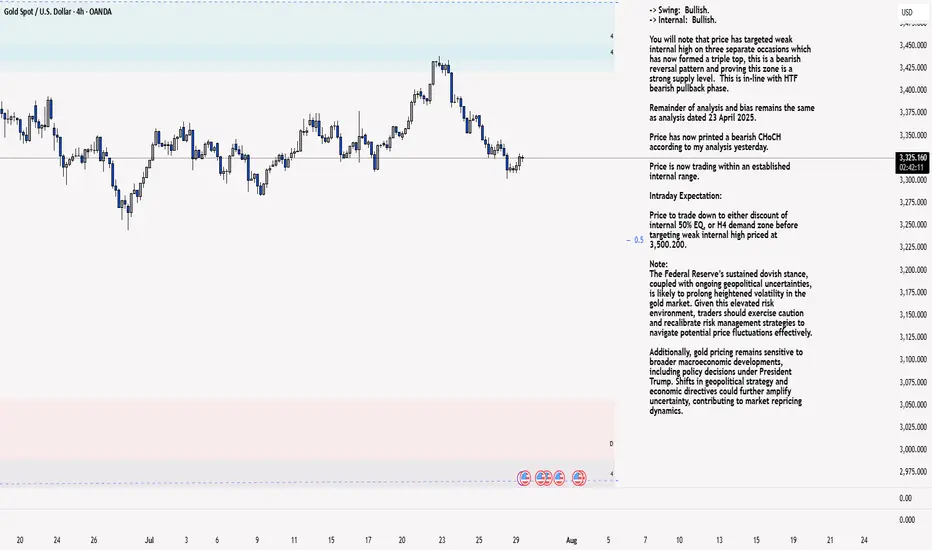
XAU/USD 30 July 2025 Intraday AnalysisH4 Analysis:
-> Swing: Bullish.
-> Internal: Bullish.
You will note that price has targeted weak internal high on three separate occasions which has now formed a triple top, this is a bearish reversal pattern and proving this zone is a strong supply level. This is in-line with HTF bearish pullback phase.
Remainder of analysis and bias remains the same as analysis dated 23 April 2025.
Price has now printed a bearish CHoCH according to my analysis yesterday.
Price is now trading within an established internal range.
Intraday Expectation:
Price to trade down to either discount of internal 50% EQ, or H4 demand zone before targeting weak internal high priced at 3,500.200.
Note:
The Federal Reserve’s sustained dovish stance, coupled with ongoing geopolitical uncertainties, is likely to prolong heightened volatility in the gold market. Given this elevated risk environment, traders should exercise caution and recalibrate risk management strategies to navigate potential price fluctuations effectively.
Additionally, gold pricing remains sensitive to broader macroeconomic developments, including policy decisions under President Trump. Shifts in geopolitical strategy and economic directives could further amplify uncertainty, contributing to market repricing dynamics.
H4: Chart:
M15 Analysis:
-> Swing: Bullish.
-> Internal: Bullish.
H4 Timeframe - Price has failed to target weak internal high, therefore, it would not be unrealistic if price printed a bearish iBOS.
The remainder of my analysis shall remain the same as analysis dated 13 June 2025, apart from target price.
As per my analysis dated 22 May 2025 whereby I mentioned price can be seen to be reacting at discount of 50% EQ on H4 timeframe, therefore, it is a viable alternative that price could potentially print a bullish iBOS on M15 timeframe despite internal structure being bearish.
Price has printed a bullish iBOS followed by a bearish CHoCH, which indicates, but does not confirm, bearish pullback phase initiation. I will however continue to monitor, with respect to depth of pullback.
Intraday Expectation:
Price to continue bearish, react at either M15 supply zone, or discount of 50% internal EQ before targeting weak internal high priced at 3,451.375.
Note:
Gold remains highly volatile amid the Federal Reserve's continued dovish stance, persistent and escalating geopolitical uncertainties. Traders should implement robust risk management strategies and remain vigilant, as price swings may become more pronounced in this elevated volatility environment.
Additionally, President Trump’s recent tariff announcements are expected to further amplify market turbulence, potentially triggering sharp price fluctuations and whipsaws.
M15 Chart:
GBPUSD SELLAfter seeing the previous daily candle close bearish and the 4hr had a retrace back into the moving averages we could expect price to see further sell off into support

EURJPY ANALYSISAfter seeing the daily still pushing to the downside and breaking below key support of 171.250 we could be looking out for a retest and continuation to the down side target of 170.000

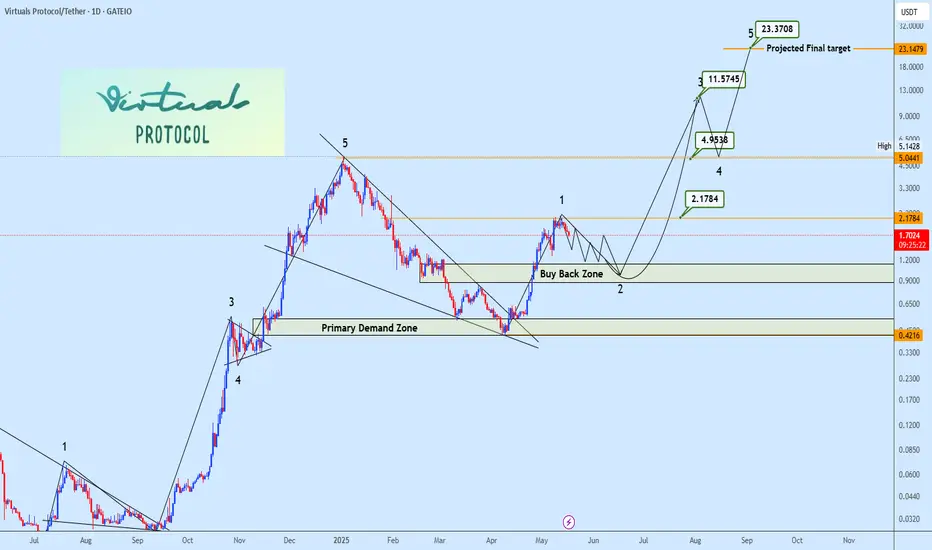
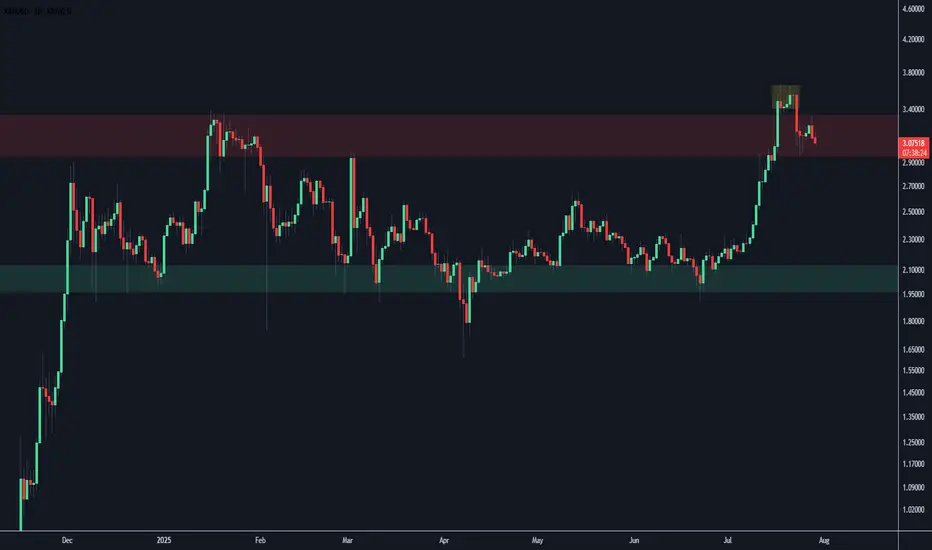
VIRTUAL PROTOCOL Wave 2 Correction in Play After 4x ImpulseFollowing the completion of its previous cycle correction, Virtual Protocol confirmed a bullish reversal via a breakout from a falling wedge, initiating Impulse Wave (1) with an impressive ~4x move. Current price action signals the commencement of Wave (2) corrective structure, aligning with standard Elliott Wave Theory post-impulsive behavior.
The buy-back zone (highlighted on chart) represents the high-probability retracement region based on Fib confluence (0.5–0.618 retracement levels) and prior structural support.
Wave (3) and Wave (5) targets are projected using Fibonacci extensions and historical momentum analogs. Eyes remain on the buy-back zone for optimal re-entry.
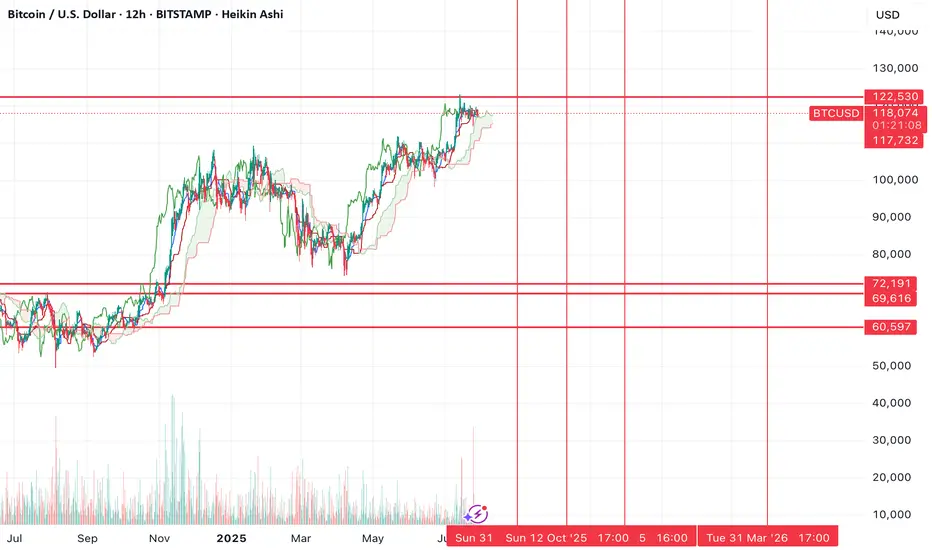
BTC highs in, new lows coming soon?~$122.5k was the top of the range. Now we'll need to go test the lows before we can continue higher.
Alts are clearly not confirming a trend change .
Many still bearish on HTFs (including ETH), I think the reason is because Bitcoin goes lower before we see a continued run and that will drag down alts with it. I think people holding alts here with hopes for new highs (in the near future) are about to have their hopes crushed, that also goes for people long crypto miners.
I don't think the real run starts until end of 2025 or 2026.
Time will tell.
T-Bond Futures & US10Y Yields Weekly BiasUS10Y: 4.288% - 4.240%
T-Bonds: 115.11 - 115.24
Bullish t-bond, bearish US10Y

Gold Struggles Near Resistance – Eyes on 3313 for Further DropXAU/USD Slips as Dollar Gains on Trade Deal – Bearish Below Pivot Zone
Gold is under pressure as the U.S. dollar strengthens on optimism around a trade agreement. Risk appetite has returned, weighing on safe-haven demand.
Price failed to hold the pivot zone (3347–3360) and is now slipping below 3327. A 4H close below 3313 will likely trigger further downside.
Until bulls reclaim the pivot, bias stays bearish. Next support sits near 3287 if 3313 breaks clean.
Key Levels:
Resistance: 3388 – 3390 – 3412
Pivot Zone: 3340 – 3347
Support: 3313 – 3263

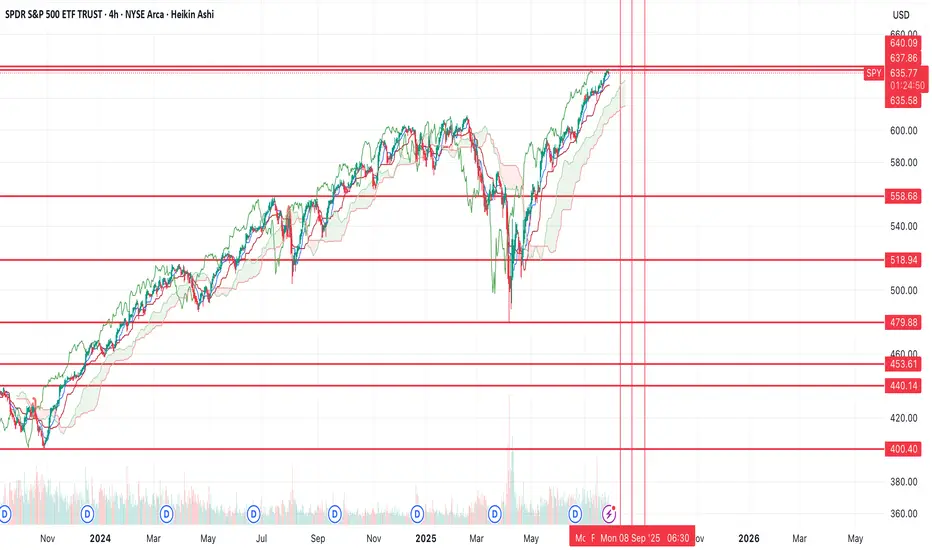
$SPY rolling over, potentially to new lows?While I was early to the idea (like usual), still don't think the thesis will be wrong. I still believe we're going to see a large move down from here.
Yesterday's price action made me pretty confident a top was in (TBD). We had positive news and the market couldn't rally on that positive news and we ended up closing at the lows -- indicating to me there's no more buyers.
Today we have treasuries, the dollar and volatility all rallying while equities selloff, a classic risk off signal. You also have crypto selling off too.
I think we see a large risk off move from here on out, the target is the $440 area (extreme down to $400), but if we find support at one of the other levels above that, there's potential for us to rally from there.
Will have to see how price action plays out over the coming weeks.
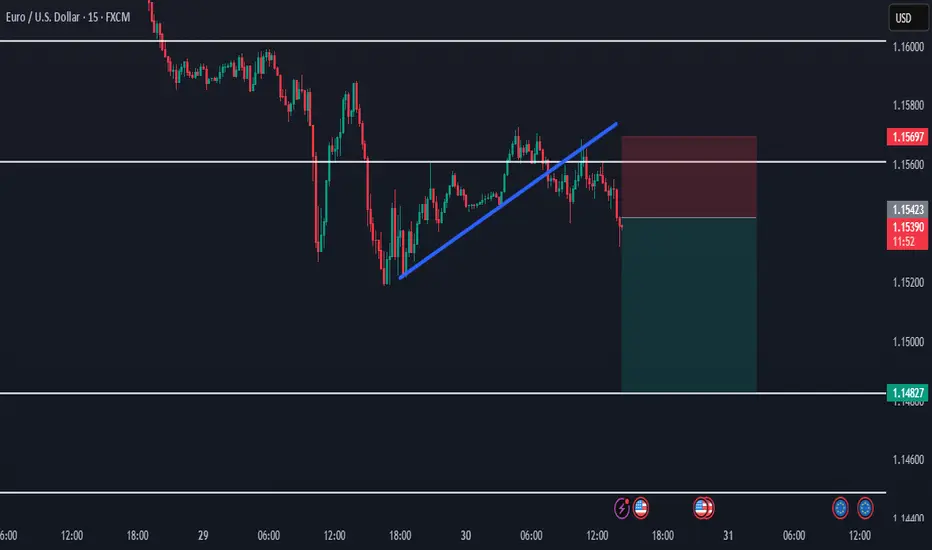
Why I Think EURUSD Will Sell This Week...Technical AnalysisHey Rich Friends,
Happy Monday. I think EURUSD will continue to sell this week. This is only my technical analysis so please check the news and cross reference any indicators you have on your own chart. Here is what I am looking at:
- There has been a break of structure to the downside on H4 signaling that price may continue to drop lower.
- After the break of structure, price opened lower and continued to sell.
- Momentum has been picking up for the sellers over the last 12 hours.
- The stochastic is oversold. The slow line (orange) is above the fast line (blue) and one or both lines are below 20.
These are all strong bearish confirmations for me so I will be selling. I took market execution order but I also have sell stops and TPs at previous lows. My SL will be a previous high.
Only take trades that make sense to you, but I hope the market is in our favor this week. Let me know what you think about this idea below.
Peace and Profits,
Cha

XRP Daily ChartReally starting to move down after ranging between this resistance this week.
Could easily make all time lows as easily as all time highs, not a bad price to take some profit.
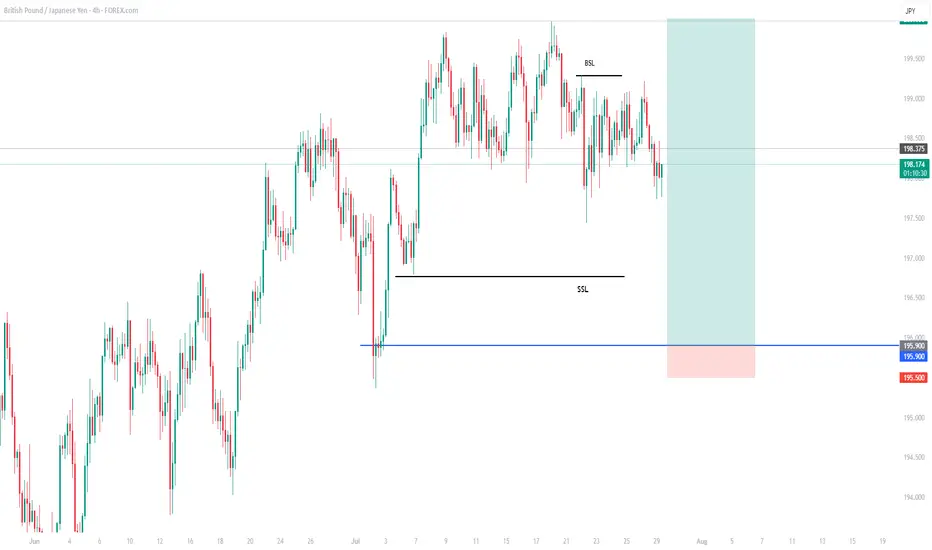
GBPJPY BUY SETUPGBPJPY is bullish on the daily timeframe and is currently retracing to continue buying. I want to see structural liquidity taken and tap my entry before continuing to the upside.
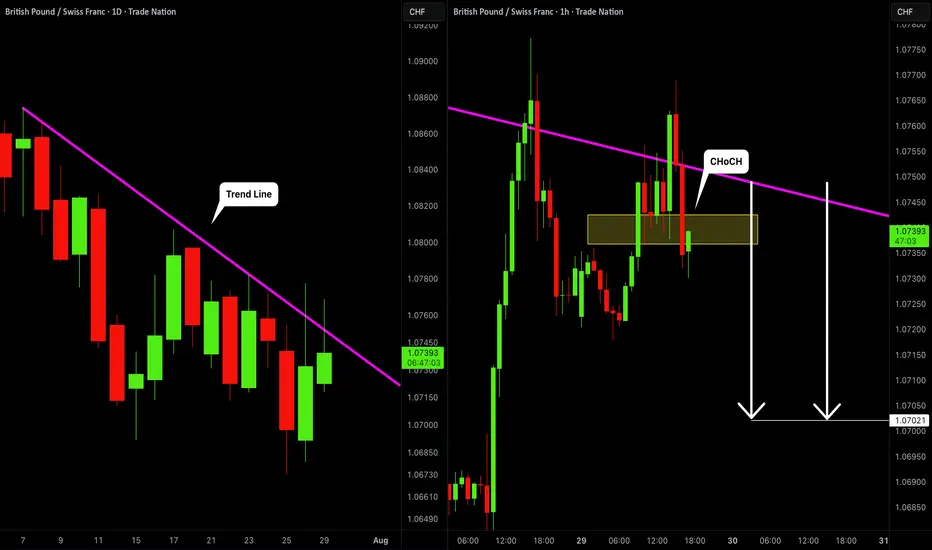
GBPCHF: Bearish Movement Confirmed 🇬🇧🇨🇭
GBPCHF looks bearish after the news today.
The price tested a solid rising trend line on a daily
and formed a confirmed bearish Change of Character
on an hourly time frame.
I think that the price will continue falling and reach 1.0702 level.
❤️Please, support my work with like, thank you!❤️
I am part of Trade Nation's Influencer program and receive a monthly fee for using their TradingView charts in my analysis.
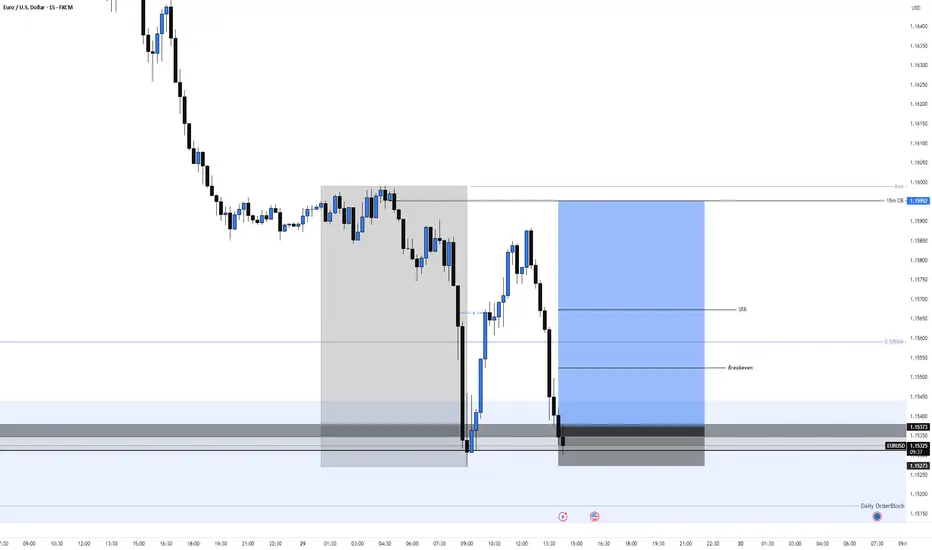
EURUSD Long, 29 JulyReversal Setup from Daily OB + LTF Confluence
Price tapped into a Daily Bullish OB with 50EMA support, signaling potential for a bullish reaction. While structure isn’t perfect, the overextension and DXY correlation offer strong intraday confluence.
📈 HTF Confluence:
✅ Sitting inside a Daily Bullish Orderblock
📍 50EMA in the same area → added support
🟢 Expecting a bounce from this zone, even if HTF trend isn’t clearly bullish yet
📉 LTF Context:
💤 Asia range formed, still unfilled → clean liquidity target
📉 Overextended bearish move into 15m POI
🪞 DXY at its own 15m POI + Asia range to complete → supports EU upside
🎯 Entry Plan:
✅ Clear 1m BOS after reacting from 15m Decisional OB
🎯 Entry taken at 5m OB inside that 15m POI zone
⚠️ Decisional OB isn’t ideal, but stacked confluences justify the risk
🛡 SL: Below 5m OB
📌 TP: Asia high + potential continuation if DXY breaks lower
XAU/USD 29 July 2025 Intraday AnalysisH4 Analysis:
-> Swing: Bullish.
-> Internal: Bullish.
You will note that price has targeted weak internal high on three separate occasions which has now formed a triple top, this is a bearish reversal pattern and proving this zone is a strong supply level. This is in-line with HTF bearish pullback phase.
Remainder of analysis and bias remains the same as analysis dated 23 April 2025.
Price has now printed a bearish CHoCH according to my analysis yesterday.
Price is now trading within an established internal range.
Intraday Expectation:
Price to trade down to either discount of internal 50% EQ, or H4 demand zone before targeting weak internal high priced at 3,500.200.
Note:
The Federal Reserve’s sustained dovish stance, coupled with ongoing geopolitical uncertainties, is likely to prolong heightened volatility in the gold market. Given this elevated risk environment, traders should exercise caution and recalibrate risk management strategies to navigate potential price fluctuations effectively.
Additionally, gold pricing remains sensitive to broader macroeconomic developments, including policy decisions under President Trump. Shifts in geopolitical strategy and economic directives could further amplify uncertainty, contributing to market repricing dynamics.
H4 Chart:
M15 Analysis:
-> Swing: Bullish.
-> Internal: Bullish.
H4 Timeframe - Price has failed to target weak internal high, therefore, it would not be unrealistic if price printed a bearish iBOS.
The remainder of my analysis shall remain the same as analysis dated 13 June 2025, apart from target price.
As per my analysis dated 22 May 2025 whereby I mentioned price can be seen to be reacting at discount of 50% EQ on H4 timeframe, therefore, it is a viable alternative that price could potentially print a bullish iBOS on M15 timeframe despite internal structure being bearish.
Price has printed a bullish iBOS followed by a bearish CHoCH, which indicates, but does not confirm, bearish pullback phase initiation. I will however continue to monitor, with respect to depth of pullback.
Intraday Expectation:
Price to continue bearish, react at either M15 supply zone, or discount of 50% internal EQ before targeting weak internal high priced at 3,451.375.
Note:
Gold remains highly volatile amid the Federal Reserve's continued dovish stance, persistent and escalating geopolitical uncertainties. Traders should implement robust risk management strategies and remain vigilant, as price swings may become more pronounced in this elevated volatility environment.
Additionally, President Trump’s recent tariff announcements are expected to further amplify market turbulence, potentially triggering sharp price fluctuations and whipsaws.
M15 Chart:
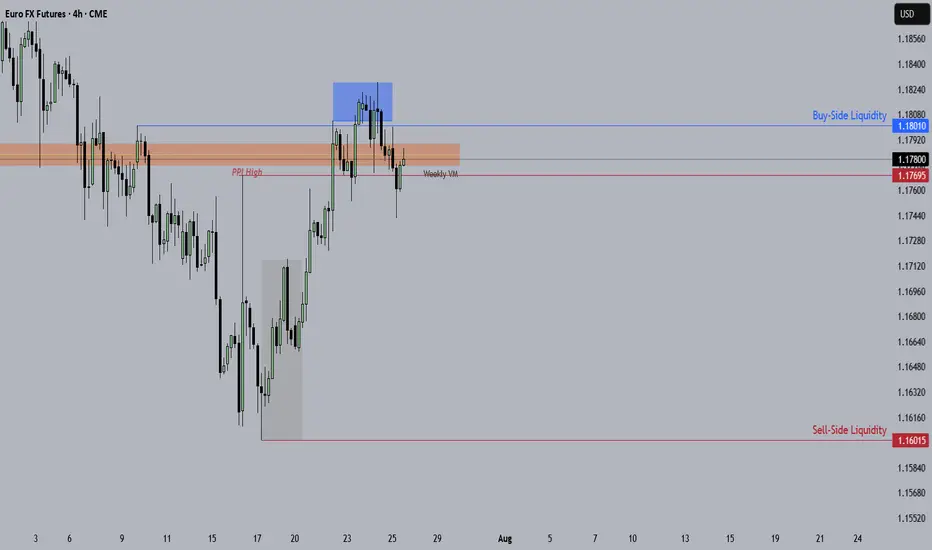
Euro Futures Idea.From HTF direction to LTF direction, this is my Trade Idea for the week of 28 July - 1 Aug.
Key Things in this trade idea, HTF PDAs, Liquidity of news high and daily swing and MMSM going on.
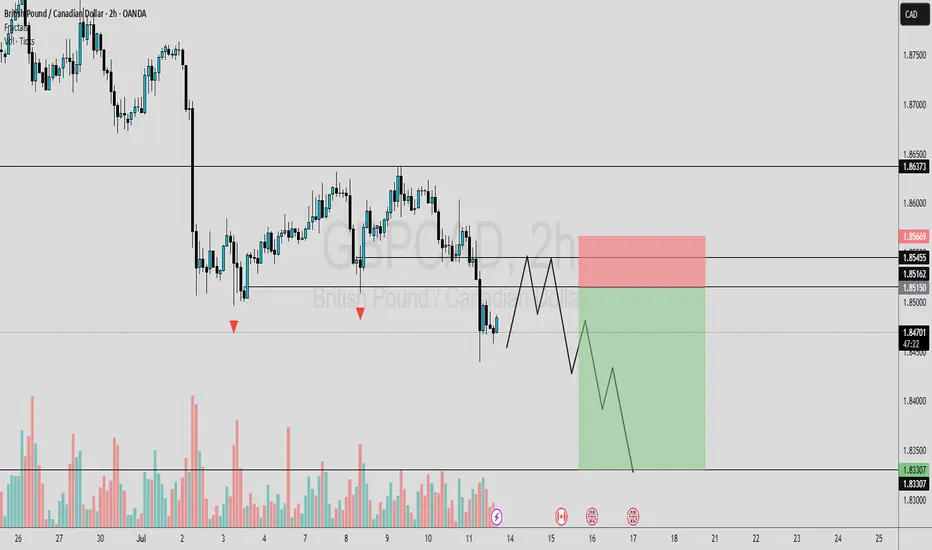
GBPCAD OUTLOOKIn this analysis we're focusing on 2H time frame for finding possible upcoming movement in price. So as per my strategy today I'm looking for a sell trade opportunity. Confirmation is very important, after confirmation we'll execute our trade. Let's see which opportunity market will give us.
Always use stoploss for your trade.
Always use proper money management and proper risk to reward ratio.
This is my prediction.
#GBPCAD 1H Technical Analysis Expected Move.