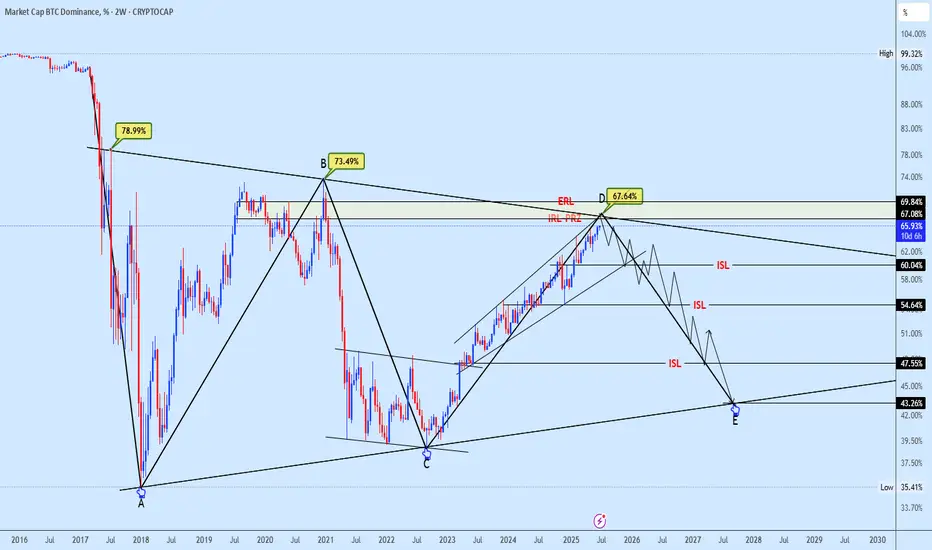
BTC.D Nearing a Historic Inflection PointBTC Dominance (BTC.D) is fast approaching the 67.64% resistance level, sitting firmly within a key supply zone marked at point D. This area represents a high confluence region, aligning with a long-term descending trendline and the upper boundary of a bearish wedge structure.
If validated, this would complete a potential ABCDE reversal formation suggesting a macro top in Bitcoin dominance may already be forming.
A rejection from this zone could trigger a pullback towards the immediate support at the 60% level. Should this level break, further downside may unfold toward 54.64%, with a deeper long-term target resting around the 45% zone.
This setup could mark a significant turning point if dominance begins to unwind, we may witness an aggressive rotation into altcoins. Keep a close eye on structural breaks and liquidity sweeps.
Alt season might just be closer than we think.
What’s your take on this potential shift? Let’s discuss in the comments.
Multiple Time Frame Analysis
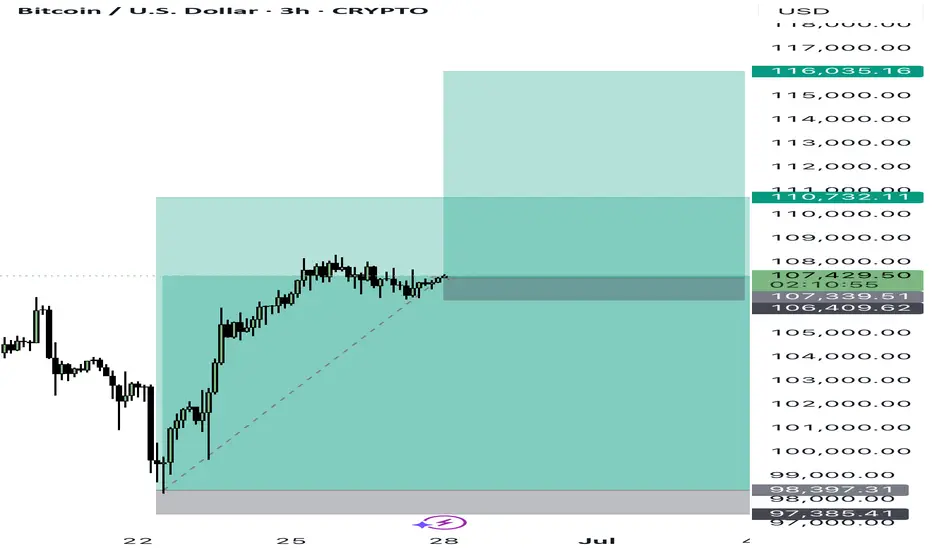
BTCUSD Buy Market Entry 107450-350 SL:106400BTCUSD
BUY By Market
Entry: 107500-107350
Sl: 106400
Tp1: 110000
Tp2: 116000
1% risk
Long trade
30sec TF entry
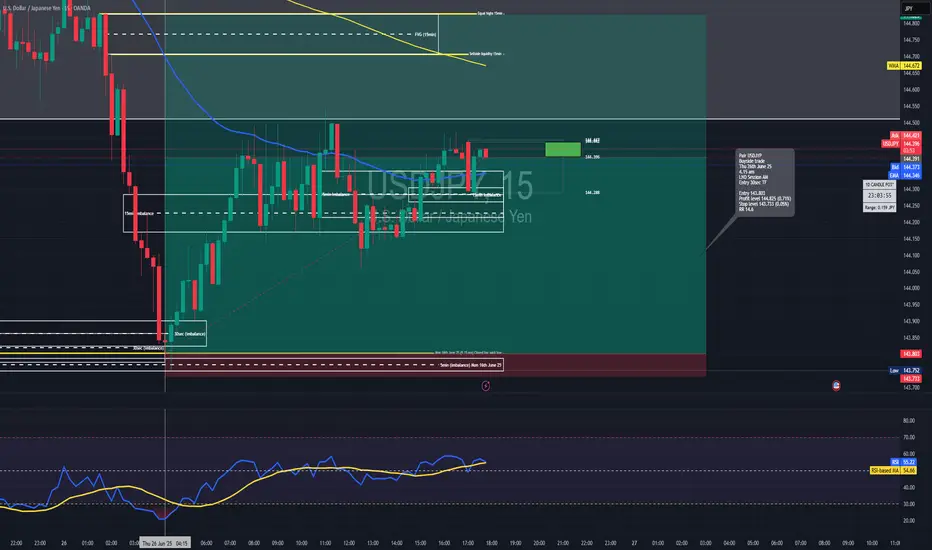
📍 Pair: USDJPY
📅 Date: Thursday, June 26, 2025
🕒 Time: 4:15 AM (London Session AM)
⏱ Time Frame: 15min
📈 Direction: Buyside
📊 Trade Breakdown:
Metric Value
Entry Price 143.803
Profit Level 144.825 (+0.71%)
Stop Loss 143.733 (−0.05%)
Risk-Reward
Ratio 14.6 : 1
🧠 Context / Trade Notes
🔄 15 Minute Structure Support:
The trade was based on a reactive low from the 5-minute TF, aligning with a buy-side imbalance zone formed on the 5-minute chart (Monday, 16th June, 10:00 AM).
📉 RSI in Low Region:
RSI was observed in an oversold condition on LTFs, providing additional confluence for a short-term reversal setup.
30sec TF entry overview
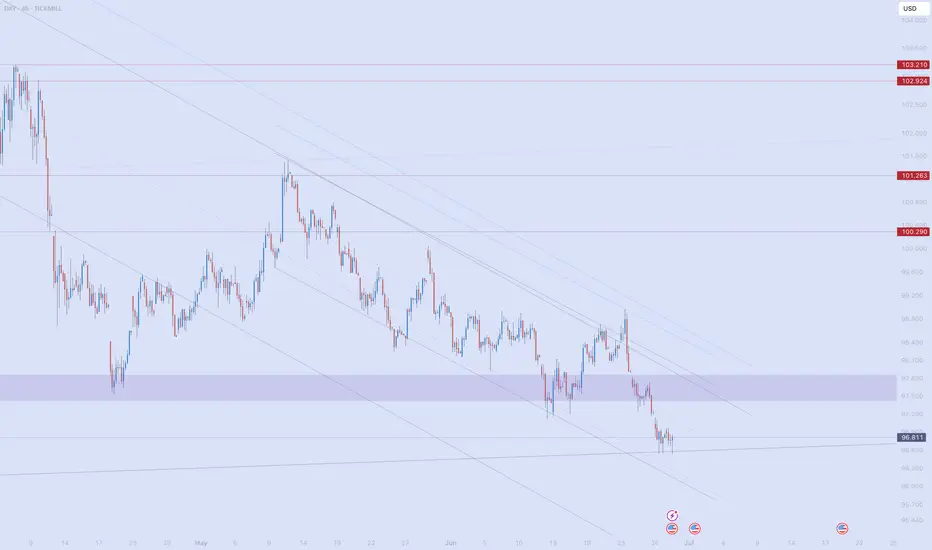
Make Dollar Great AgainDXY Big Picture
While looking at other DXY charts to use a clean chart for HTF, I saw that it touched historical trend support. It didn't touch only on the TVC chart, so I am adding it with the other charts and accepting that it touched the trend.
According to the fractal I added in August last year, the price is moving very well.
I expect a correction from these areas. I think we have reached the reversal areas due to both the momentum in the declines and the oversold.
The decline fatigue I mentioned is more evident in LTF charts. The price cannot reach the EQ zone of the decline channel that has been going on since February on the daily chart. Although it is a very inclined channel on the 4h chart, it can no longer reach the channel bottom. For this reason, I think this region is where reversal should be sought. After the first 0.38 of this decline, I think a pullback to 0.5 is possible.
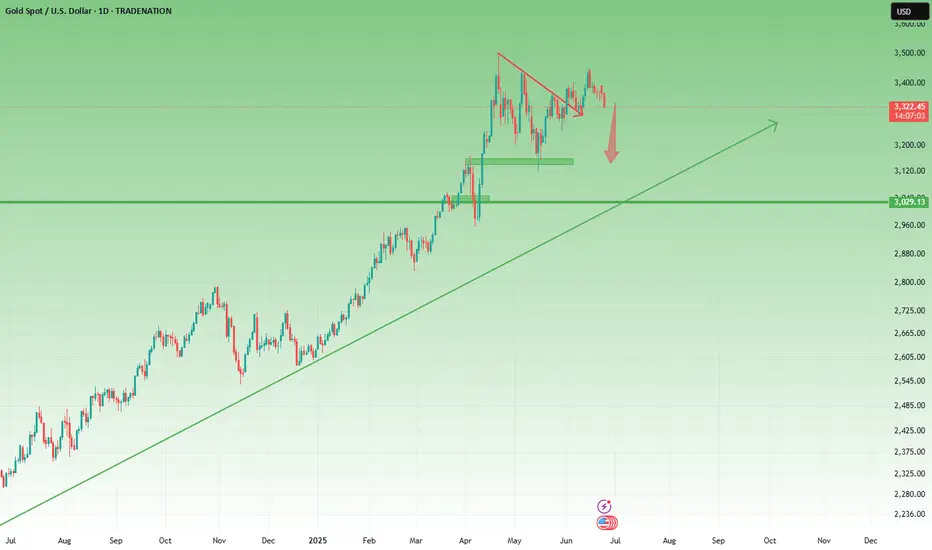
Gold Fails to Hold the Fear – Ceasefire Triggers 500+ Pip DropIn yesterday’s analysis, I pointed out that despite the weekend escalation in the middle-east, which triggered a gap up in Gold, the price action didn’t confirm the fear narrative. Gold failed to hold its gains – a clear sign of weakness.
📌 What happened next?
Throughout the day, Gold attempted multiple pushes toward 3400 – but each effort was met with strong selling pressure.
Then came the ceasefire announcement… and Gold dropped hard, now trading around 3320, locking in over 500 pips of profit from my short setup.
________________________________________
❓ More importantly, what’s next for Gold?
More important than the short-term noise is what the charts are now telling us:
📉 Weekly chart? Bearish.
🕯️ Daily chart? Also turned bearish after last week’s indecisive price action.
________________________________________
📌 Strategy remains the same:
I continue to sell rallies, and I’m now watching the 3280 support zone for a possible test in the coming hours.
Patience. Discipline. Let the market come to you. 🚀
Disclosure: I am part of TradeNation's Influencer program and receive a monthly fee for using their TradingView charts in my analyses and educational articles.
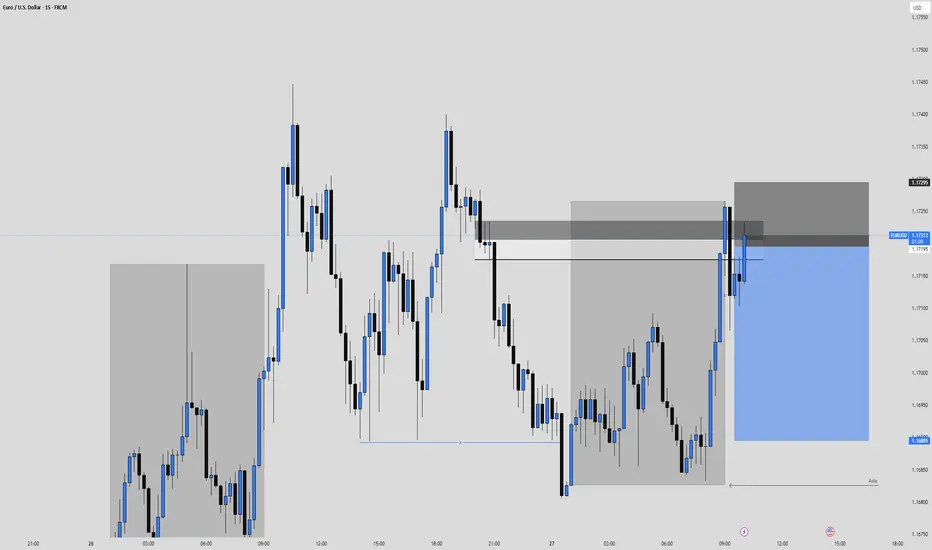
EURUSD Sell, June 27HTF shows reaction from W/D Orderblocks with multiple Daily imbalances below as downside targets. While GBPUSD is also at a valid D OB, EU gives clearer confirmation on LTF.
On LTF, price opened London above Asia highs (ideal for short setups) and showed 15m BOS into a 15m POI.
We've tapped into a 5m Orderblock inside the 15m zone, followed by a clean 1m BOS.
📍Entry: 5m OB with SL above highs (tight 10 pip risk)
🎯 TP1: 1:3 (75% off)
🎯 Final TP: Below Asia low & Daily imbalance
📉 Risk: 0.25% (reduced it for more consistency)
Confident setup — but if price rallies to the upper 5m OB and leaves without us, that’s part of the plan. No chasing.
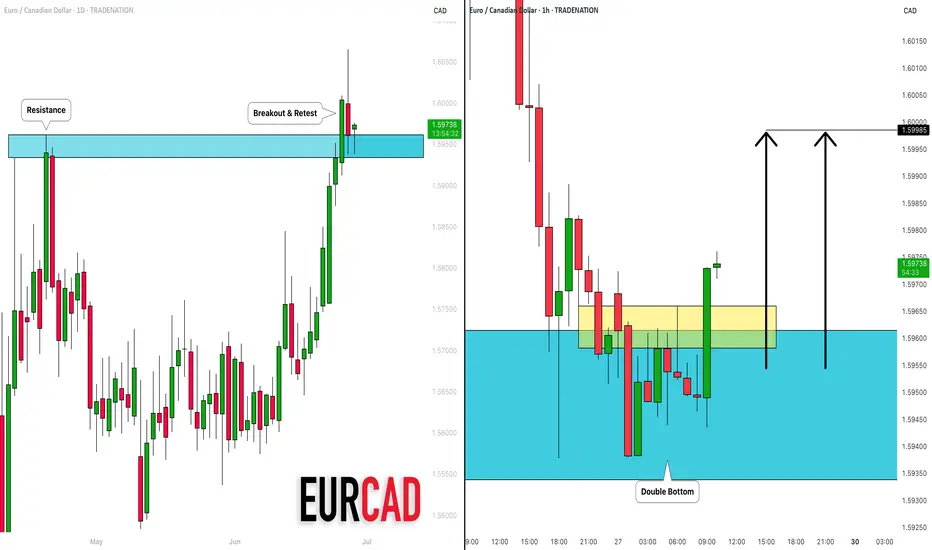
EURCAD: Pullback Trade From Support 🇪🇺🇨🇦
EURCAD is going to bounce from a recently broken
key daily horizontal resistance that turned into support after a violation.
The price violated a neckline of a double bottom pattern with
a bullish imbalance candle on an hourly time frame as a confirmation.
Goal - 1.5998
I am part of Trade Nation's Influencer program and receive a monthly fee for using their TradingView charts in my analysis.
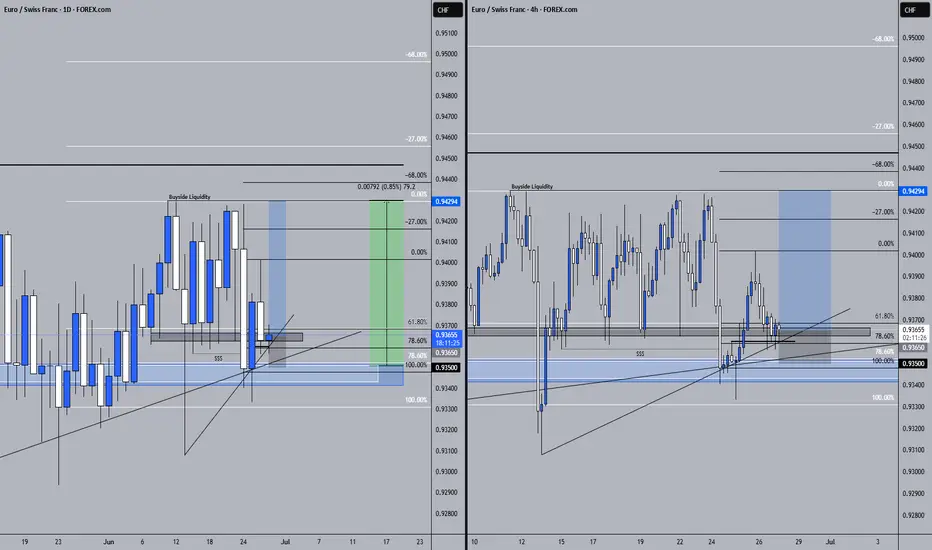
EURCHF 26/06/2025Weekly:
-Inverse H&S pattern.
-Previous week low liqudity sweep.
-IC.
Daily:
-Bullish M pattern.
-Liqudity sweep.
4H:
-Bullish M pattern.
-Inverse H&S pattern.
USDJPY is ready to go down to 143.834USDJPY is ready to follow my strategy and is already going down to 143.834

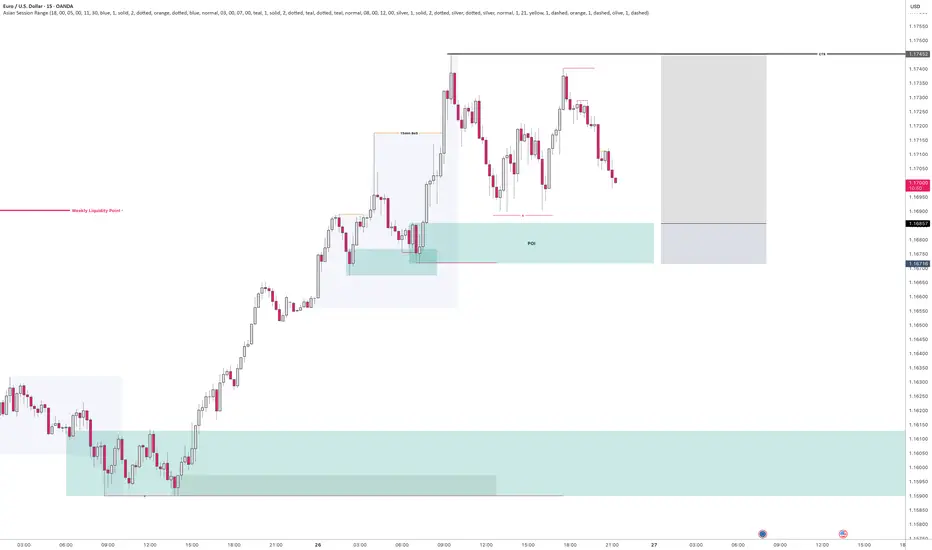
EURUSD - Potential buying opportunityLooking at EURUSD
We are still very bullish with no sign of it slowing.
I am aware of a potential weekly liquidity point to the left, however, until EURUSD shows its hand it's important that we still remain bullish.
We have set up a lovely liquidity point before a lovely demand area.
So I will be setting a pending order at the demand area after the New York close and the Asian session begins.
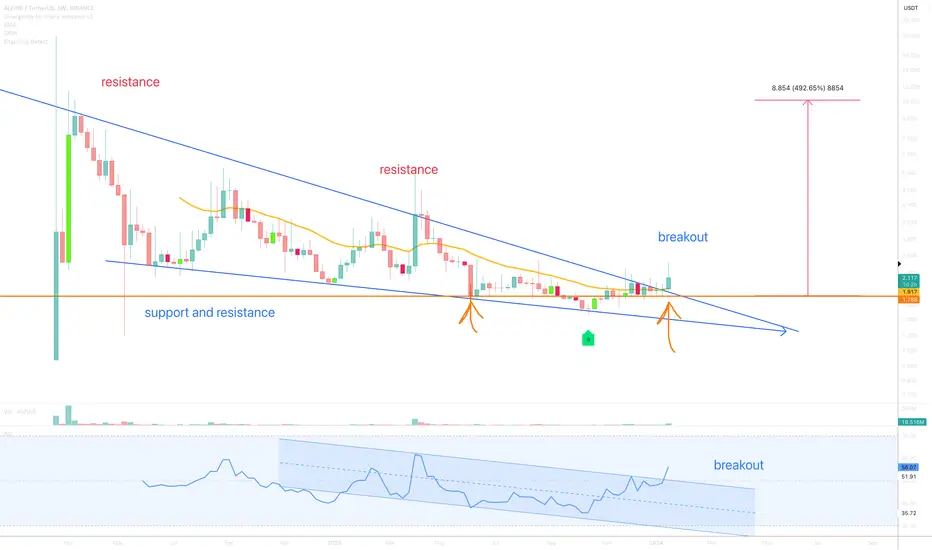
Alpine F1 Team Fan Token (ALPINE)On the above weekly chart price has corrected over 80% since 2022. A number of reasons now exist to be long. They include:
1) Price action and RSI resistance breakouts.
2) Regular bullish divergence. Multiple oscillators print positive divergence with price action over a 3 month period.
3) Price action confirms support on past resistance.
Is it possible price action corrects further? Sure.
Is it probable? No.
Ww
Type: trade
Risk: 6%
Timeframe for long: now
Return: 400%
SPA - Next Alt to MOON ??SPA is an altcoin that could make great increases in the near future.
Even though it's currently still trading under the moving averages in the Daily, once it turns there is good upside potential for this alt.
On the bright side, we observe higher lows for SPA:
One should also consider that this may be as good as it gets in terms of a low after the big dip, because a 47% correction is quite something:
IF that diagonal trendline of higher lows doesn't hold, I'd look at these zones next even if just for a wick:
And from here, we can really start to see BIG increases, IF you have the patience:
________________________
COINBASE:SPAUSD

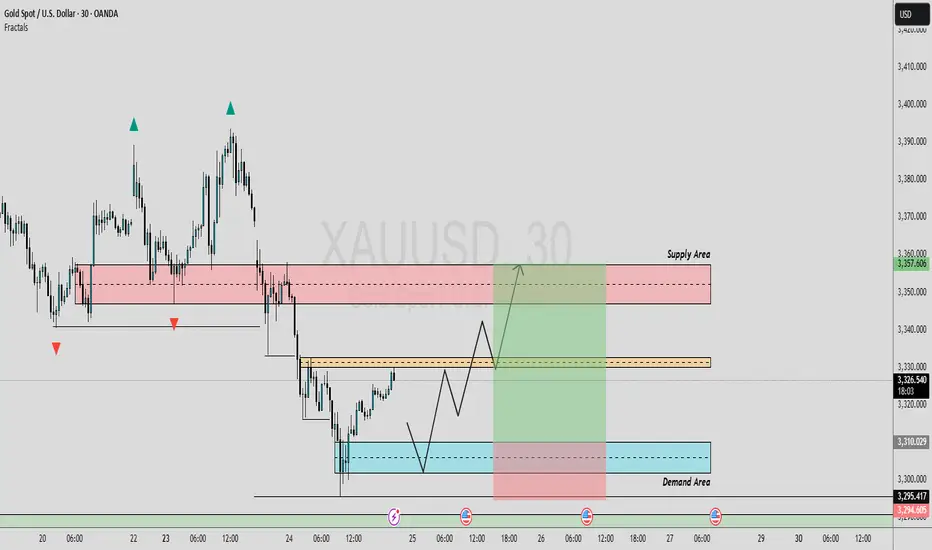
GOLD 30M ANALYSIS (LONG)In this analysis we're focusing on 30Min time frame. If we look in this 30Min chart, we have supply area and demand area. And we have also a minor resistance level. Now what I'm looking for that price move impulsively upside after sweeping all SSL. I'm expecting that price will come back and retest (3310 - 3305) area at least. So keep an eye on these level, confirmation is key.
Second Condition:
If price break above 3332 and close above 3332 with strong momentum than we will plan a buy trade on retracement.
Always use stoploss for your trade.
Always use proper money management and proper risk to reward ratio.
#XAUUSD 30M Technical Analysis Expected Move.
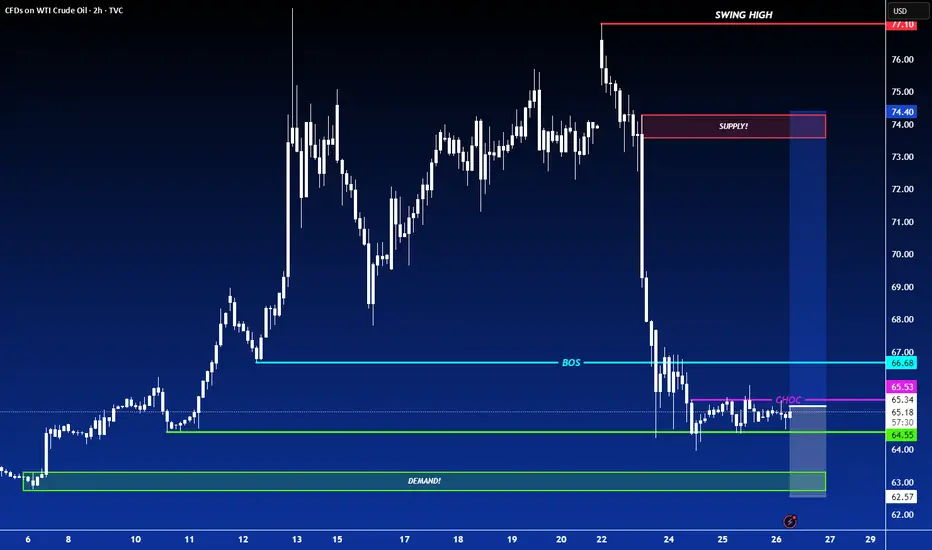
LONG ON OILUSOIL is consolidating at a major demand area.
We have a small choc (change of character) from down to up on the lower timeframe.
I will be buying oil to the next supply level looking to catch 500-1000 pips.
XAU/USD 26 June 2025 Intraday AnalysisH4 Analysis:
-> Swing: Bullish.
-> Internal: Bullish.
Analysis and bias remains the same as analysis dated 23 April 2025
Price has now printed a bearish CHoCH according to my analysis yesterday.
Price is now trading within an established internal range.
Intraday Expectation:
Price to trade down to either discount of internal 50% EQ, or H4 demand zone before targeting weak internal high priced at 3,500.200.
Note:
The Federal Reserve’s sustained dovish stance, coupled with ongoing geopolitical uncertainties, is likely to prolong heightened volatility in the gold market. Given this elevated risk environment, traders should exercise caution and recalibrate risk management strategies to navigate potential price fluctuations effectively.
Additionally, gold pricing remains sensitive to broader macroeconomic developments, including policy decisions under President Trump. Shifts in geopolitical strategy and economic directives could further amplify uncertainty, contributing to market repricing dynamics.
H4 Chart:
M15 Analysis:
-> Swing: Bullish.
-> Internal: Bullish.
Following previous high, and printing of bearish CHoCH, price has pulled back to an M15 supply zone, where we are currently seeing a reaction. Therefore, I shall now confirm internal high.
Price is now trading within an established internal range.
The remainder of my analysis shall remain the same as analysis dated 13 June 2025, apart from target price.
As per my analysis dated 22 May 2025 whereby I mentioned price can be seen to be reacting at discount of 50% EQ on H4 timeframe, therefore, it is a viable alternative that price could potentially print a bullish iBOS on M15 timeframe despite internal structure being bearish.
Price has printed a bullish iBOS followed by a bearish CHoCH, which indicates, but does not confirm, bearish pullback phase initiation. I will however continue to monitor, with respect to depth of pullback.
Intraday Expectation:
Price to continue bearish, react at either M15 supply zone, or discount of 50% internal EQ before targeting weak internal high priced at 3,451.375.
Note:
Gold remains highly volatile amid the Federal Reserve's continued dovish stance, persistent and escalating geopolitical uncertainties. Traders should implement robust risk management strategies and remain vigilant, as price swings may become more pronounced in this elevated volatility environment.
Additionally, President Trump’s recent tariff announcements are expected to further amplify market turbulence, potentially triggering sharp price fluctuations and whipsaws.
M15 Chart:

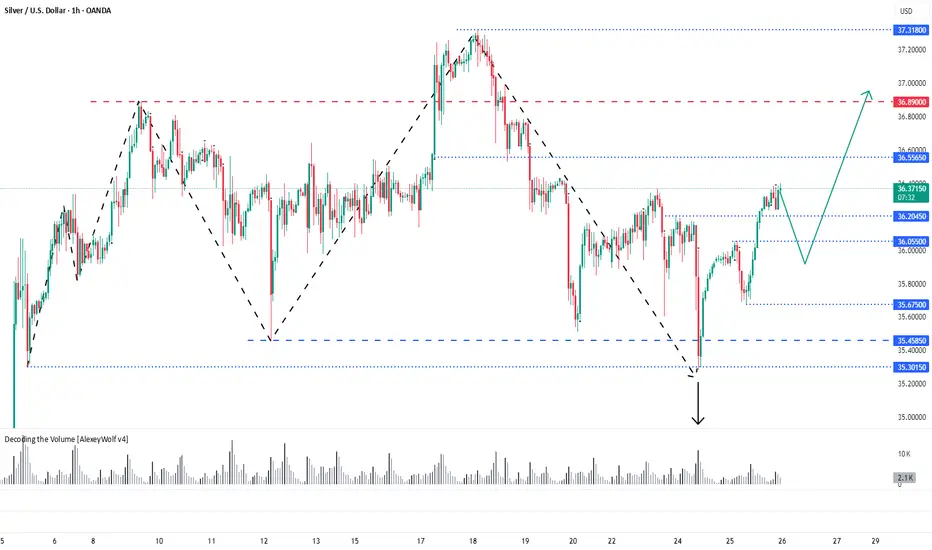
Silver - overview with Initiative AnalysisHey traders and investors!
Hourly Timeframe
📍 Context
The hourly chart is in a sideways range.
Currently, the buyer has the initiative, potential target 36.55.
📊 Key Actions
The 35.30 level on the hourly timeframe has worked well. This level marks the correction extreme within the dominant buyer initiative (i.e., an initiative where the correction is less than 50%).
A seller attack bar (IKC) targeting the lower boundary of the sideways range was absorbed by the buyer, and this absorption led to a renewed buyer. Targets visible on the chart - Hourly and daily timeframe: 36.55 and 36.89
Daily Timeframe
📍 Context
Currently, the buyer has the initiative, potential target 36.89.
📊 Key Actions
On the daily timeframe, there was also a seller IKC bar attacking the lower boundary of the buyer's initiative, which was bought back by the buyer.
🎯 Trade Idea
Potential buying patterns can now be monitored at: 36.20, 36.05, 35.67, 35.458
With targets set at: 36.55, 36.89, 37.32.
This analysis is based on the Initiative Analysis concept (IA).
Wishing you profitable trades!
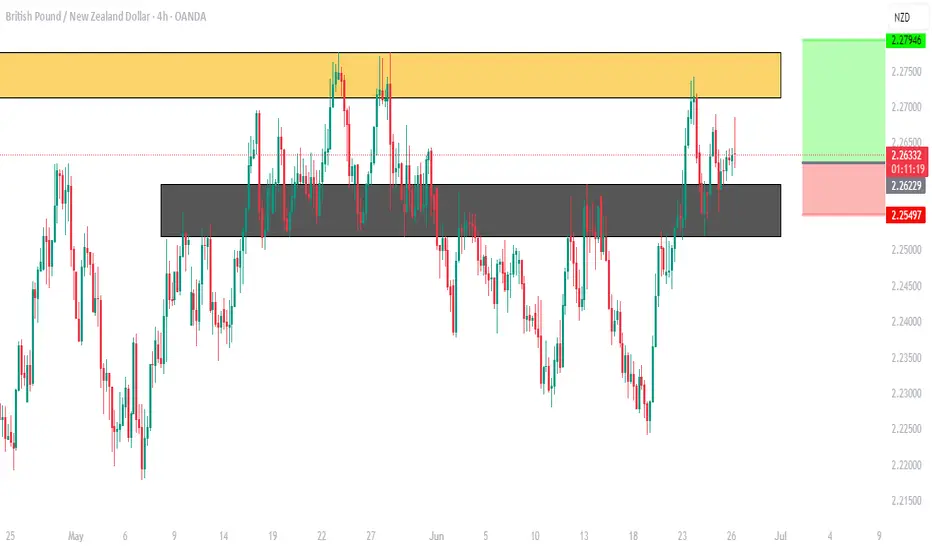
GBPNZD BREAK & RETEST OF KEY LEVEL.(DAILY) - Price is in an uptrend.
(DAILY) - Price hit Key Resistance level at (2.27722 - 2.27208) was rejected and sold off to the previous broken resistance now turned support at (2.25925 - 2.25197).
(H4) - Price formed Double bottom higher low which is a bullish pattern at (2.25925 - 2.25197).
(H4)- 50 EMA touching our Key level at (2.25925 - 2.25197) and acting as support.
Stop Loss at new higher low (2.25497)
Target at 2.27722.
AUDJPY 25/06/2026Weekly:
-Bullish M pattern.
-IC.
Daily:
-Inverse H&S pattern.
4H:
-Bullish M pattern.
-Inverse H&S pattern.

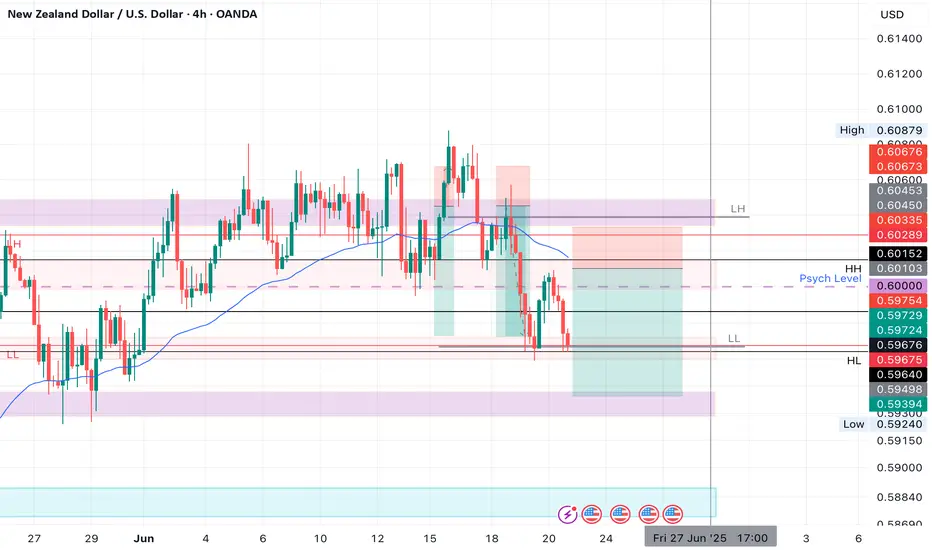
NZDUSD SHORT Market structure bearish on HTFs DH
Entry at Daily AOi
Weekly Rejection At AOi
Daily Rejection At AOi
Previous Structure point Daily
Around Psychological Level 0.60000
H4 EMA retest
H4 Candlestick rejection
Rejection from Previous structure
Levels 3.06
Entry 90%
REMEMBER : Trading is a Game Of Probability
: Manage Your Risk
: Be Patient
: Every Moment Is Unique
: Rinse, Wash, Repeat!
: Christ is King.
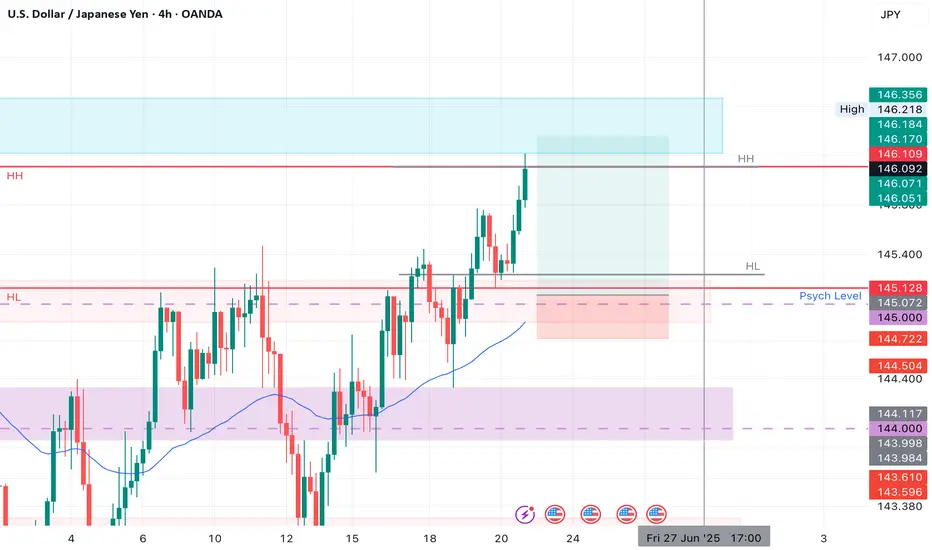
USDJPY LONG Market structure bullish on HTFs DH
Entry at Daily AOi
Weekly Rejection At AOi
Daily Rejection at AOi
Previous Daily Structure point
Daily EMA Retest
Around Psychological Level 145.000
H4 EMA Retest
H4 Candlestick rejection
Rejection from Previous structure
Levels 3.67
Entry 95%
REMEMBER : Trading is a Game Of Probability
: Manage Your Risk
: Be Patient
: Every Moment Is Unique
: Rinse, Wash, Repeat!
: Christ is King.
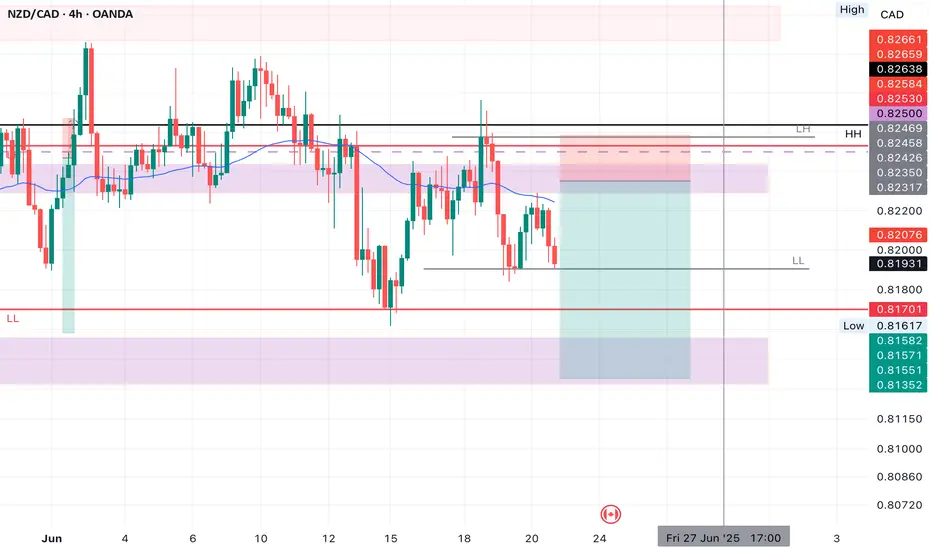
NZDCAD SHORT Market structure bearish on HTFs DH
Entry at both Weekly and Daily AOi
Weekly Rejection at AOi
Weekly EMA Retest
Daily Rejection at AOi
Daily EMA retest
Previous Structure point Daily
Around Psychological Level 0.82500
H4 EMA retest
H4 Candlestick rejection
Rejection from Previous structure
Levels 4.26
Entry 110%
REMEMBER : Trading is a Game Of Probability
: Manage Your Risk
: Be Patient
: Every Moment Is Unique
: Rinse, Wash, Repeat!
: Christ is King.
Short trade
1Hr TF overview
🔻 Trade Journal Entry – Sell-side Trade
📍 Pair: AUDUSD
📅 Date: Wednesday, June 25, 2025
🕒 Time: 5:00 AM (London Session AM)
⏱ Time Frame: 1 Hour
📉 Direction: Sell-side
📊 Trade Breakdown:
Metric Value
Entry Price 0.64939
Profit Level 0.64393 (−0.84%)
Stop Loss 0.65091 (+0.23%)
Risk-Reward
Ratio 3.59 1
🧠 Context / Trade Notes:
Premium Pricing at OB Rejection:
Price entered the premium zone and tapped a 1HR bearish order block, offering a clean entry for short positioning.

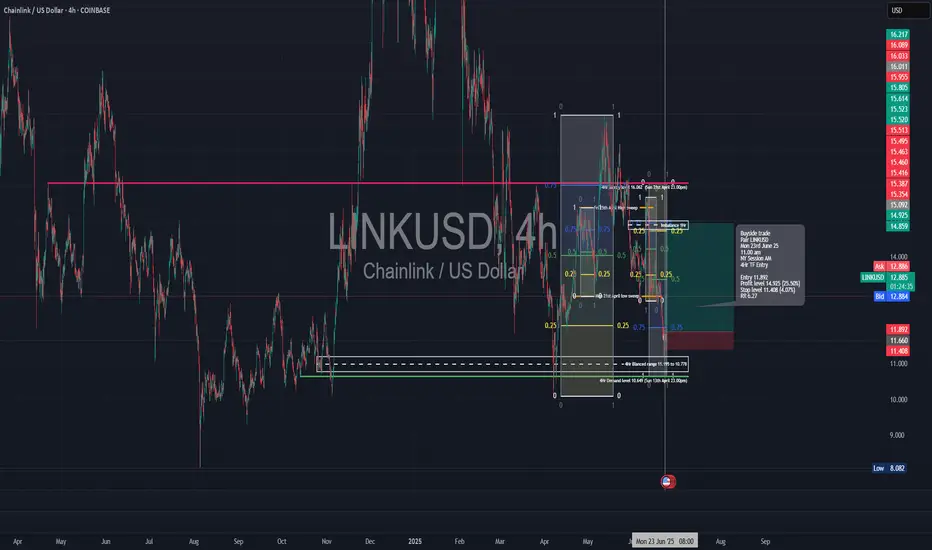
Long trade
📍 Pair: LINKUSD
📅 Date: Monday, June 23, 2025
🕒 Time: 11:00 AM (NY Session AM)
⏱ Time Frame: 4 Hour
📈 Direction: Buyside
📊 Trade Breakdown:
Entry Price 11.892
Profit Level 14.925 (+25.50%)
Stop Loss 11.408 (−4.07%)
Risk-Reward
Ratio 6.27 : 1
🧠 Context / Trade Notes:
High Timeframe Execution:
Trade executed from a 4-hour bullish order block, positioned at the base of a previous impulsive move.
Liquidity Engineering & Sweep:
The setup formed after a sweep below the previous 4H demand, collecting liquidity before reversing direction.