Short trade
🔻 Trade Journal Entry – Sell-side Trade
📍 Pair: GBPUSD
📅 Date: Wednesday, June 25, 2025
🕒 Time: 5:00 AM (London Session AM)
⏱ Time Frame: 4 Hour
📉 Direction: Sell-side
📊 Trade Breakdown:
Metric Value
Entry Price 1.36148
Profit Level 1.34186 (−1.44%)
Stop Loss 1.36356 (+0.15%)
Risk-Reward
Ratio 9.43 : 1
🧠 Context / Trade Notes:
4HR OB Rejection in Premium Zone:
Entry taken off a confirmed bearish order block after price tapped into a premium zone at the top of the internal range.
London Session Liquidity Sweep:
Trade captured the classic London stop-hunt above a short-term high, initiating a sell-off and confirming smart money movement.
Multiple Time Frame Analysis

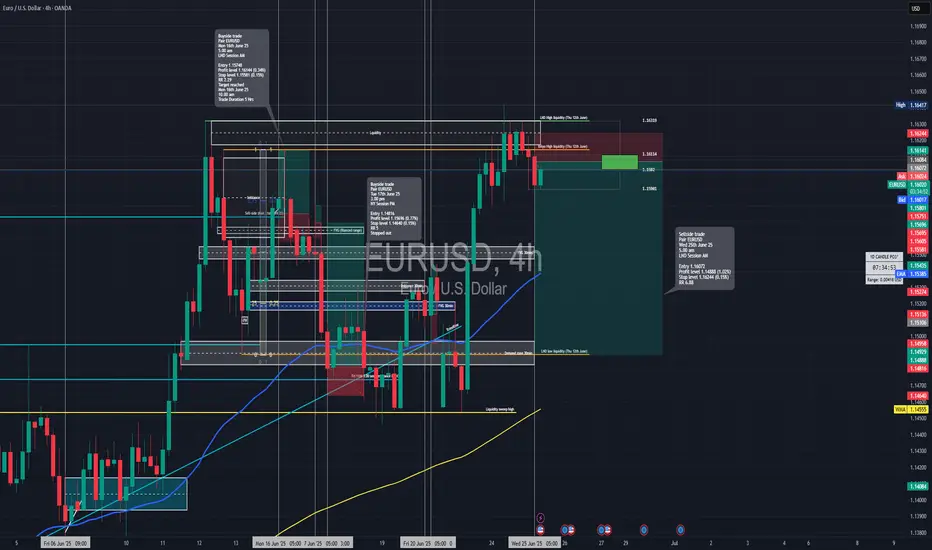
Short trade
4Hr TF overview
🔻 Trade Journal Entry – Sell-side Trade
📍 Pair: EURUSD
📅 Date: Wednesday, June 25, 2025 (You wrote June 15th — adjusted to match your current date sequence)
🕒 Time: 5:00 AM (London Session AM)
⏱ Time Frame: 4 Hour
📉 Direction: Sell-side
📊 Trade Breakdown:
Metric Value
Entry Price 1.16072
Profit Level 1.14888 (−1.02%)
Stop Loss 1.16244 (+0.15%)
Risk-Reward
Ratio 6.88 1
🧠 Context / Trade Notes:
4HR Premium Entry from Bearish OB:
Trade executed at the upper end of the internal range, where price tapped into a high-probability bearish order block.
London AM Stop-Hunt:
Price swept a prior London session high before rejecting, indicative of engineered liquidity and smart money distribution.
Break of Structure & Momentum Confirmation:
Following the sweep, price broke internal structure to the downside, confirming bearish intent.
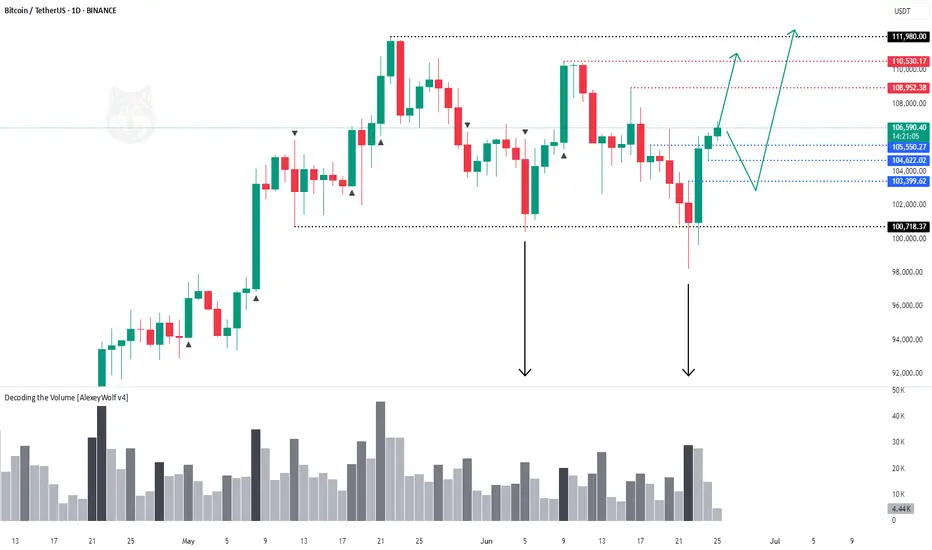
Bitcoin - overview with Initiative AnalysisHey traders and investors!
📍 Context
On the daily timeframe, the market is in a sideways range.
The boundaries are marked with black lines.
Buyer initiative is currently active.
Targets: 108,952; 110,530; 111,980.
📊 Key Actions
The seller attempted twice, on increased volume, to break down below the range, but both times the buyer brought the price back inside. Only seller wicks remained below the lower boundary.
🎯 Trade Idea
🔹 Look for long setups from 105 500 -104,622 or the 103,400–100,718 zone.
There is no context for short trades at the moment.
This analysis is based on the Initiative Analysis concept (IA).
Wishing you profitable trades!
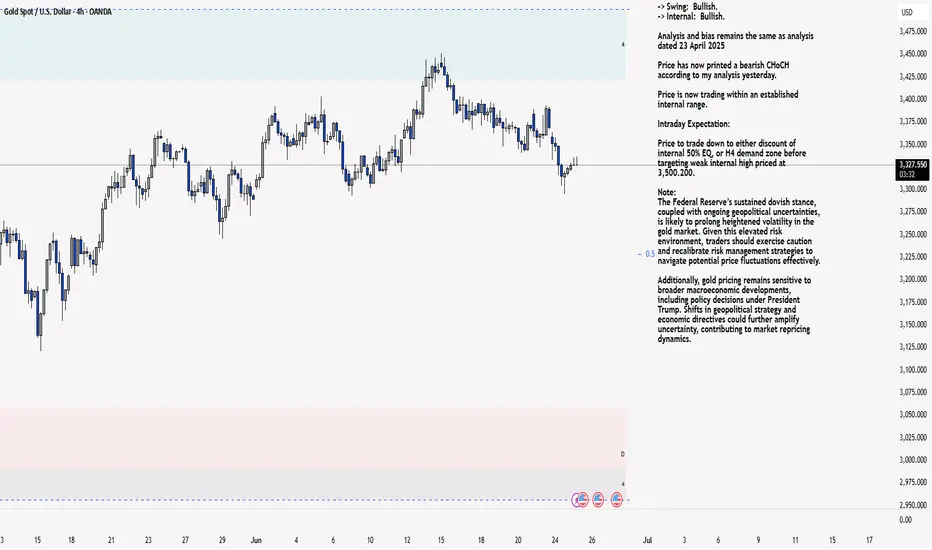
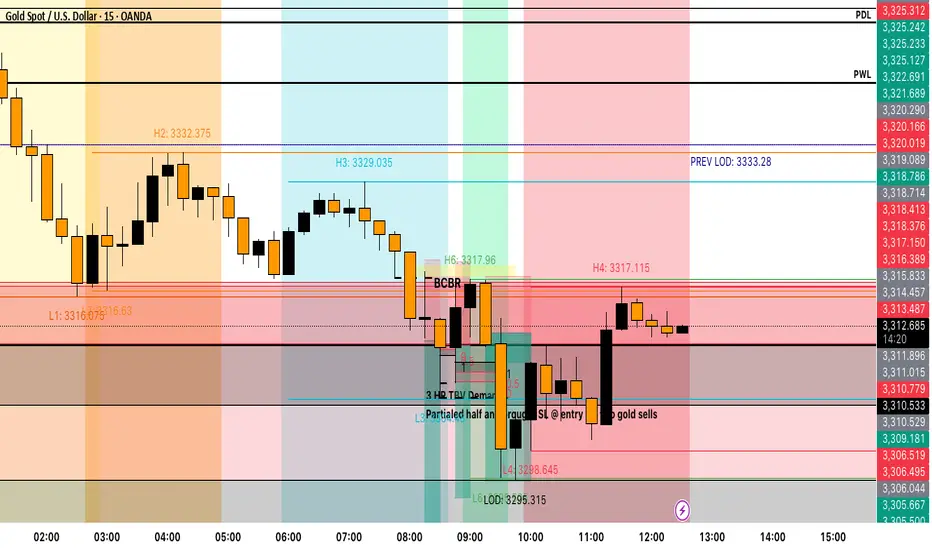
XAU/USD 25 June 2025 Intraday AnalysisH4 Analysis:
-> Swing: Bullish.
-> Internal: Bullish.
Analysis and bias remains the same as analysis dated 23 April 2025
Price has now printed a bearish CHoCH according to my analysis yesterday.
Price is now trading within an established internal range.
Intraday Expectation:
Price to trade down to either discount of internal 50% EQ, or H4 demand zone before targeting weak internal high priced at 3,500.200.
Note:
The Federal Reserve’s sustained dovish stance, coupled with ongoing geopolitical uncertainties, is likely to prolong heightened volatility in the gold market. Given this elevated risk environment, traders should exercise caution and recalibrate risk management strategies to navigate potential price fluctuations effectively.
Additionally, gold pricing remains sensitive to broader macroeconomic developments, including policy decisions under President Trump. Shifts in geopolitical strategy and economic directives could further amplify uncertainty, contributing to market repricing dynamics.
H4 Chart:
M15 Analysis:
-> Swing: Bullish.
-> Internal: Bullish.
Following previous high, and printing of bearish CHoCH, price has pulled back to an M15 supply zone, where we are currently seeing a reaction. Therefore, I shall now confirm internal high.
Price is now trading within an established internal range.
The remainder of my analysis shall remain the same as analysis dated 13 June 2025, apart from target price.
As per my analysis dated 22 May 2025 whereby I mentioned price can be seen to be reacting at discount of 50% EQ on H4 timeframe, therefore, it is a viable alternative that price could potentially print a bullish iBOS on M15 timeframe despite internal structure being bearish.
Price has printed a bullish iBOS followed by a bearish CHoCH, which indicates, but does not confirm, bearish pullback phase initiation. I will however continue to monitor, with respect to depth of pullback.
Intraday Expectation:
Price to continue bearish, react at either M15 supply zone, or discount of 50% internal EQ before targeting weak internal high priced at 3,451.375.
Note:
Gold remains highly volatile amid the Federal Reserve's continued dovish stance, persistent and escalating geopolitical uncertainties. Traders should implement robust risk management strategies and remain vigilant, as price swings may become more pronounced in this elevated volatility environment.
Additionally, President Trump’s recent tariff announcements are expected to further amplify market turbulence, potentially triggering sharp price fluctuations and whipsaws.
M15 Chart:
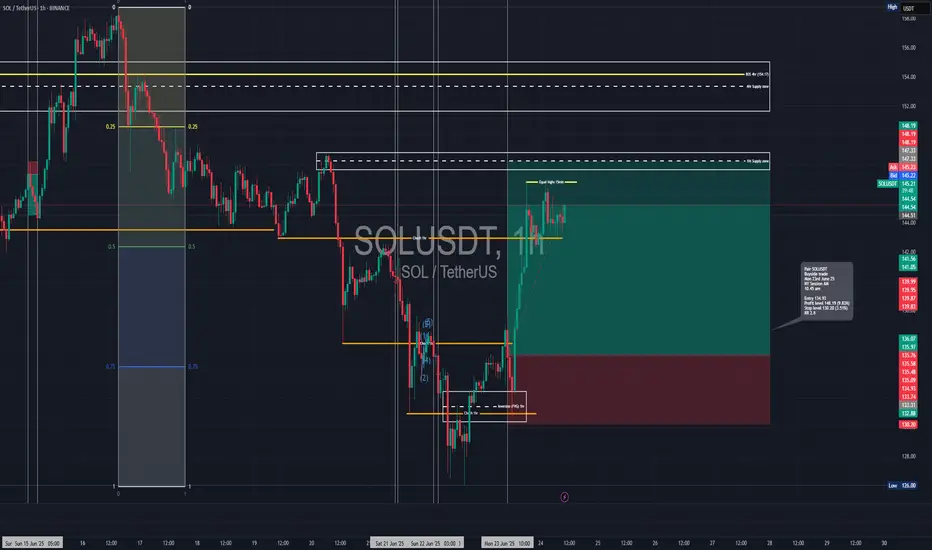
Long trade
🟢 Trade Journal Entry – Buyside Trade
📍 Pair: SOLUSDT
📅 Date: Monday, June 23, 2025
🕒 Time: 10:45 AM (NY Session AM)
⏱ Time Frame: Not specified (assumed 4Hr or intraday swing)
📈 Direction: Buyside
📊 Trade Breakdown:
Metric Value
Entry Price 134.93
Profit Level 148.19 (+9.83%)
Stop Loss 130.20 (−3.51%)
Risk-Reward
Ratio 2.80 1
🧠 Context / Trade Notes:
Range Expansion Setup:
4H Demand Tap / Rejection:
Price respected a previously unmitigated bullish OB near $130 before printing consecutive higher lows.
Volume Increase + Session Alignment:
The NY session entry coincided with a volume surge and expansion candle, indicating breakout momentum.
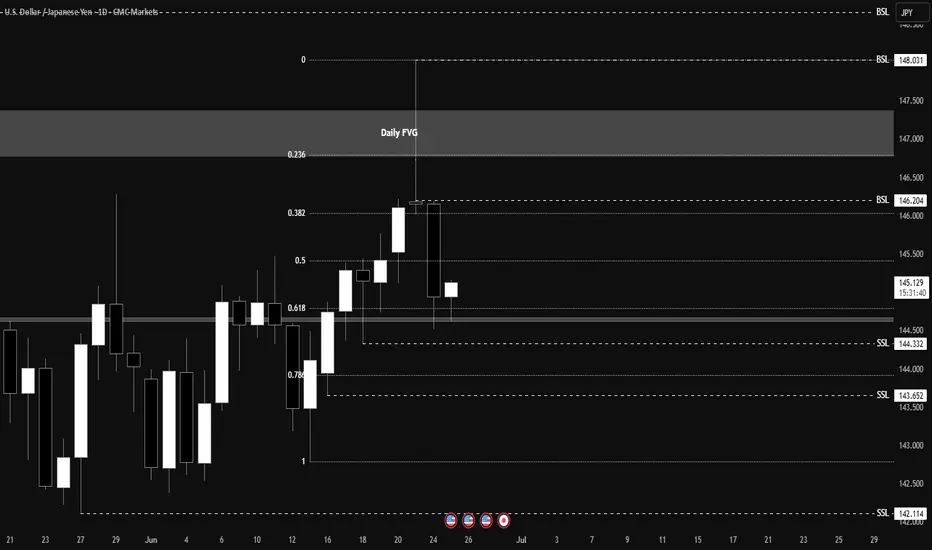
Looking for an immediate rebalance on USDJPY daily chartLooking for an immediate rebalance on USDJPY daily chart
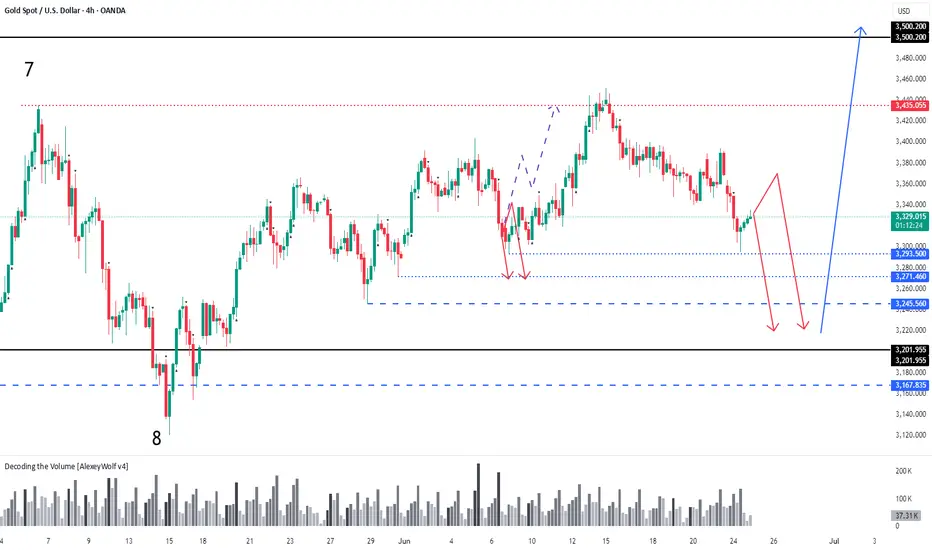
GOLD. Daily Timeframe overview with Initiative AnalysisHey traders and investors!
Daily Timeframe
Market phase : sideways. Seller's initiative.
Boundaries marked with black lines.
Gold followed an alternative scenario from the previous review toward 3435. The buyer played out the 8-9 vector of the range on the daily timeframe, and now the initiative has shifted to the seller. The seller's targets are 3245 and 3201 — areas to watch for potential buy patterns aiming for a new ATH. The price might get stuck in the 3293–3271 zone. If a strong buyer reaction occurs, a reversal may happen in this range.
The ideal area to look for buy patterns is around 3201.
Selling is risky.
This analysis is based on the Initiative Analysis concept (IA).
Wishing you profitable trades!
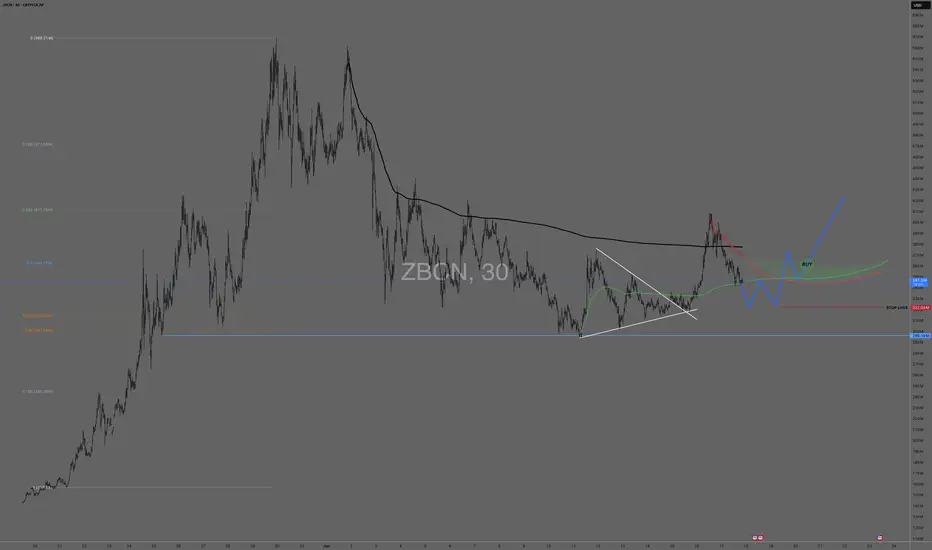
ZBCN: Looking for support to hold and AVWAP's regained
CRYPTOCAP:ZBCN
D/30m chart
We have had out first real pullback on the daily. It's holding the midline, held the GP. I played the break of the triangle on Sunday and took it to the ATH AVWAP (black). I'm wanting the same squeeze that threw that triangle north to hold as support now as buyers defend their positions.
I want to see a shake out below that green AVWAP, I want it to hold and proceed higher. then and only then do we stalk our entry.
I want a break and a pullback test of that red/green AVWAP. If I see that, its a buy on the other side of the "V".
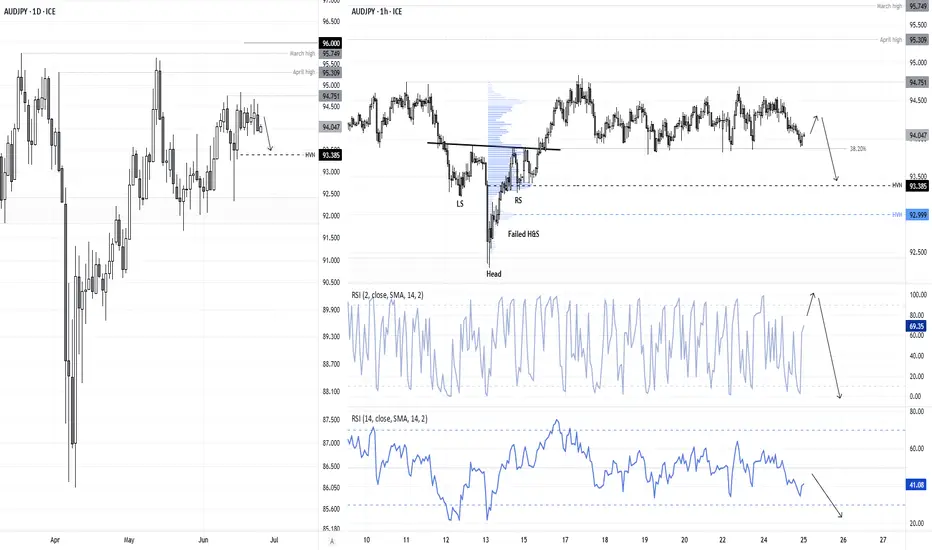
AUD/JPY at Risk of Breakdown as Bullish Momentum FadesAUD/JPY failed to follow through on a bullish breakout above 94.00, despite initial signs of strength from a bullish hammer and inverted H&S pattern. The pair has since printed a bearish engulfing candle on the daily chart to take prices near the lows of its range of the past week.
With the 1-hour RSI (2) hitting oversold levels, a minor bounce is possible, but risks remain skewed to the downside. A break beneath 93.70 would confirm a range breakdown and open the door to a deeper pullback towards the high-volume node (HVN) at 93.85.
Matt Simpson, Market Analyst at City Index and Forex.com.
XAUUSD Bullish OutlookThis chart captures a highly strategic bullish setup on XAUUSD, rooted in Smart Money Concepts (SMC) and institutional trading principles. The market has performed a major liquidity sweep, dipping below previous lows to collect resting sell-side liquidity before reacting sharply from a key demand zone.
Why Bullish? The Confluences:
Liquidity Sweep:
Price manipulated below a significant structural low to trap late sellers and activate institutional orders. This move into deeper liquidity suggests the smart money is building long positions.
Extreme P.O.I. + Demand Zone:
The blue zone marks a high probability reversal area where demand outweighs supply. This zone is validated by historical reactions and refined to align with an Order Block (OB) a clear footprint of institutional accumulation.
Bullish Structure Anticipation:
After the reaction, price is expected to form a series of higher highs and higher lows, confirming bullish market structure. Multiple resistance levels are in sight, each one representing an objective for price to reach in its journey upward.
Entry Point: $3,343 – $3,330
Located inside the OB and demand zone, this is where price is likely to build a base for upward continuation.
Stop Loss: Below $3,324
TP1: $3,363 (first internal structure break)
TP2: $3,375 (mid range target)
TP3: $3,383 (structural high retest)
TP Final: $3,405 (liquidity target above EQH)
Remember confirmation is key before execution.
#GOLD 2H Technical Analysis Expected Move.

Give It The Gas
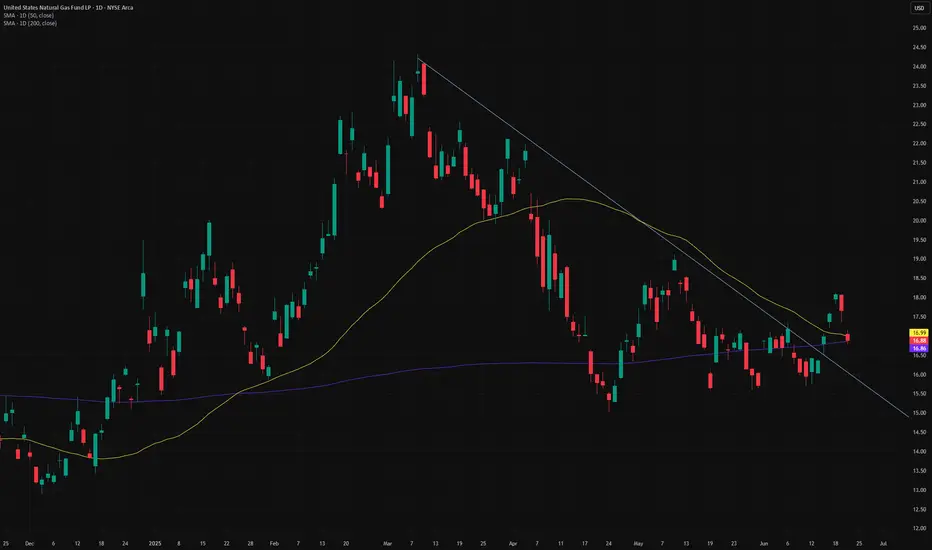
I've got a long Idea for the Henry Hub Natural Gas ETF, UNG.
After rising in late-2024/early-2025, UNG fell again (Mar-Jun), but recently (significantly) crossed above the trendline from that down move.
Time to look for a long position. But UNG is volatile - to reduce risk it's best to pick it up after a minor pullback. That seems to be happening now.
One thing I find useful when looking at an ETF backed by a commodity is to look at the chart for the underlying commodity future.
To be clear, I am NOT trading the future, only looking to it for (more) guidance.
In this case, for UNG, I chose the Aug Henry Hub Natural Gas contract (NGQ2025), which TradingView provides 10-minute delayed date for;
Here we see the trendline (light blue) is even stronger (i.e., more points of contact). In addition, the contract made a series of slightly higher lows (yellow line) before breaking through strong resistance at ~3.82 (a level which may now be providing support). Trendline breaks alone can be very flighty - they often don't work - so it helps to have other supporting factors (e.g., higher lows preceding, strong resistance breaks). And, not shown here but useful, UNG/NG is not overbought on the daily chart.
Now one could take a long position here, with a stop below the trendline, but I prefer my knives to at least slow down before I catch them.
Looking at the 4-hour chart for a reversal to enter;
A reversal and close above 3.92 would give a good entry point (using UNG), with a tighter stop at ~3.7 (or ~16.25 on UNG).
This is a "work in progress", so the actual trigger levels may change a bit. Or the whole setup could invalidate itself if the instrument(s) corrects back to at/below the trendline.
For targets, natural gas has resistance at 19.1 and again at 24.0 - best to trail a stop as UNG's price rises, bringing it up as each zone is hit.
For the long position, I anticipate an ITM option ~90 days out. I'm doing this in a taxable account, and for tax purposes UNG issues a K-1 to shareholders. I can do without the hassle. Option holders do not receive K-1's* (unless assigned), making tax reporting more routine.
Time to step on the gas?
*To the best of my knowledge - if any tax experts here know otherwise please drop a comment.
My ideas here on TradingView are for educational purposes only. It is NOT trading advice. I often lose money and you would be a fool to follow me blindly.
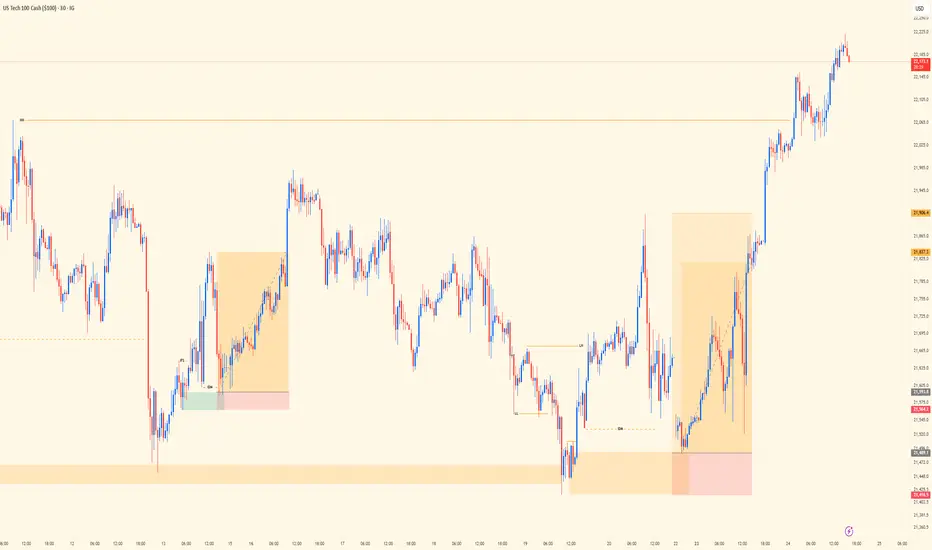
NASDAQ Midweek Review | Trend, Liquidity, PrecisionSingle-chart post today showing the execution trail behind two solid wins on NASDAQ.
Top-down bias was aligned — bulls clearly in control, so I stuck with trend direction. No need to fight momentum. As a trend trader, I don’t counter — that mindset shift alone is what keeps me consistent and clean with entries.
Chart shows the 30M view — where structure, liquidity, and timing came together. Both setups were built off elite structure reads. Liquidity played its part: manipulation, sweep, confirmation, and execution.
Bias: Bullish
HTF Alignment: Bullish trend continuation
Entry Frame: 30M precision
Key Insight: Liquidity isn’t noise — it’s narrative.
Mindset Note: Counter-trading is a shortcut to inconsistency. Stay with flow, respect structure.
Bless Trading!
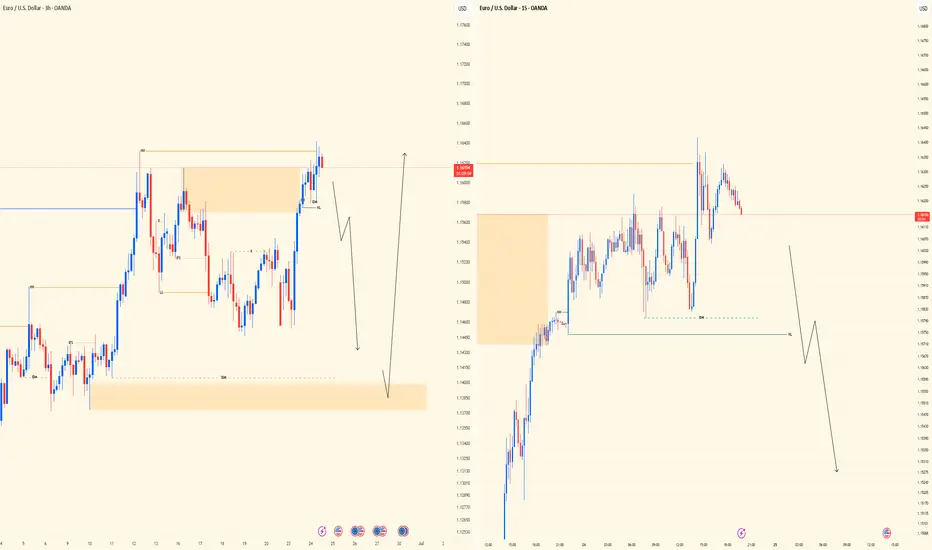
EURUSD Midweek Outlook | 3H - 15M Dual ViewLeft side chart shows the 3H Bird’s Eye structure — price swept the recent highs but failed to follow through, signaling external bull weakness. That shift in narrative tells me price may be prepping to drop, potentially targeting the SSL below before gathering fuel to attack major highs.
Right side zooms in on the 15M — I’m patiently watching for a clean lower high to break (CHoCH) followed by a pullback to confirm a sell entry. Until I get that proper LTF trigger, I stay on the sidelines. Execution always follows alignment.
Bias: Short
HTF Structure: 3H sweep of highs, showing weakness
LTF View: Waiting for 15M confirmation (break + retest)
Target: SSL below
Mindset Note: Trade what’s shown, not what’s felt. Stay sharp, stay patient.
Bless Trading!
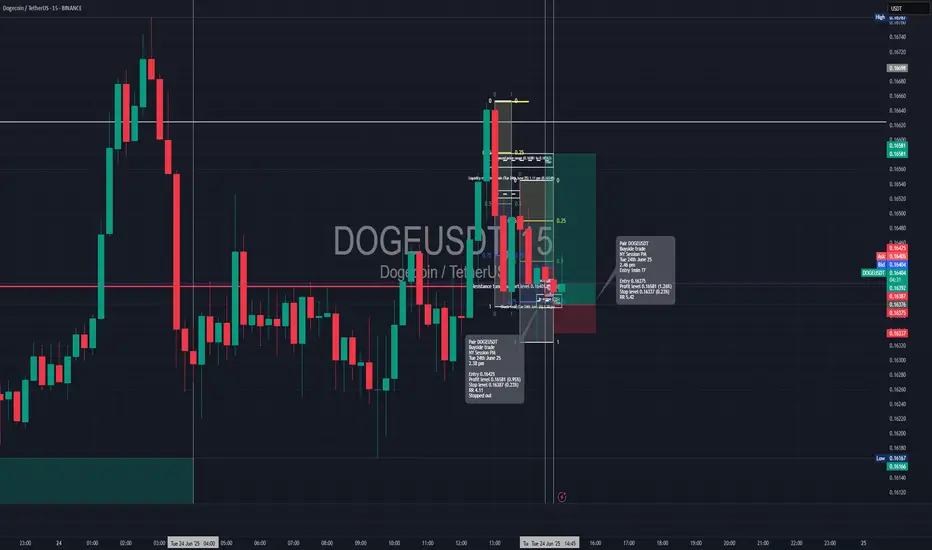
Long trade
📍 Pair: DOGEUSDT
📅 Date: Tuesday, June 24th, 2025
📈 Direction: Buyside
TIME: 2.45 PM (NY time)
NY Session PM
📊 Trade Breakdown:
Metric
Entry Price 0.16375
Profit Level 0.16581 (+1.26%)
Stop Loss 0.16337 (−0.23%)
Risk-Reward
Ratio 5.42: 1
🧠 Context / Trade Notes – ICT Inversion FVG Model
Fair Value Gap (FVG): The trade was executed based on ICT’s Inversion FVG model, where a previously bearish FVG was broken to the upside and then revisited as a bullish support zone.
🔍 Liquidity Sweep + Displacement:
Price swept a short-term sell-side low, triggering stops before sharply displacing upward, forming a bullish break in market structure and the FVG.
1min TF Entry
Midweek XAUUSD Insight | Dual View SetupPair: XAUUSD
Bias: Bullish
HTF Overview (Left Panel – 3H): Price action has been moving within bullish structure, with a major higher low currently holding strong. This HL is the key pivot I’m watching for continuation.
Refinement Zone (Middle – 30M): We’ve tapped into a 30M OB and are now sitting in mitigation territory. No signs of reversal yet, but the setup is maturing.
Entry Technique (Right Panel – 15M View): Just waiting for that classic Smart Money confirmation — LTF CHoCH, liquidity sweep, then return into OB. Will refine down to 5M for precise entry if price plays out clean.
Entry Zone: Waiting on confirmation around the OB zone
Target Zones: Based on HTF structure continuation
🧠 Mindset Note: Setup is solid, but patience wins. Let the story unfold — we only strike with clarity and precision.
Bless Trading!

Long trade
🟢 Trade Journal Entry – Buyside Trade
📍 Pair: DOGEUSDT
📅 Date: Monday, June 23, 2025
🕒 Time: 11:00 AM (NY Session AM)
⏱ Time Frame: 4 Hour
📈 Direction: Buyside
📊 Trade Breakdown:
Metric Value
Entry Price 0.15395
Profit Level 0.17081 (+10.95%)
Stop Loss 0.14844 (−3.58%)
Risk-Reward
Ratio 3.06 : 1
🧠 Context / Trade Notes:
4H Order Block Execution:
Entry triggered at the retest of a 4-hour bullish order block following price rejection and a bullish engulfing structure.

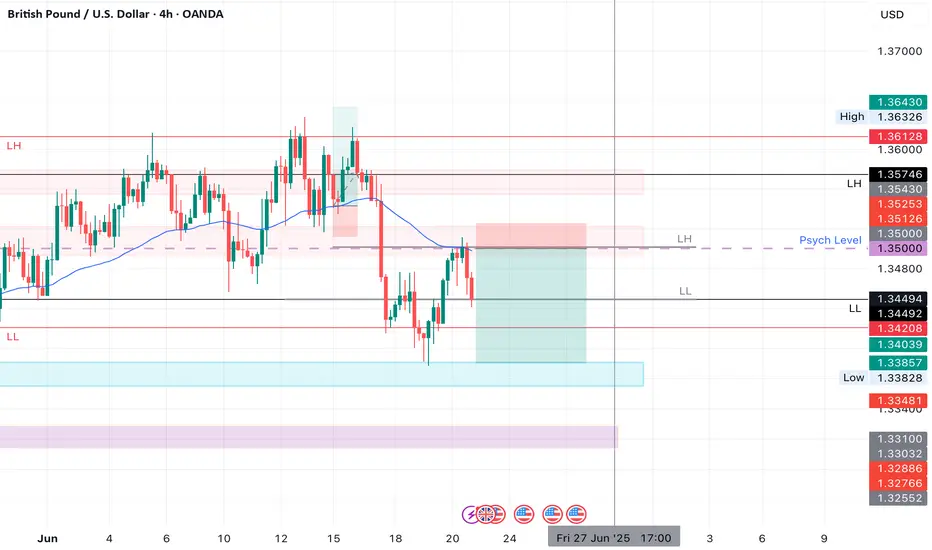
GBPUSD SHORT Market structure bearish on HTFs 3
Entry at Daily AOi
Weekly Rejection At AOi
Previous Weekly Structure Point
Daily Rejection At AOi
Previous Structure point Daily
Around Psychological Level 1.35000
H4 EMA retest
H4 Candlestick rejection
Rejection from Previous structure
Levels 4.52
Entry 110%
REMEMBER : Trading is a Game Of Probability
: Manage Your Risk
: Be Patient
: Every Moment Is Unique
: Rinse, Wash, Repeat!
: Christ is King.
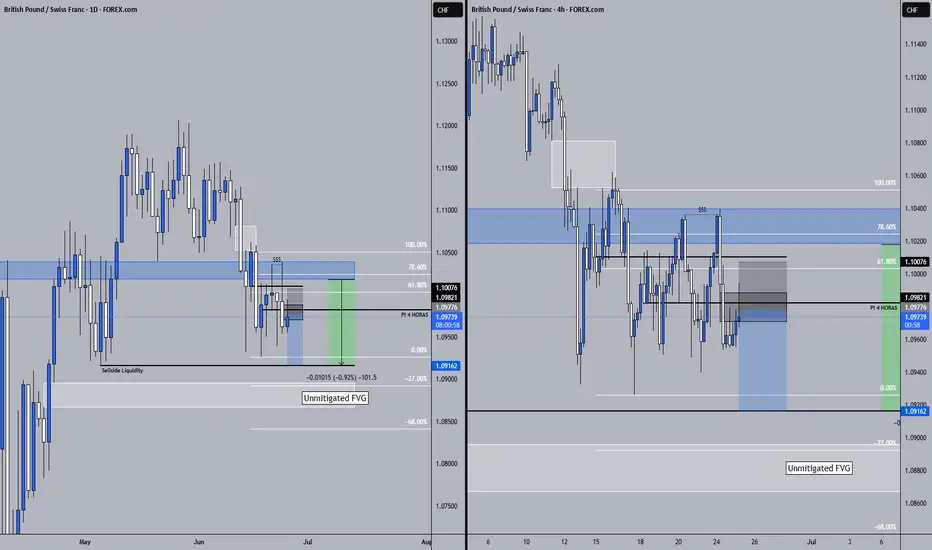
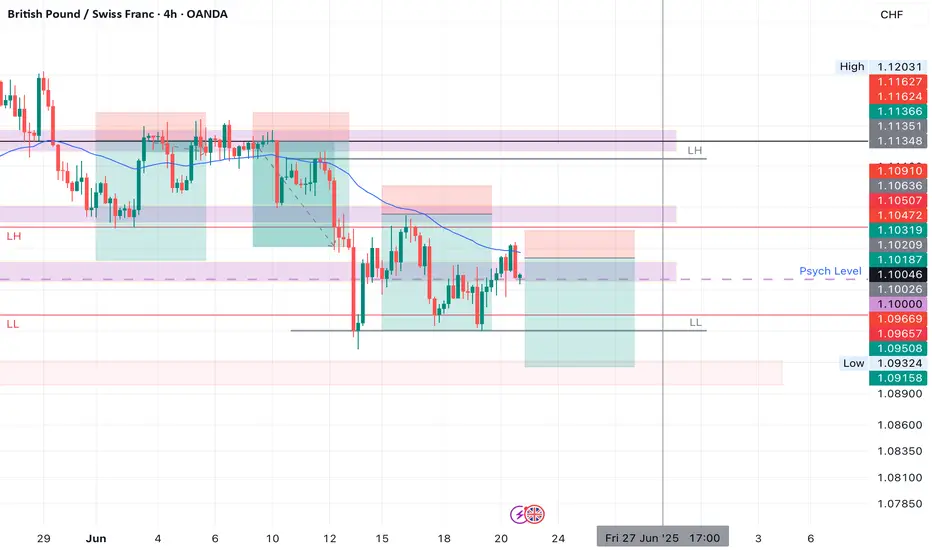
GBPCHF SHORT Market structure bearish on HTFs 3
Entry at both Weekly And Daily AOi
Weekly Rejection at AOi
Daily Rejection at AOi
Previous Structure point Daily
Around Psychological Level 1.10000
H4 EMA retest
H4 Candlestick rejection
Levels 4
Entry 100%
REMEMBER : Trading is a Game Of Probability
: Manage Your Risk
: Be Patient
: Every Moment Is Unique
: Rinse, Wash, Repeat!
: Christ is King.
xauusd sells this past pre ny/ nyse open Like and Comments would be appreciated :D Not Financial Advice, Just my outlook/opinion
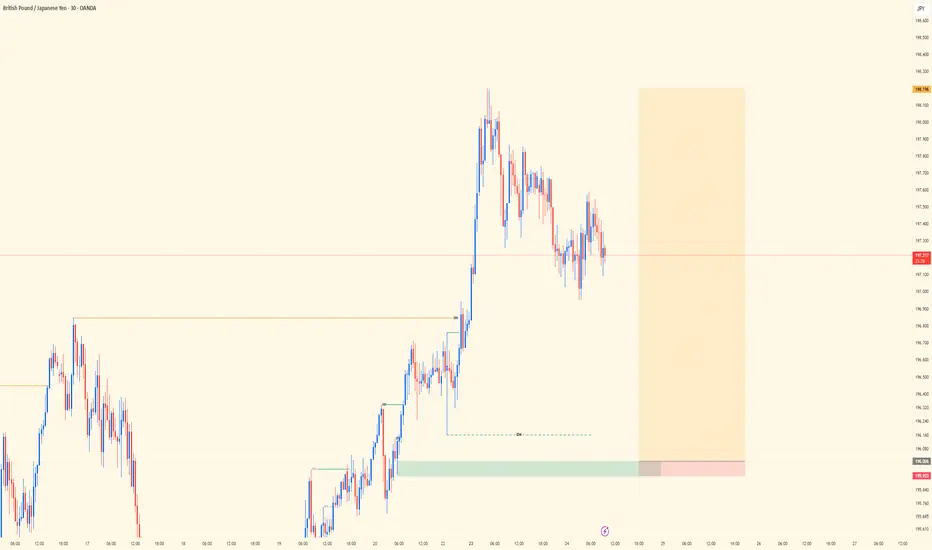
GBPJPY| Midweek OutlookEven though it’s midweek, I wanted to share an update on GBPJPY and walk you through the process so far.
Price has been showing clear bullish structure from the 4H down to the 30M, so I remained patient and waited for price to revisit and mitigate a bullish order block — and that’s exactly what we got.
Now that mitigation has played out, I’m watching closely for LTF confirmations to line up. Ideally looking for entry opportunities around 196.006 – 195.922, depending on how the lower timeframes react and confirm.
Not rushing anything — just executing based on structure, mitigation, and confirmation. I’ll continue updating as price develops.
#GBPJPY #SMC #OrderBlock #SmartMoneyConcepts #PriceAction #ForexTrading #GJSetup #MidweekOutlook #InducementKing #DayTrader
Bless Trading!
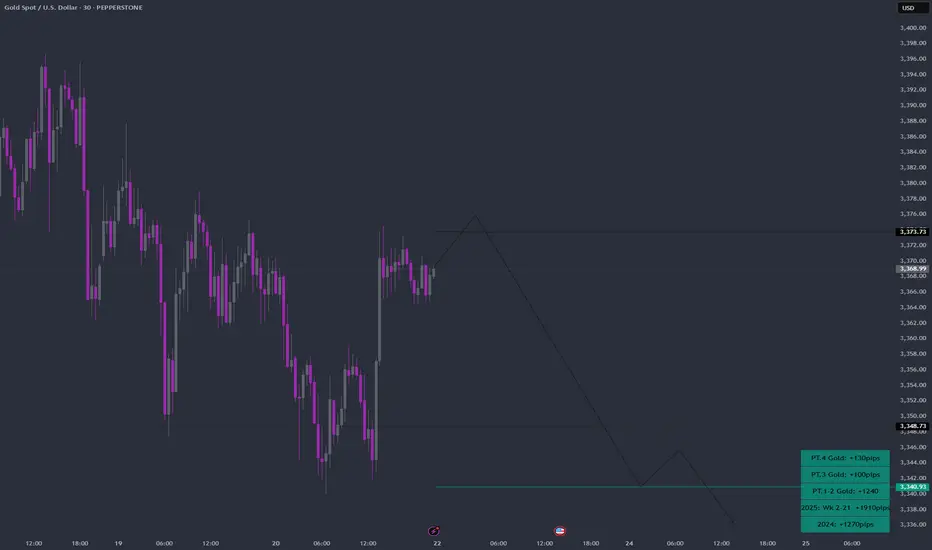
Everybody loves Gold Part 5Keeping it steady and reasonable
Part 5 weekly path is as shown.
Here's a breakdown of trading dynamics:
1. Expecting price to break past green line, level of significance (LOS) for continuation down
2. Price might bounce back for which; will be looking for a continuation from +50/+100 or +150pips to the downside
3. Will be looking for double tops/bottom along the way: Last week saw classic double top formed around level of significance (LOS)
As always price action determines trades
GBPUSD Sell - June, 24📍Context:
Reaction from Weekly & Daily OBs
Price tapped into a 4H OB
Asia low to fill
15m & 5m POIs showing clear rejection
Presence of wicks signaling slowdown + bearish engulfing confirming seller control
📍Entry:
Based on 15m imbalance left behind
SL placed above recent highs – structure still valid
🎯 TP:
Minimum 1:3 RR
Final target: Asia lows
