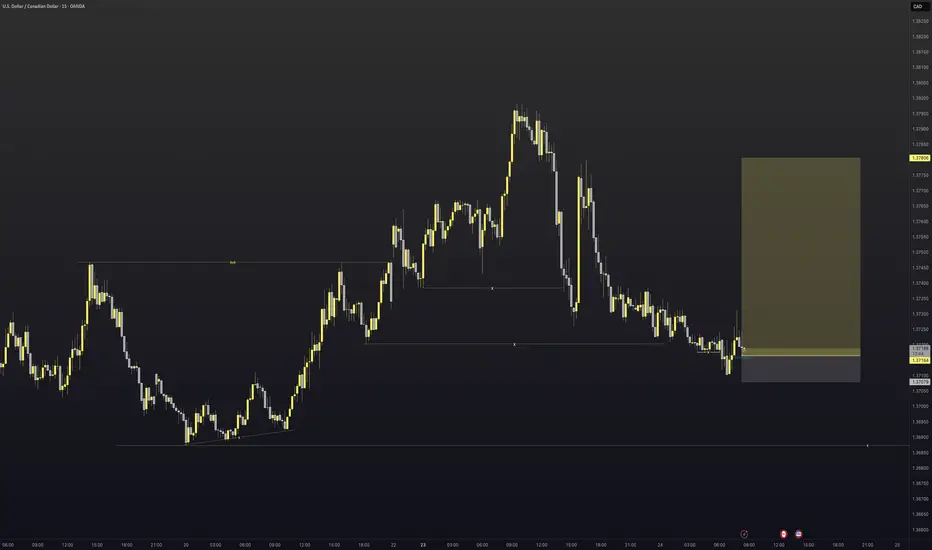
USDCAD - Long triggered We have entered into the discount area of the most recent swing point on USDCAD. With doing this we have taken out all the areas of liquidity within the trading range so it was time to look for potential long moves.
Now at current price we have had a great example of AMD where by we
Accumulate
Manipulate
and then the hope is that we begin to distribute higher.
There was also a nice fair value gap that was left behind on the 5min
So all that was left to do was execute.
Let us see how it plays out.
Win or lose great entry super happy with the trade. Lets see how it goes
Multiple Time Frame Analysis
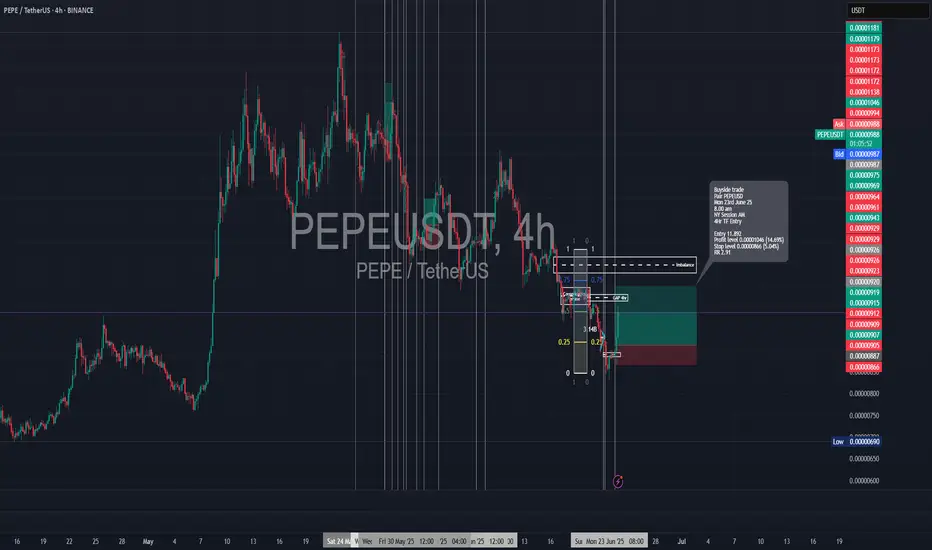
Long trade
📍 Pair: PEPEUSD
📅 Date: Monday, June 23, 2025
🕒 Time: 8:00 AM (NY Session AM)
⏱ Time Frame: 4 Hour
📈 Direction: Buyside
📊 Trade Breakdown:
Metric Value
Entry Price 0.00000912
Profit Level 0.00001046 (+14.69%)
Stop Loss 0.00000866 (−5.04%)
Risk-Reward
Ratio 2.91 : 1
🧠 Context / Trade Notes:
4H Order Block Entry:
The trade took off after a clear bullish order block formed, following a price tap into prior demand with a wick rejection.
Liquidity Grab Below Lows:
Price swept a 4H swing low before reversing, suggesting institutional accumulation below retail stops.
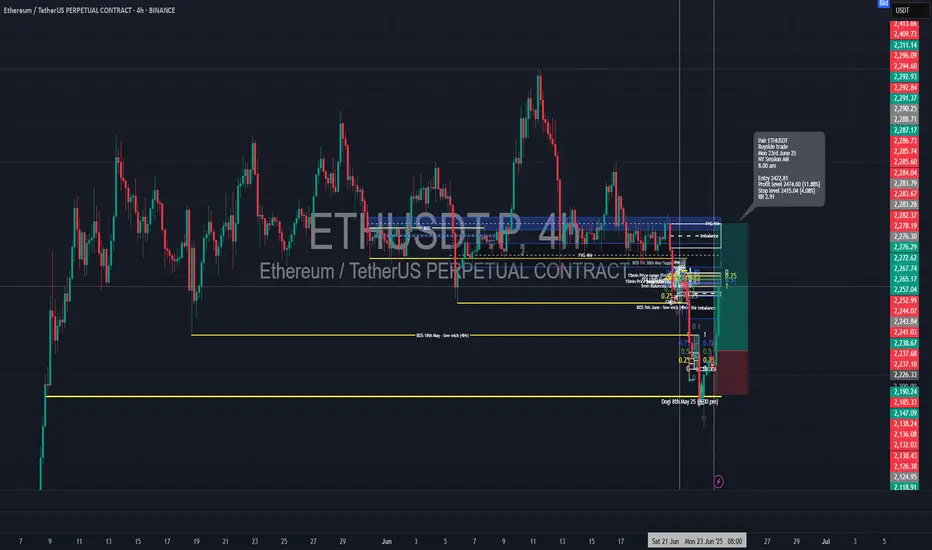
Long trade
🟢 Trade Journal Entry – Buyside Trade
📍 Pair: ETHUSDT
📅 Date: Monday, June 23, 2025
🕒 Time: 8:00 AM (NY Session AM)
⏱ Time Frame: (Assumed 4Hr TF)
📈 Direction: Buyside
📊 Trade Breakdown:
Metric Value
Entry Price 2422.81
Profit Level 2474.60 (+2.14%)
Stop Loss 2415.04 (−4.08%)
Risk-Reward
Ratio 2.91 : 1
🧠 Context / Trade Notes:
NY Session AM Execution:
Trade entered at the start of the New York session, aiming to capture directional momentum amid strong ETH volatility.
Liquidity Sweep Confirmation:
Clear stop-hunt below prior swing low sets up the reversal conditions
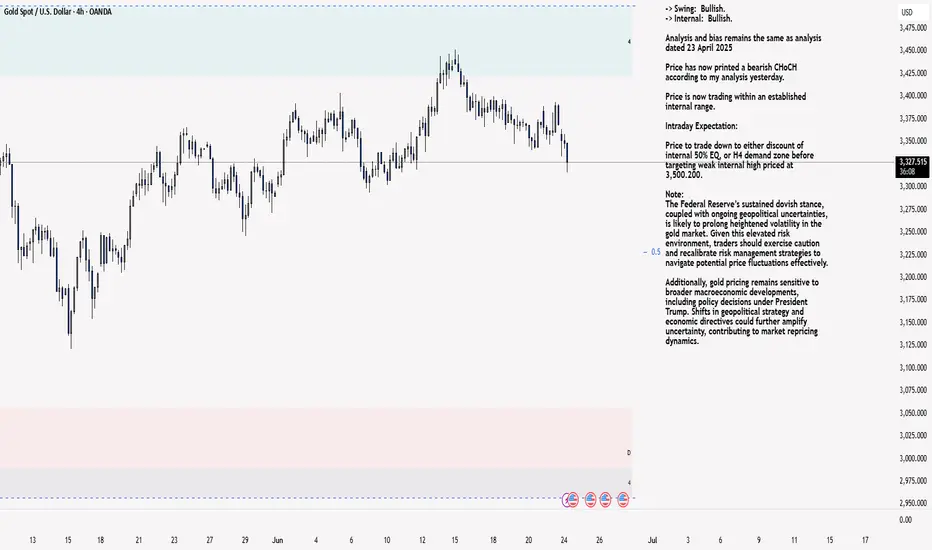
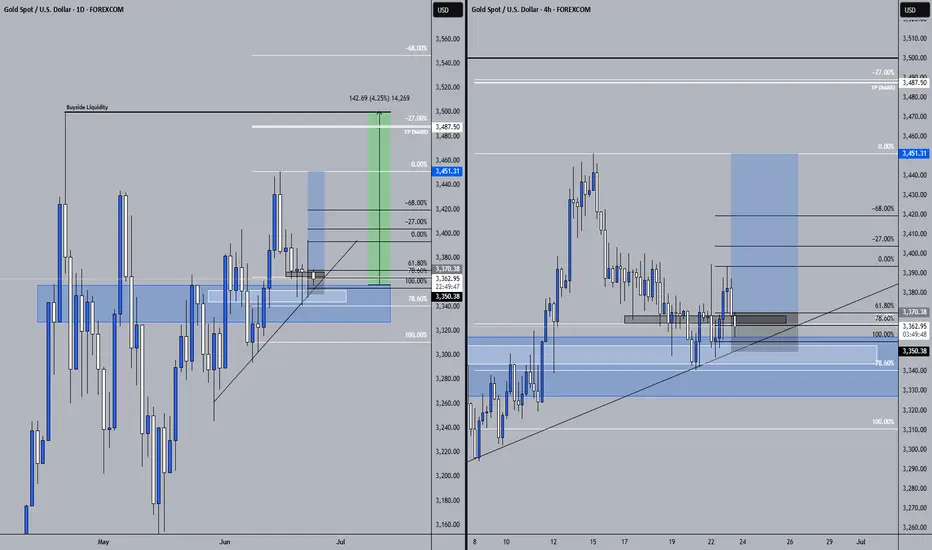
XAU/USD 24 June 2025 Intraday AnalysisH4 Analysis:
-> Swing: Bullish.
-> Internal: Bullish.
Analysis and bias remains the same as analysis dated 23 April 2025
Price has now printed a bearish CHoCH according to my analysis yesterday.
Price is now trading within an established internal range.
Intraday Expectation:
Price to trade down to either discount of internal 50% EQ, or H4 demand zone before targeting weak internal high priced at 3,500.200.
Note:
The Federal Reserve’s sustained dovish stance, coupled with ongoing geopolitical uncertainties, is likely to prolong heightened volatility in the gold market. Given this elevated risk environment, traders should exercise caution and recalibrate risk management strategies to navigate potential price fluctuations effectively.
Additionally, gold pricing remains sensitive to broader macroeconomic developments, including policy decisions under President Trump. Shifts in geopolitical strategy and economic directives could further amplify uncertainty, contributing to market repricing dynamics.
H4 Chart:
M15 Analysis:
-> Swing: Bullish.
-> Internal: Bullish.
Following previous high, and printing of bearish CHoCH, price has pulled back to an M15 supply zone, where we are currently seeing a reaction. Therefore, I shall now confirm internal high.
Price is now trading within an established internal range.
The remainder of my analysis shall remain the same as analysis dated 13 June 2025, apart from target price.
As per my analysis dated 22 May 2025 whereby I mentioned price can be seen to be reacting at discount of 50% EQ on H4 timeframe, therefore, it is a viable alternative that price could potentially print a bullish iBOS on M15 timeframe despite internal structure being bearish.
Price has printed a bullish iBOS followed by a bearish CHoCH, which indicates, but does not confirm, bearish pullback phase initiation. I will however continue to monitor, with respect to depth of pullback.
Intraday Expectation:
Price to continue bearish, react at either M15 supply zone, or discount of 50% internal EQ before targeting weak internal high priced at 3,451.375.
Note:
Gold remains highly volatile amid the Federal Reserve's continued dovish stance, persistent and escalating geopolitical uncertainties. Traders should implement robust risk management strategies and remain vigilant, as price swings may become more pronounced in this elevated volatility environment.
Additionally, President Trump’s recent tariff announcements are expected to further amplify market turbulence, potentially triggering sharp price fluctuations and whipsaws.
M15 Chart:
XAUUSD 23/06/2025Weekly:
-Price keeps making HH's.
-Bullish M pattern.
-IC.
Daily:
-Bullish M pattern.
-Inverse H&S pattern.
4H:
-Bullish M pattern.
-Inverse H&S pattern.
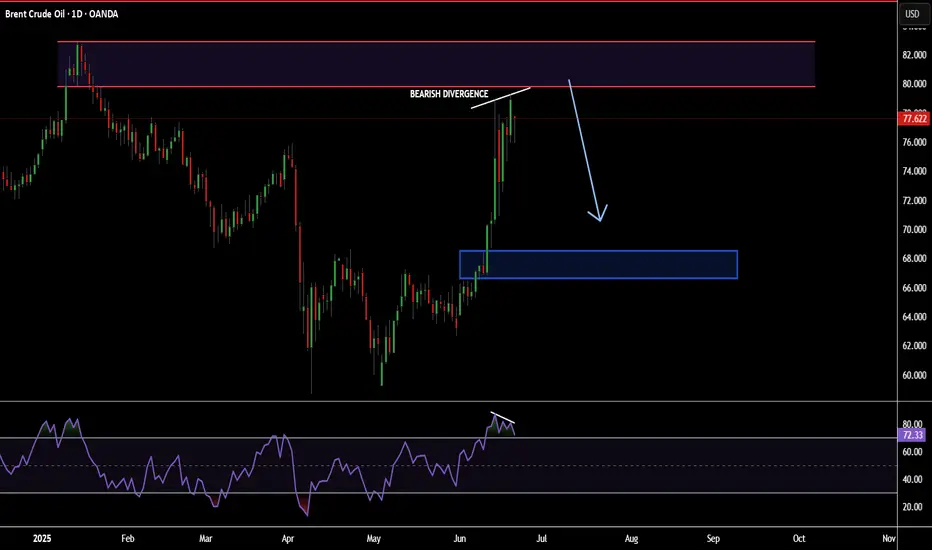
POTENTIAL SHORT OPPORTUNITY ON BRENT CRUDE OIL...SWING TRADEHey hey TradingView community!!! Hope you guys are doing amazing and having an amazing weekend! Just wanted to come make a post on a counter-trend trade I potentially see here on Brent Crude Oil. So put your seat belts on and let's dive in!!
OK so first thing first. Oil has recently seen a huge run in price from 63-80 a barrel so obviously a dramatic increase in price & USUALLY when we see these very strong decisive moves in an asset there is usually a corrective period in prices because that is how supply & demand and how markets works :) OK so let's now go to the technical reasoning!
1. Weekly price overextended/ RSI overbought
2. Daily momentum of buyers slowing down/ Bearish Divergence forming
3. Sitting around a weekly fib level
4. Hourly's lining up with this bias also mainly momentum
Very simple setup and potential here! May have to wait for that buyer to die out/ slow down a little more but keep eyes out for this move. Obviously trading against the trend is a little more "risky" but stay patient and let's see how it plays out!
Cheers!
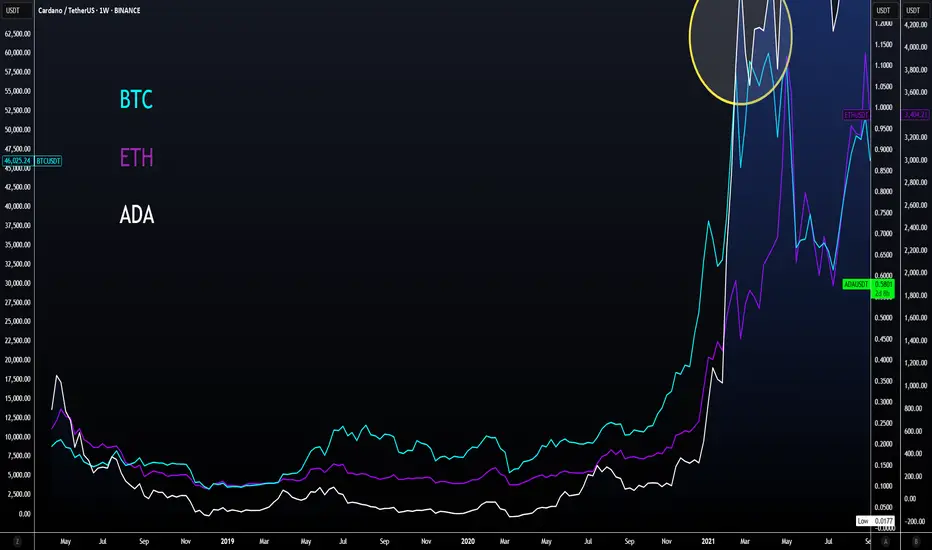
ADA | BTC | ET | Why ALTSEASON is COMING SOONAfter a -34% retracement, ADA is ready to go higher alongside with the rest of the alt market.
We see a very interesting phenomena here, were ADA also represents a large part of the larger alts: BTC pulls back, ETH is starting to increase or trades sideways (before the increase) whilst the alts dip.
This is actually BULLISH for alts, showing the very clear rotation between BTC, ETH and top 15 alts.
If we look at the macro of ANY of the alts I've been working through recently, a similar pattern appears - a clear bottom, followed by a sideways trade. This is usually the point just before the big ALTS season.
We actually see this pattern at the end of the 2018 rally, as well as after the 202- Covid dip:
The bottom line -
ADA and other alts are gearing up for their ALTSEASON. With patience, we will soon see some great gains across the markets.
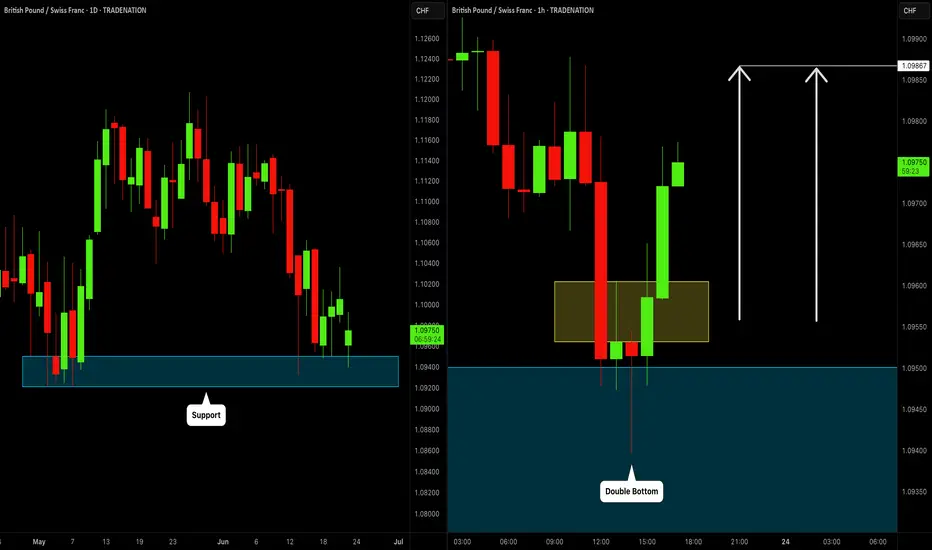
GBPCHF: Pullback From Support 🇬🇧🇨🇭
GBPCHF is going to pull back from a wide daily support cluster.
I see a strong intraday bullish confirmation and a bullish
imbalance candle after the news.
Goal - 1.0986
❤️Please, support my work with like, thank you!❤️
I am part of Trade Nation's Influencer program and receive a monthly fee for using their TradingView charts in my analysis.
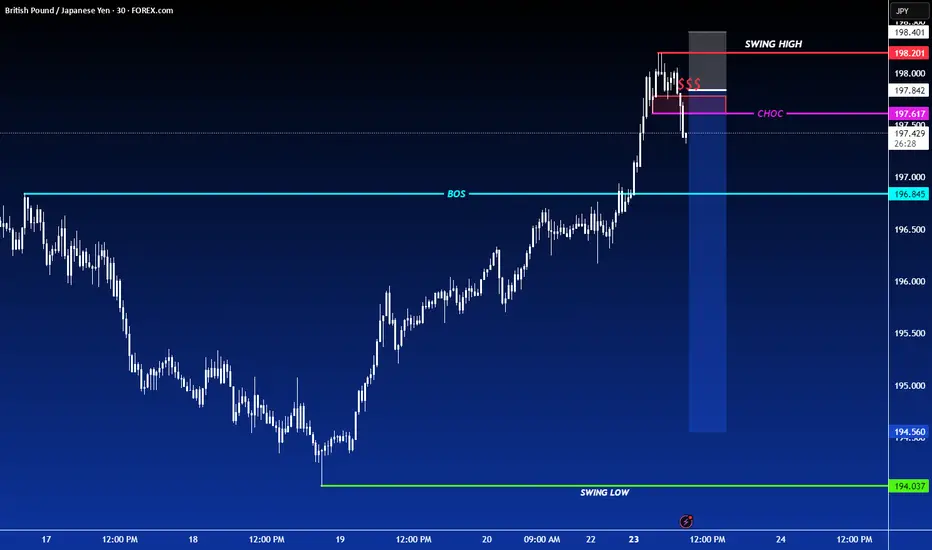
SHORT ON GBP/JPYGJ has given us a CHOC (change of character) on the Lower timeframes breaking a strong low.
I will be selling GJ to the next demand level basically catching the pullback to its overall UPTREND.
looking to catch 200-300 pips this week.
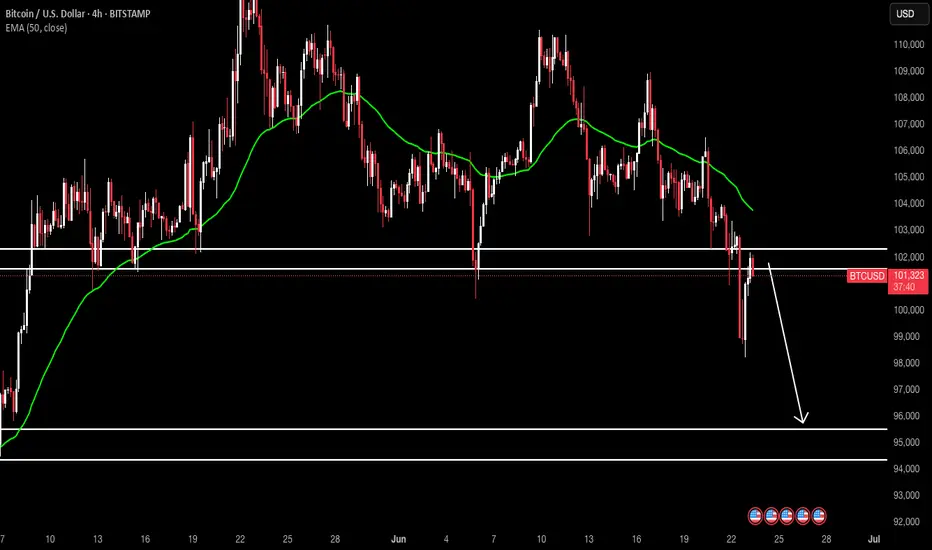
BTCUSD SELLSMajor H4 zone has been broken and retest is being made. Possible for price to continue further down to next support zone around 96,000
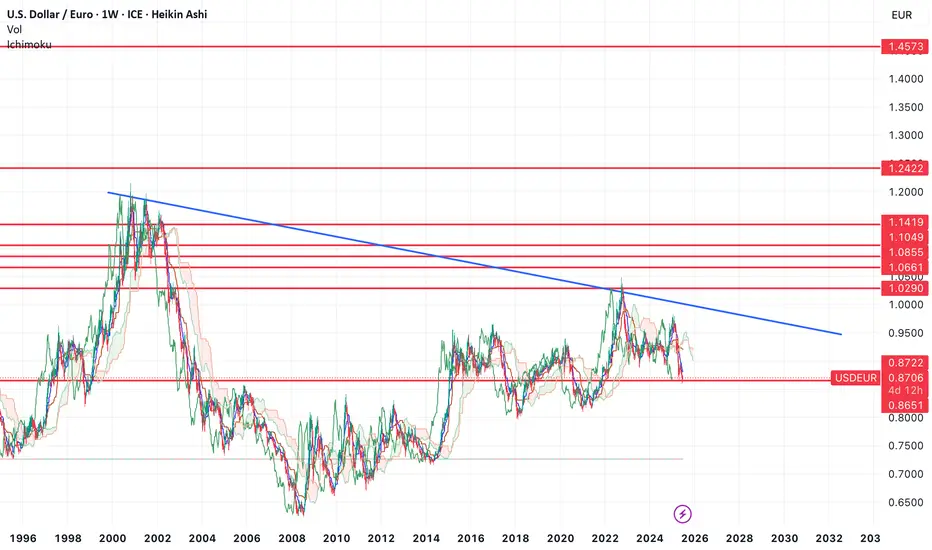
Bottom in for the dollar against the EuroI know many people are calling for the decline of the dollar and to invest in Europe, but the chart shows a different picture.
The chart shows that the dollar has bottomed against the Euro and looks set to make a run at the highs.
I think over the coming months/years, the dollar will go back above par against the Euro and will likely outperform the Euro for the coming years.
The recent decline in the dollar was just to backtest support, and now that we have done that, I think the bottom is in.
Breaking above the trend line should accelerate the bullish move.
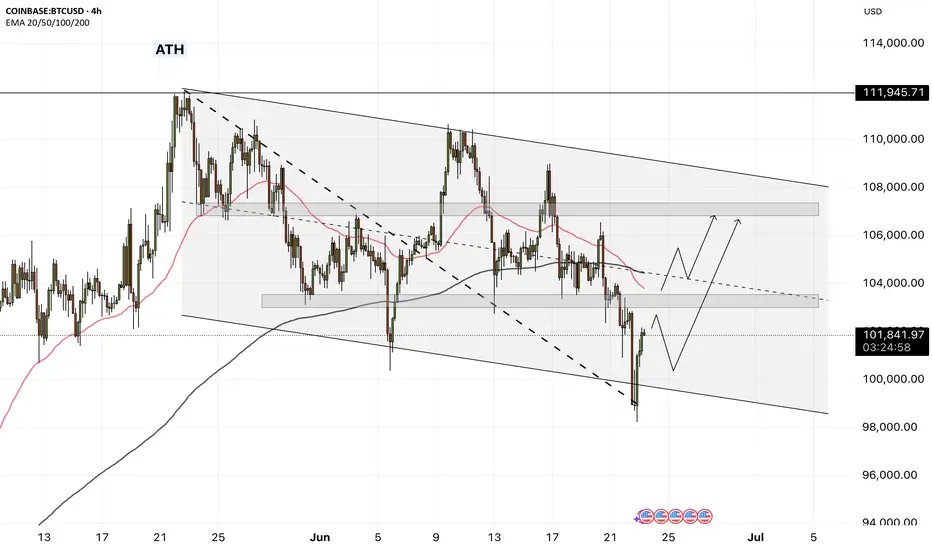
Bitcoin - Will Bitcoin Lose $100K Support?!On the four-hour timeframe, Bitcoin is below the EMA50 and EMA200 and is in its short-term descending channel. One can look for buying opportunities for Bitcoin from the channel bottom. If the resistance level is broken, the path to the rise and its reach to the level of $107,000 will be prepared for Bitcoin.
It should be noted that there is a possibility of heavy fluctuations and shadows due to the movement of whales in the market, and capital management will be more important in the cryptocurrency market. If the downward trend continues, we can buy within the demand range.
Bitcoin has been in the spotlight again in recent days, especially as its price fluctuates within the psychologically important range of $101,000-$102,000 and its fundamental indicators are sending mixed signals.
The first and perhaps most important element in Bitcoin’s fundamental analysis is the accumulation trend by large financial institutions and corporations. According to data published by websites such as CoinShares and the Financial Times, more than $87 billion worth of Bitcoin is currently held by companies such as MicroStrategy, Tesla, Block, and ETFs, which is approximately 3.2% of the total BTC supply in circulation. This clearly shows that Bitcoin has established itself as a store of value in the portfolios of professional investors, although there is still no consensus on its function as a “digital gold”.
In this regard, analysts such as Román González of A&G have predicted that Bitcoin could reach the $200,000 range by the end of the year; on the other hand, some more conservative analysts such as Jacqui Clarke believe that Bitcoin still lacks measurable intrinsic value and should not be viewed solely as an alternative asset. This conflict of views shows the depth of complexity in analyzing Bitcoin.
From the perspective of onchain, or intra-network data, the picture looks a little more cautious. The volume of active addresses last week was in the 1.0-1.1 million range, which is lower than in previous bullish periods (such as late 2021). Also, the MVRV (Market Value to Realized Value) index, which measures the potential profit potential of investors, fell slightly from 2.29 to 2.20, indicating that the market is somewhat cooling off from the short-term heat. Also, on June 22, more than 5,200 Bitcoins were removed from exchanges, which is usually a sign of long-term accumulation and a decrease in short-term selling pressure. On the other hand, Bitcoin’s behavior in the face of geopolitical crises shows signs of a change in the dominant market narrative. During the recent tension between Iran and Israel, Bitcoin fell by nearly 4%, unlike gold, which experienced significant growth. This challenges the assumption that Bitcoin is a “hedging” or “safe haven” asset and shows that BTC is still registered more as a risk-on asset in the minds of market participants. This is considered very important as investors look for tools to hedge inflation or protect against economic shocks. In terms of correlation with traditional markets, Bitcoin is also on a path to further integration with classic assets. The 30-day correlation index between Bitcoin and the S&P500 is now around 0.78, and academic studies predict that the correlation will grow to 0.87 at some point in 2024. This means that Bitcoin’s movements are more aligned than ever with the Federal Reserve’s monetary policy, interest rates, stock market conditions, and global liquidity flows. Therefore, in the current situation, the impact of US macro data or central bank decisions plays a decisive role in Bitcoin’s volatility.
Finally, Bitcoin price prediction models in recent days also reflect this complexity. Websites such as Bitfinex, Changelly, and analysts from institutions such as Brave New Coin have estimated that Bitcoin could reach the $125,000-$135,000 range this summer if macroeconomic conditions remain stable, and even if institutional capital continues to flow and there are no macro crises, reaching $150,000 by the end of the year is not out of the question. However, such scenarios require maintaining the current level of liquidity in the market, the absence of drastic tightening measures by the Federal Reserve, and the control of geopolitical risks.
In short, Bitcoin is in a situation where, on the one hand, its supporting fundamentals are stronger than ever; With institutional inflows, accumulation of long-term addresses, and reduction of inventory on exchanges. On the other hand, the market remains highly vulnerable to macroeconomic and political risks and continues to show volatile reactions.
This situation has led to Bitcoin becoming not only a speculative tool or growth investment, but also gradually becoming a part of professional portfolios with a carefully composed risk management mix. Its medium-term outlook is positive, but with one important condition: stability in global inflation and continued institutional capital flows.
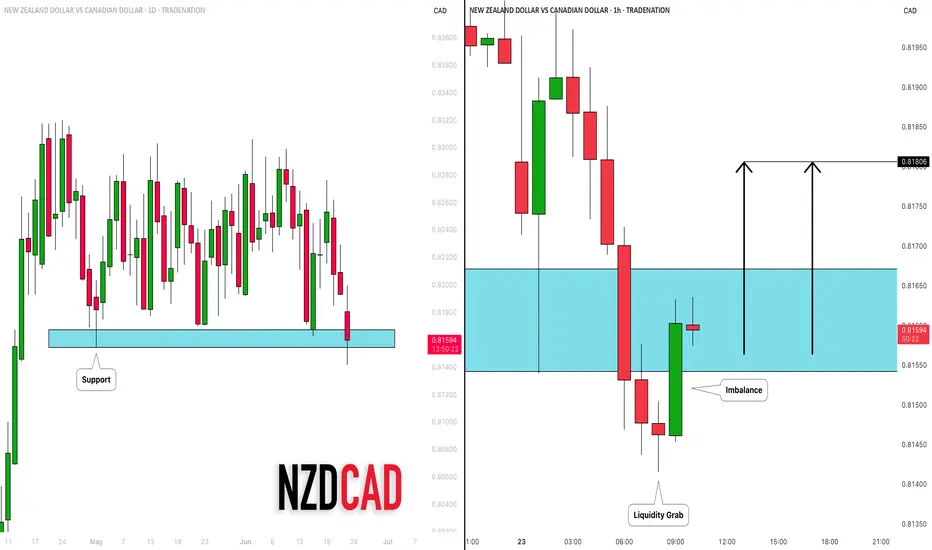
NZDCAD: Confirmed Bearish Trap?! 🇳🇿🇨🇦
There is a high chance that NZDCAD will bounce
after a false violation of a significant daily support cluster.
A formation of a bullish imbalance candle on an hourly time frame
leaves a strong bullish clue.
Goal - 0.818
❤️Please, support my work with like, thank you!❤️
I am part of Trade Nation's Influencer program and receive a monthly fee for using their TradingView charts in my analysis.
Is Alt season dead? - June 2025Let me start by saying, Youtube influencers are lying to you. The collective narrative (from those links shared with me) talk almost exclusively about the same set of narratives for triggering “alt season”:
M2 money supply. The printer will be turned on any minute.
The FED is going to cut rates, the market will then explode.
Institutions are buying the dip! “Blackrock fills Ethereum long positions” etc
A dollar collapse.
The real season begins in 2026, stack now!
It is the same rubbish time and time again. Rarely will one of those influencers << Look left << to tell you the News as it is written on the chart.
Let me tell you the News…
The highly anticipated "alt season," where alternative cryptocurrencies (alt coins) significantly outperform Bitcoin, faces considerable challenges to deliver the much awaited “alt season” where everything blows up. However I’ve long argued those days are behind us, we’re not going to see an “alt season” again, at least not in the sense many understand the term "alt season".
Alt season refers mainly to those tokens that reside outside the top ten crypto tokens. The total market cap of this cohort outside the top 10 is referred to as INDEX:OTHERS total, as is shown in the main chart. Now I’ve long argued corrections for Ethereum to $700 and below, Litecoin to $20 and lower, generally legacy tokens should perform the worst during this bull market, that outlook does not change.
Why so pessimistic?
Headline 1 - Support and resistance
It is that simple. look left. Each alt season closed a monthly candle above the monthly 7 SMA and monthly 10 SMA (Green areas) before getting underway. Not only has this not happened during this bull market, support from the rising channel has failed and if the current monthly candle closes as it (in 7 days), then past support shall confirm as resistance. This would mean a collapse back to the 2017 market top of circa $50 billion.
Headline 2 - Bitcoin halving
The truth is “alt season” began in May 2024, that is if you’re a believer in the halving cycles. If you’re a believer then you must accept this bull market comes to an end in 90 days.
The orange vertical lines represent each Bitcoin halving, occurring in August 2016, June 2020, and lately May 2024. The so called “alt season” would follow the halving for a 518 day period. There is only 90 days left for alt tokens to do their stuff before this cycle comes to an end. However, influencers only seem to talk about how great 2026 is going to be and how now is the time to start stacking. Instead 2025 is really going to create a whole new number of bag holders of dead projects.
Headline 3 - The number of circulating tokens
In January 2017 there was 8885 tokens, the good ole days.
June 2020, still only 19,500 tokens
Fast forward to June 2025 and we have 17.45 million tokens. Utterly ridiculous.
The sheer proliferation of alt coins, now numbering in the millions, creates an overwhelming supply that far outstrips demand. This fragmentation of liquidity means that even when some tokens see brief pumps, it's often selective with only a handful of projects having strong narratives or specific utility that truly thrive.
The simple truth is the market must kill off millions of those dud projects to free liquidity to the few that matter. If you really must know where the money is going to come from that causes growth in the remaining winners, it is from the realisation that a number of those projects are dead. That includes projects such as Ethereum and Litecoin. Both those charts share an important distinction no one wants to talk or hear about.
There are projects out there that’ll buck the trend, do you know which ones they are?
Not everything will collapse to zero.
Ww

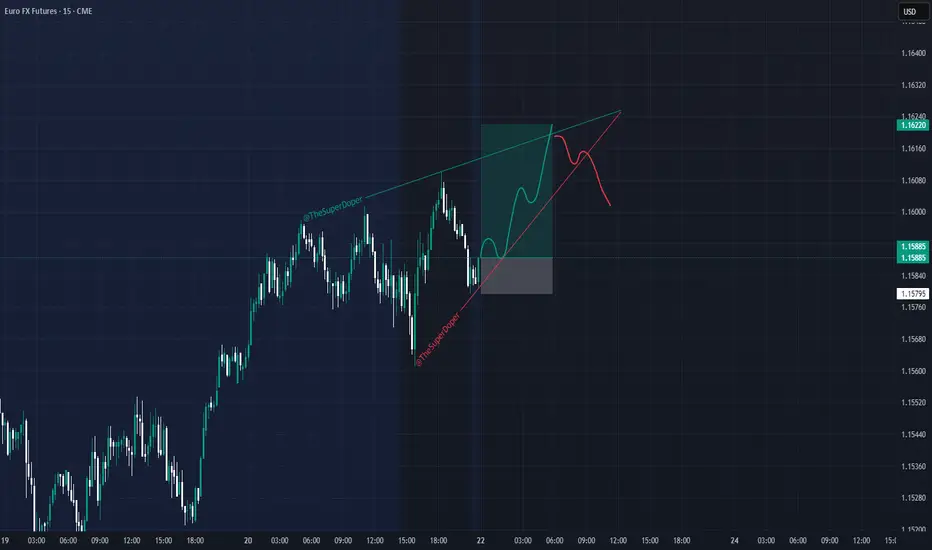
Euro FX Futures (6E1!)Look for bullish entry around the red trendline, targeting breakout above wedge — but be ready for a reversal if price gets rejected near 1.1620 and breaks back inside.
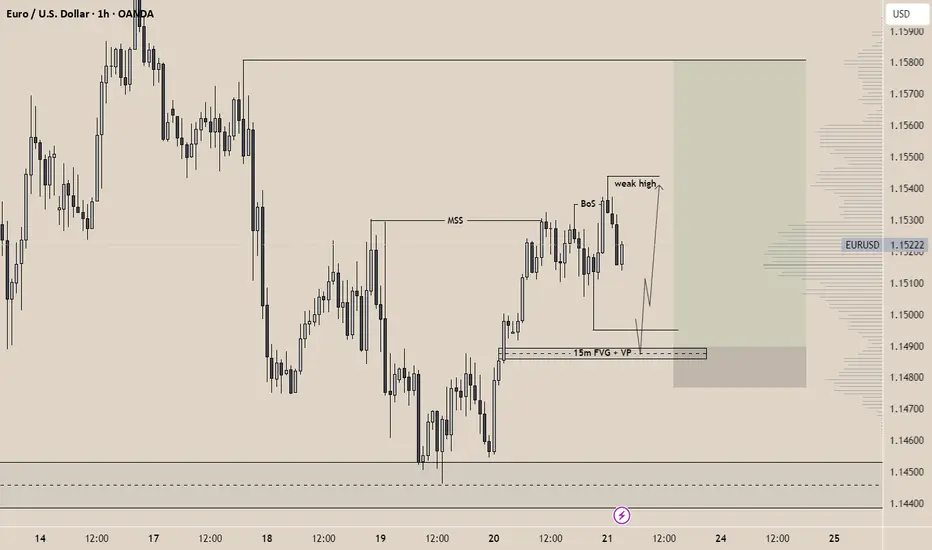
EURUSD -> Bullish Idea 22/06/2025(ICT x Volume Profile)OANDA:EURUSD 🎯 Bias: Bullish
🕒 Timeframe: H1 primary, H15 confirmation
Happy sunday traders!
Following President Trump’s strikes on Iran, I expect an initial bearish reaction in the Asian and London Sessions, then a bullish reaction in the NY sessions as sellers push the USD lower. However, the prevailing trend context remains bullish: the hourly chart has shifted structure (MSS) and broke structure to the upside. I anticipate a liquidity sweep below the recent lows, before a retracement into the 15-minute fair value gap (FVG) which aligns with the volume profile, then continuation higher to target the weak high and into the swing highs marked.
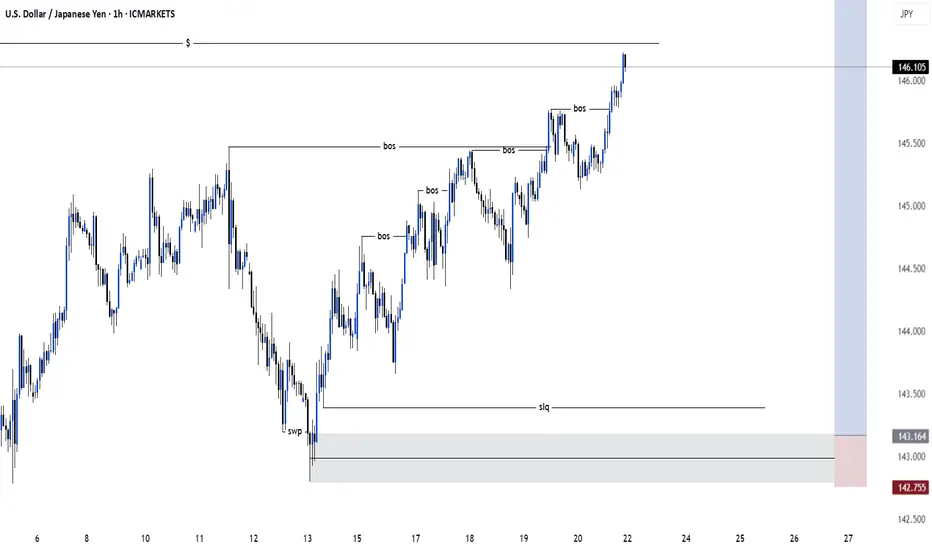
USDJPY: buy to sellstructure: range
liquidity: from weak swings to structural liquidity
orderblocks: demand and supply point of interests
Weekly Forex Outlook Sun.June.15.2025 - Fri.June.20.2025Like and Comments would be appreciated :D Not Financial Advice, Just my outlook/opinion

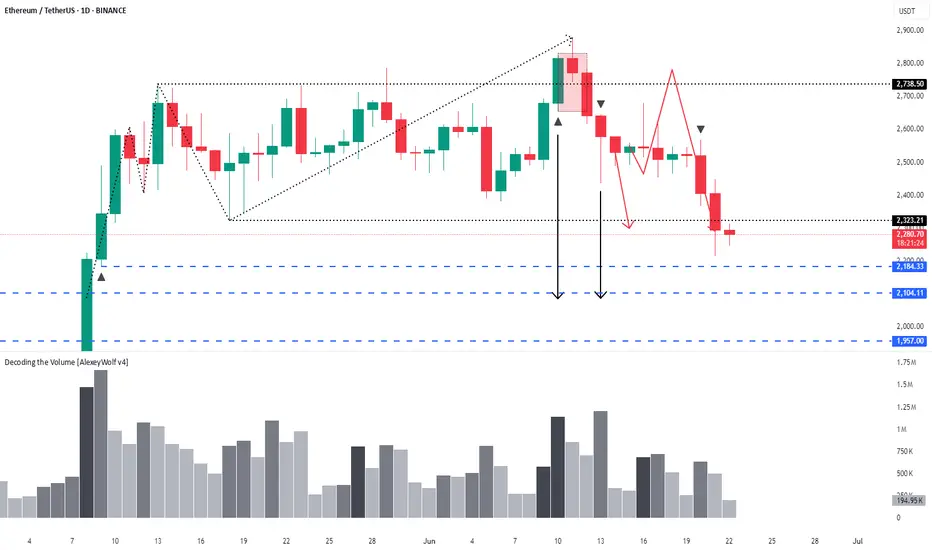
Ethereum – 1D timeframe overview with Initiative AnalysisHey traders and investors!
The price has reached the lower boundary of the range. There is no volume spike.
I expect a further decline toward 2184 and 2100. The 2100 level is a contextual area to look for buying patterns.
As part of a correction, the price could potentially drop to 1800. Monitoring.
This analysis is based on the Initiative Analysis concept (IA).
Wishing you profitable trades!
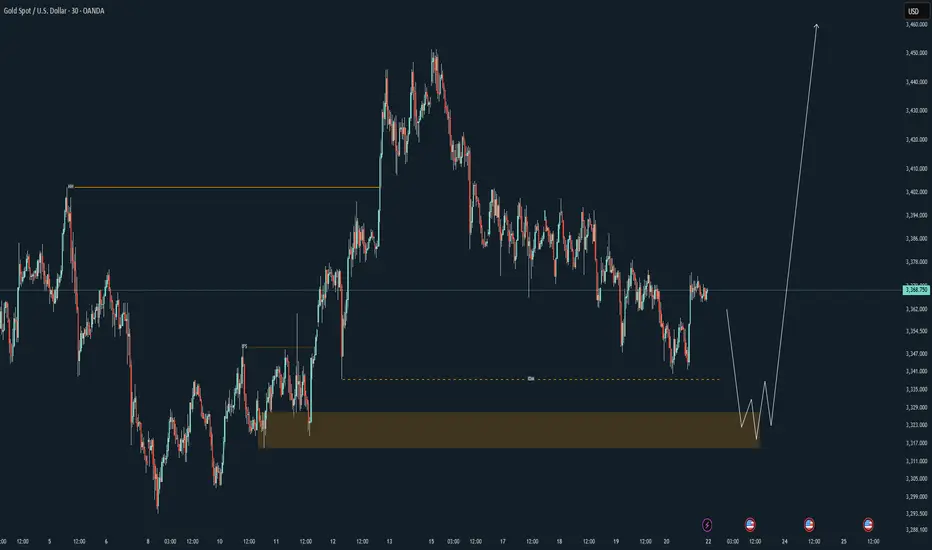
XAUUSD| Weekly OutlookStill holding the same idea going into this week — waiting on that 30-minute mitigation to confirm bullish intent.
Until price delivers that, I’m staying patient and letting the market open up. No need to force anything. Let structure lead.
Bless Trading!
EURUSD| Weekly OutlookSame story as last week — still patiently waiting for the major engineered liquidity above to get cleared before considering any meaningful longs.
That said, EU is currently offering a clean structure for short setups into the downside order block. Everything is lining up technically, but it’s important to note this is a counter-trend move — and personally, I’m not taking it.
It’s tempting when structure looks this clean, but I know it’s not my proper approach. For me, the real play is still higher — waiting on that bull-side OB mitigation to align with the bigger picture narrative. Until then, I’ll let others chase while I sit on my hands. Pure discipline only.
Bless Trading!

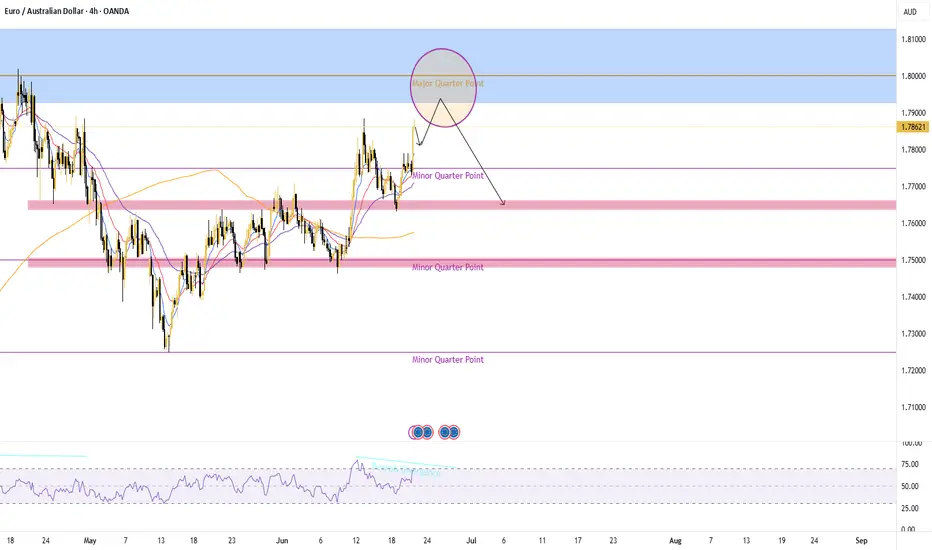
EURAUD Analysis Expecting price preparing to sell off.
I believe price will ultimately attempt another minor bullish push and meet resistance at the supply zone (shaded blue area).
A bearish divergence is currently present, however, I believe it will be confirmed after the failed bullish push.
Looking to short from the supply zone to the 4H zone (pink shaded area)
ETHUSDT – Trade Recap & Daily Bias for June 21Trade Recap (June 20):
I. First thing I did was mark out a DOL on the daily — price was hovering near a swing low, and I started noticing trend-side liquidity building up on the lower timeframes.
So my directional bias for today was short.
II. I marked the daily open.
III. With a short bias in mind, I waited for a Turtle Soup setup right above the daily open.
IV. The equal highs above were clean and obvious — textbook liquidity.
V. Once that liquidity was swept, I dropped to the M15 to watch how price reacted — waited for a clean displacement away from that zone before getting involved.
Daily Bias (June 21):
Still leaning short. We’re pretty close to a weekly FVG, which might act as a magnet.
If price forms liquidity during the day and takes it out in-session, I’ll look to short again.
Bread and Butter & Turtle Soup
