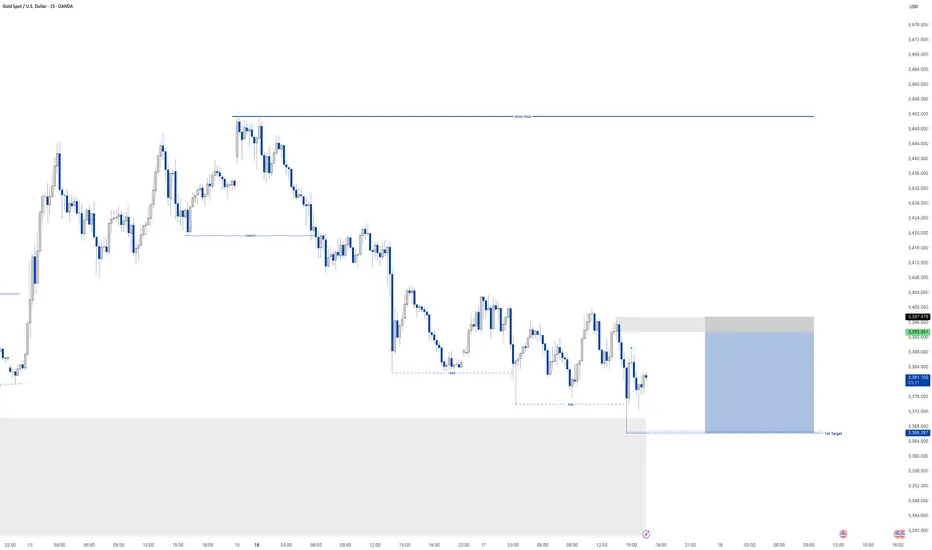
GOLD - Selling opportunity on the horizonLooking at gold.
We have a nice bearish continuation orderflow on the 15min TF.
We have a nice potential inducement level of liquidity that we are more than likely to take before moving lower.
This is a reduced risk entry due to where we are on the higher TF as we are pulling into a potential demand zone on the higher timeframe.
ITS REALLY IMPORTANT to remember where we are in terms of structure and as we well know Gold doesn't tend to fall for to long as it remains bullish the majority of the time. so in regards to the HTF like I mentioned above we are still bullish so we are expecting a reversal for the longer term at some point in the near future so this could be a case of get what we can from the market and then look for our LTF orderflow to switch Bullish before then looking for them long entries
Multiple Time Frame Analysis
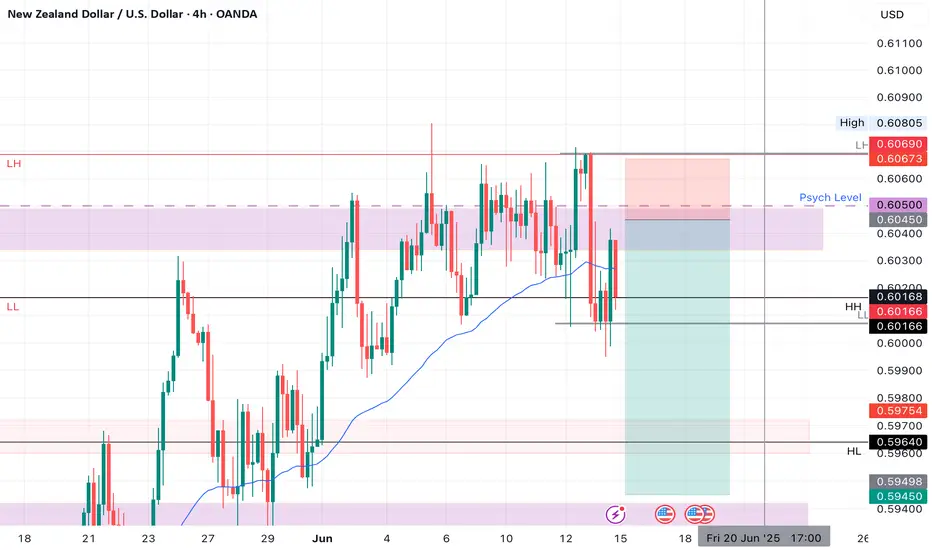
NZDUSD SHORTMarket structure bearish on HTFs DW
Entry at both Weekly and Daily AOi
Weekly Rejection At AOi
Daily Rejection at AOi
Previous Structure point Daily
Around Psychological Level 0.59500
H4 EMA retest
H4 Candlestick rejection
Rejection from Previous structure
Levels 4.48
Entry 100%
REMEMBER : Trading is a Game Of Probability
: Manage Your Risk
: Be Patient
: Every Moment Is Unique
: Rinse, Wash, Repeat!
: Christ is King.

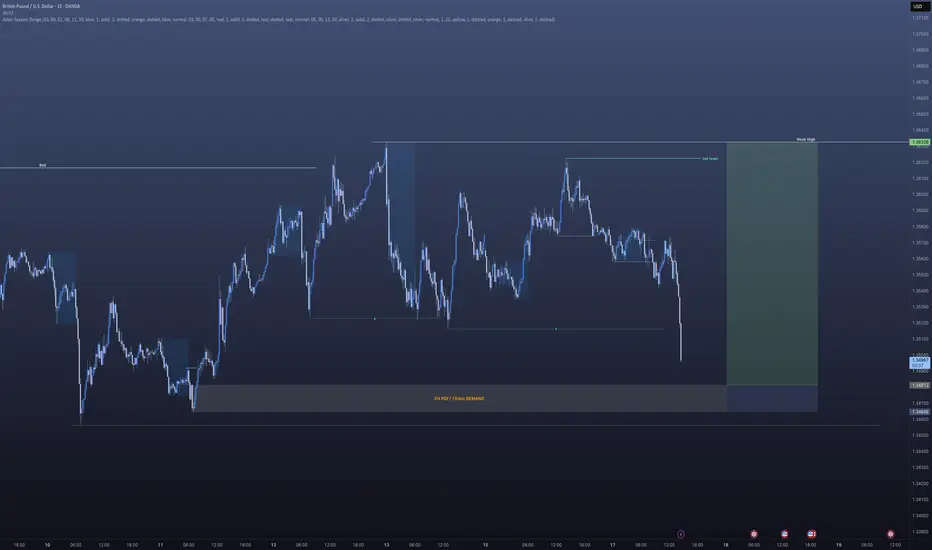
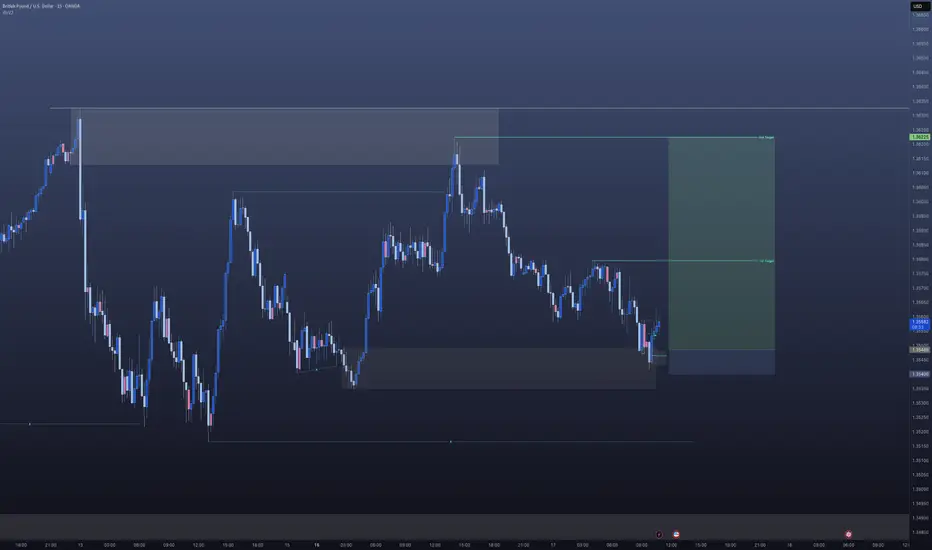
GBPUSD - Next point of interestAfternoon All,
So our GBPUSD trade from earlier didn't quite go to plan however I knew full well that we were building liquidity to the left on the higher timeframe.
This will be my next point of interest for a potential long.
Lets see how price plays out when we get down there.
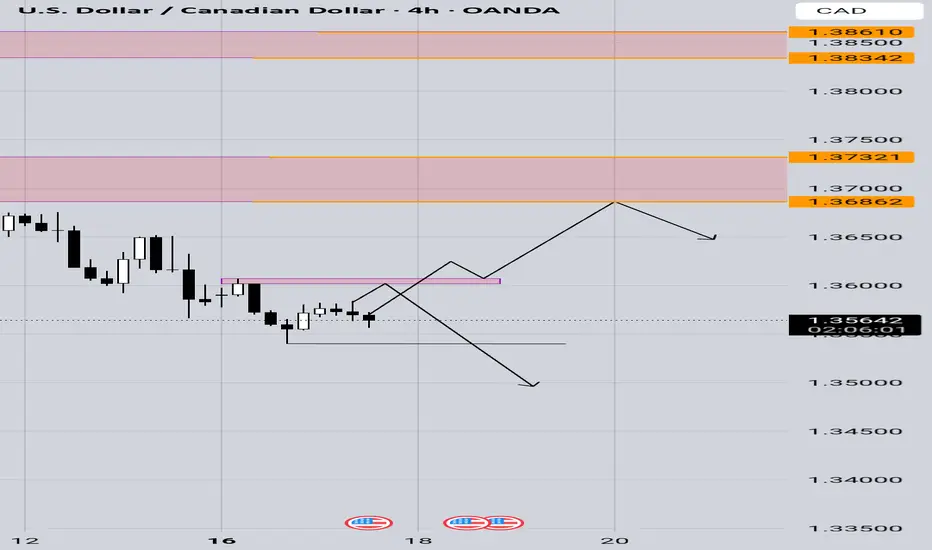
USD/ CAD Trade plan ???From the chart level you can plan sell if price come to our selling area . then after 5min coch or 15 min red candle
GBPUSD - LongUnfortunately I can't post the idea on the 5min to give you a better idea of where we are at in terms of the entry for this.
However I am looking to be tagged into this trade and have a limit order where I have set it.
Hoping to be tagged in. If we aren't we move on. and if we lose we move on.
If im able to help with any questions you may have do send them my way
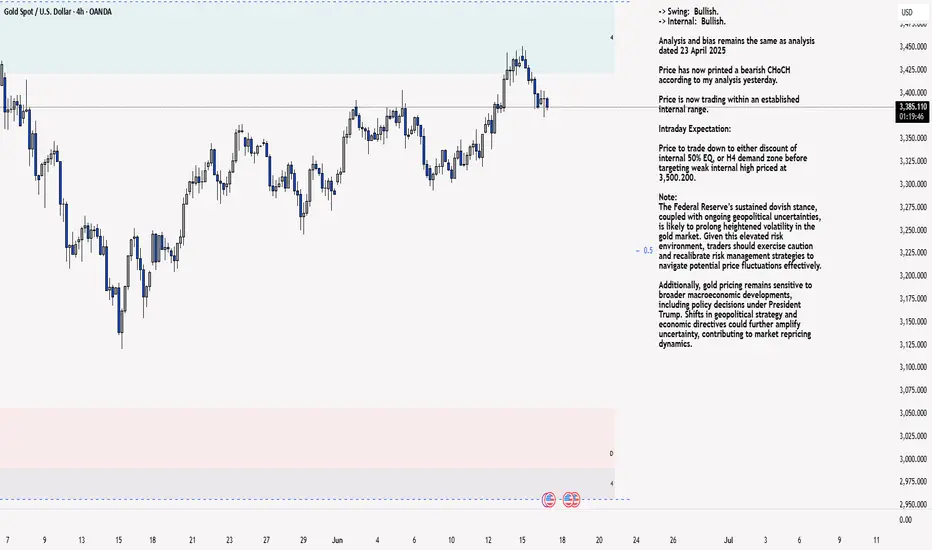
XAU/USD 17 June 2025 Intraday AnalysisH4 Analysis:
-> Swing: Bullish.
-> Internal: Bullish.
Analysis and bias remains the same as analysis dated 23 April 2025
Price has now printed a bearish CHoCH according to my analysis yesterday.
Price is now trading within an established internal range.
Intraday Expectation:
Price to trade down to either discount of internal 50% EQ, or H4 demand zone before targeting weak internal high priced at 3,500.200.
Note:
The Federal Reserve’s sustained dovish stance, coupled with ongoing geopolitical uncertainties, is likely to prolong heightened volatility in the gold market. Given this elevated risk environment, traders should exercise caution and recalibrate risk management strategies to navigate potential price fluctuations effectively.
Additionally, gold pricing remains sensitive to broader macroeconomic developments, including policy decisions under President Trump. Shifts in geopolitical strategy and economic directives could further amplify uncertainty, contributing to market repricing dynamics.
H4 Chart:
M15 Analysis:
-> Swing: Bullish.
-> Internal: Bullish.
Following previous high, and printing of bearish CHoCH, price has pulled back to an M15 supply zone, where we are currently seeing a reaction. Therefore, I shall now confirm internal high.
Price is now trading within an established internal range.
The remainder of my analysis shall remain the same as analysis dated 13 June 2025, apart from target price.
As per my analysis dated 22 May 2025 whereby I mentioned price can be seen to be reacting at discount of 50% EQ on H4 timeframe, therefore, it is a viable alternative that price could potentially print a bullish iBOS on M15 timeframe despite internal structure being bearish.
Price has printed a bullish iBOS followed by a bearish CHoCH, which indicates, but does not confirm, bearish pullback phase initiation. I will however continue to monitor, with respect to depth of pullback.
Intraday Expectation:
Price to continue bearish, react at either M15 supply zone, or discount of 50% internal EQ before targeting weak internal high priced at 3,451.375.
Note:
Gold remains highly volatile amid the Federal Reserve's continued dovish stance, persistent and escalating geopolitical uncertainties. Traders should implement robust risk management strategies and remain vigilant, as price swings may become more pronounced in this elevated volatility environment.
Additionally, President Trump’s recent tariff announcements are expected to further amplify market turbulence, potentially triggering sharp price fluctuations and whipsaws.
M15 Chart:
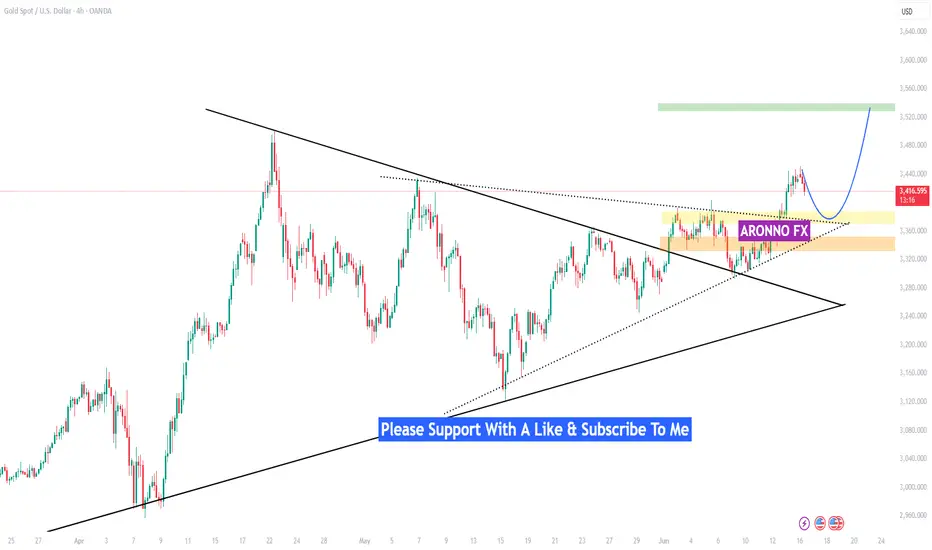
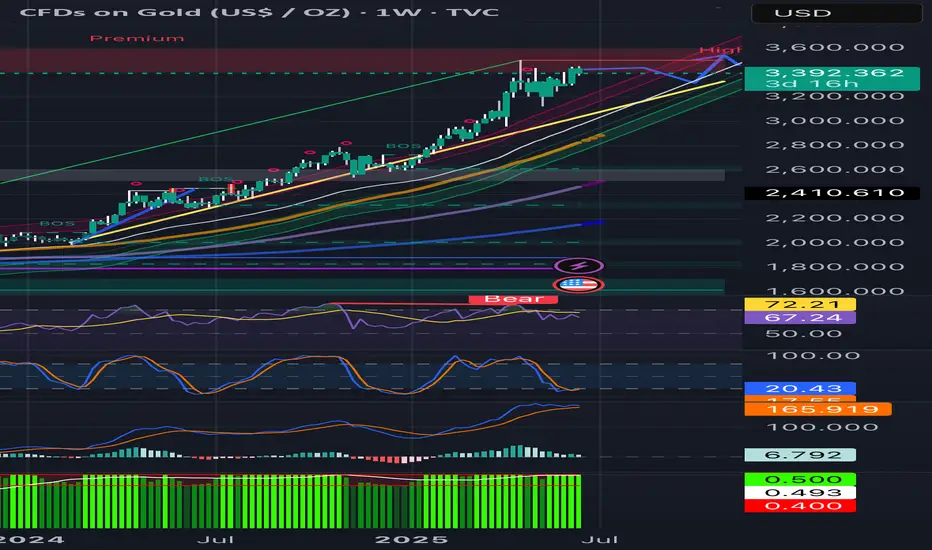
Long term trendThe long term trend line is long and strong with this one. We’re a good ways off of it though, so a mellowing while the Stochastic RSI resets could result in doubt that equates to a slight pullback. The trend line should provide ample support, due to the aforementioned length and strength, so new highs should be in order by the end of the month. 🎢
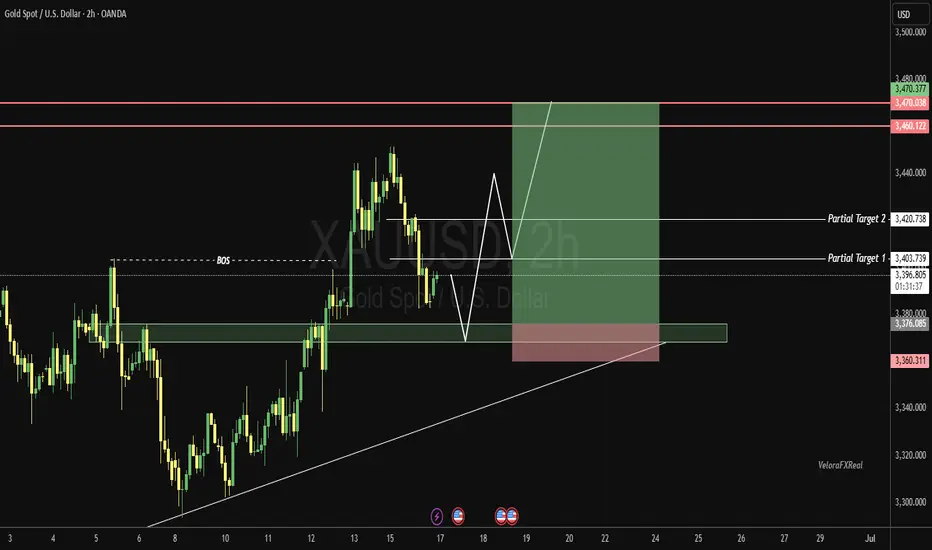
XAU / USD ANALYSIS [Bullish Bias]Gold continues to show strong bullish momentum, supported by key technical levels and favorable market structure. Price action remains constructive above the major support zone, indicating potential for further upside.
I'm closely monitoring the following levels for a high-probability long setup:
Demand Zone / Support Level:
Entry key level: 3375 - 3370
As long as gold holds above this support, the bias remains bullish with potential for a continuation toward higher resistance levels. A break and sustained move above the entry zone would confirm bullish strength and could trigger the next leg up.
Risk management remains key waiting for clear confirmation before entering is advised.
#GOLD, #FOREX , # VeloraFXReal
EURCHF 16/06/2025Weekly:
-Weekly lows rejected.
-Expecting a bullish weekly continuation.
Daily:
-Bullish M pattern.
-IC.
-Liquidity sweep.
4H:
-Bullish M pattern.
-IC.

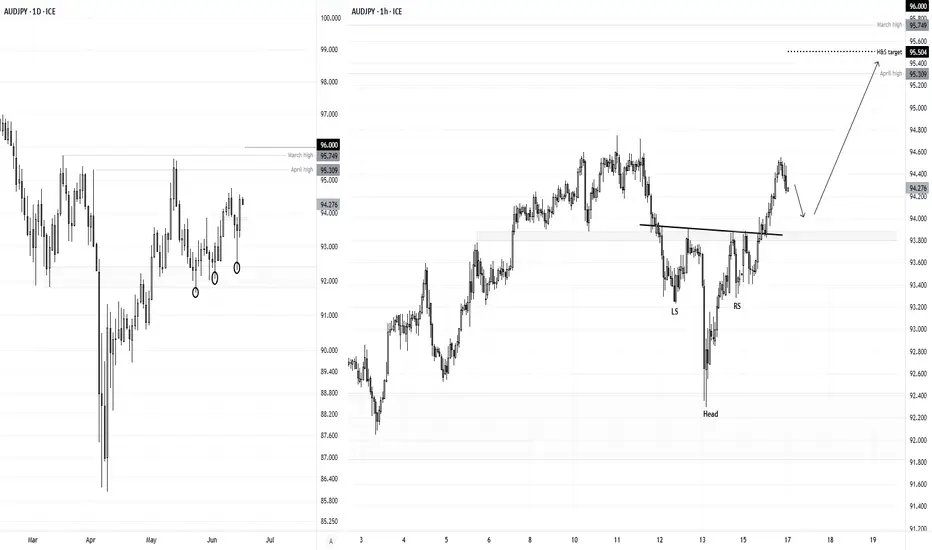
AUD/JPY Bulls Eye 95+ After Bullish ReversalAUD/JPY bounced sharply on Thursday, snapping a 3-day losing streak with a solid bullish-range session. The rally kicked off from a bullish pinbar above 92, where the higher low reinforces support and the broader bullish case.
The 1-hour chart shows a clean breakout from an inverted head and shoulders pattern, pointing to a target around 95.50. With resistance at the April high (95.30), March high (95.75), and the 96 handle, there’s still room for bulls to run.
Dips toward 94 may offer opportunities to join the trend — but a break back below the neckline would shift the tone back to risk-off.
Matt Simpson, Market Analyst at City Index and Forex.com
EURJPY ANALYSISFrom the previous trading day we see that the pair closed bullish and the 4hr and 1hr making HH and HL, which are confirmation of a bullish trend type move.

GBPUSD ANALYSIS After seeing how the previous daily candle close bullish and the 4hr structure make a retracement to a key level of 1.35626, we could be looking for another push leg up to make a new HH on the 4hr but waiting for confirmation on the daily timeframe.

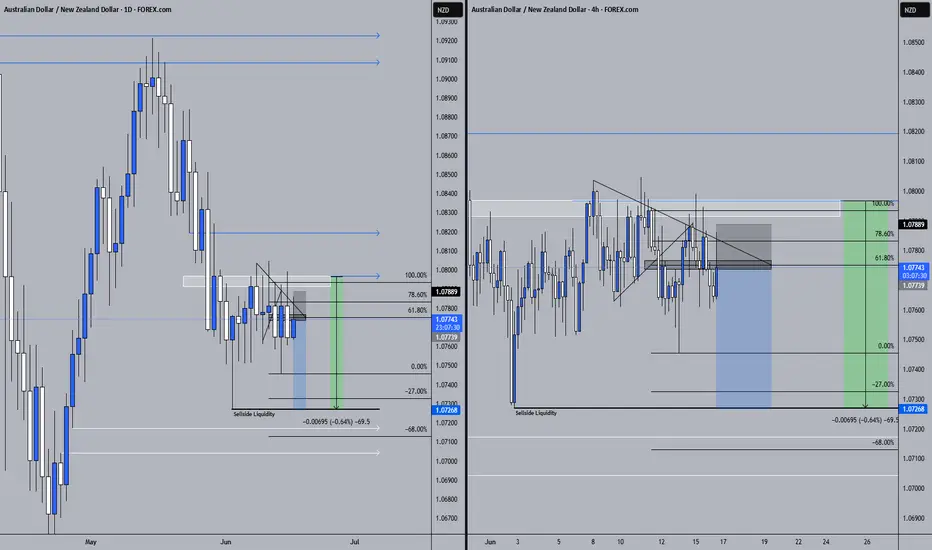
AUDNZD 16/06/2025Weekly:
-FVG.
-Last weekly bearish candle could get filled.
Daily:
-Bearish W pattern.
-H&S pattern.
4H:
-Bearish W pattern.
-H&S pattern.
-IC.
Long trade
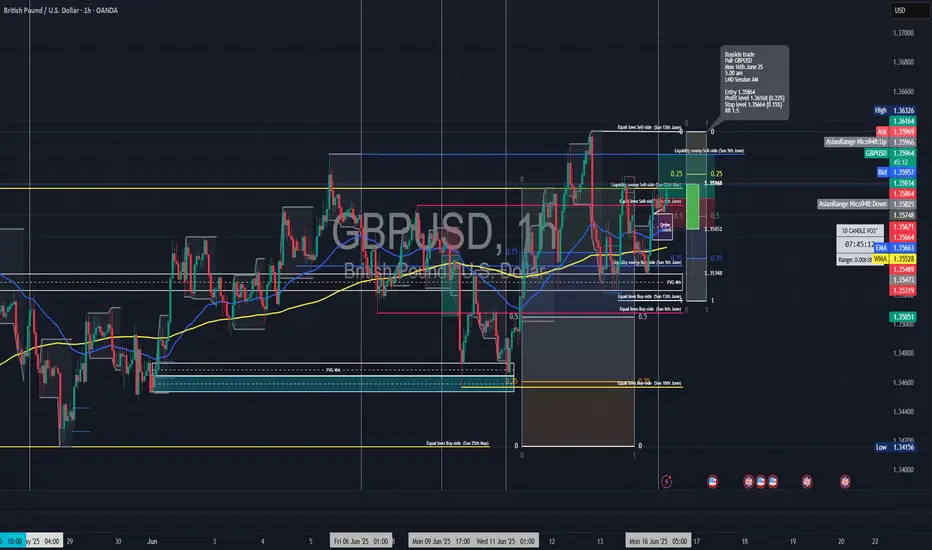
🟢 GBPUSD – Buyside Trade
Date: Monday, 16th June 2025
Session: London Session AM
Time: 5:00 AM
Entry Timeframe: 1Hr TF
Trade Parameters
Entry: 1.35864
Take Profit: 1.36168 (+0.22%)
Stop Loss: 1.35664 (−0.15%)
Risk-Reward Ratio (RR): 1.5
🧠 Trade Reasoning
This GBPUSD buyside trade was structured around an early London session setup, targeting a short-term liquidity gap above. Price had formed a bullish 1Hr structure, establishing a higher low.
Long trade
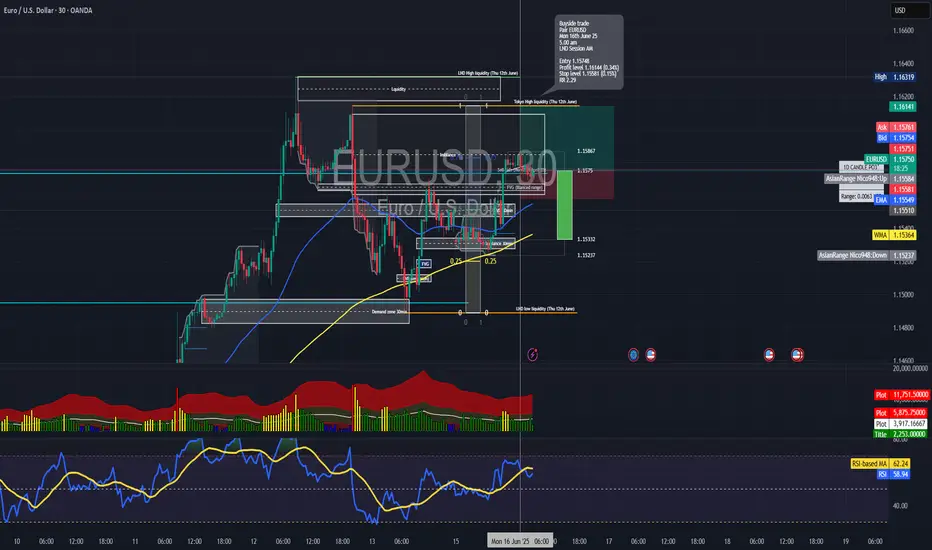
🟢 EURUSD – Buyside Trade
Date: Monday, 16th June 2025
Session: London Session AM
Time: 5:00 AM
Entry Timeframe: 1Hr TF
Trade Parameters
Entry: 1.15748
Take Profit: 1.16144 (+0.34%)
Stop Loss: 1.15581 (−0.15%)
Risk-Reward Ratio (RR): 2.29
🧠 Trade Reasoning
This buyside trade was executed after price swept the sell-side high from Monday, 21st April 2025, triggering liquidity above the previous swing, and then sharply rejecting back into structure. The reaction occurred above a 1Hr Fair Value Gap (FVG), indicative of a directional bias.
Long trade
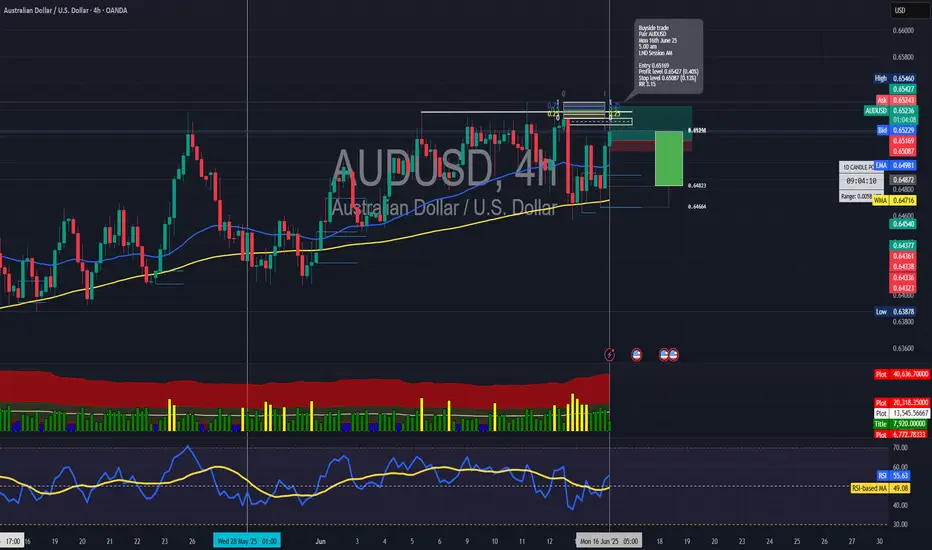
4Hr TF
🟢 AUDUSD – Buyside Trade
Date: Monday, 16th June 2025
Session: London Session AM
Time: 5:00 AM
Entry Timeframe: 4Hr TF
Trade Parameters
Entry: 0.65169
Take Profit: 0.65427 (+0.40%)
Stop Loss: 0.65087 (−0.13%)
Risk-Reward Ratio (RR): 3.15
🧠 Trade Reasoning
This AUDUSD buyside trade was executed on the 4-hour timeframe following a bullish rejection wick and confirmation of a mid-range bounce within a larger consolidation phase.
Long trade
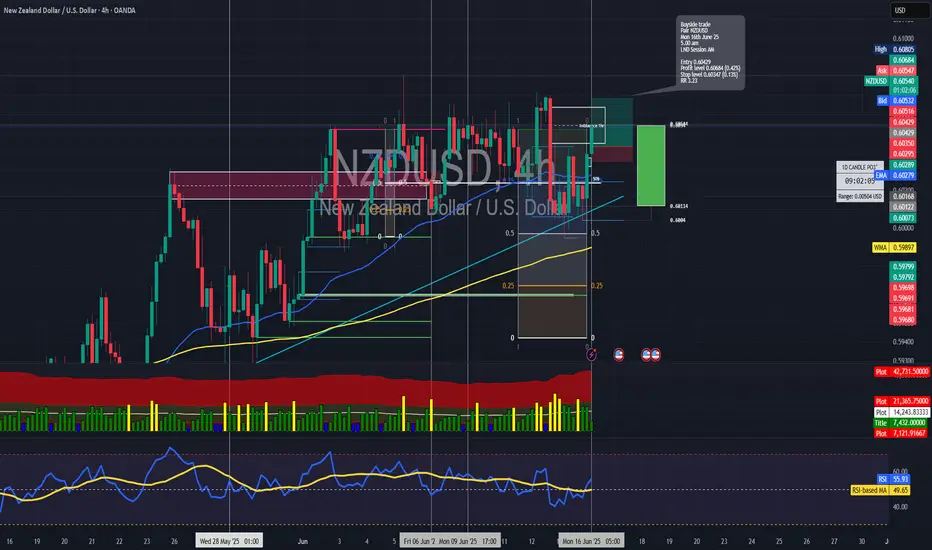
1Hr TF
🟢 NZDUSD – Buyside Trade
Date: Monday, 16th June 2025
Session: London Session AM
Time: 5:00 AM
Entry Timeframe: 1Hr TF
Trade Parameters
Entry: 0.60429
Take Profit: 0.60684 (+0.42%)
Stop Loss: 0.60347 (−0.13%)
Risk-Reward Ratio (RR): 3.23
🧠 Trade Reasoning
The trade was initiated on a 1-hour bullish continuation setup, with price finding firm support around the 0.60350 level — a previously swept liquidity zone and minor structural demand.
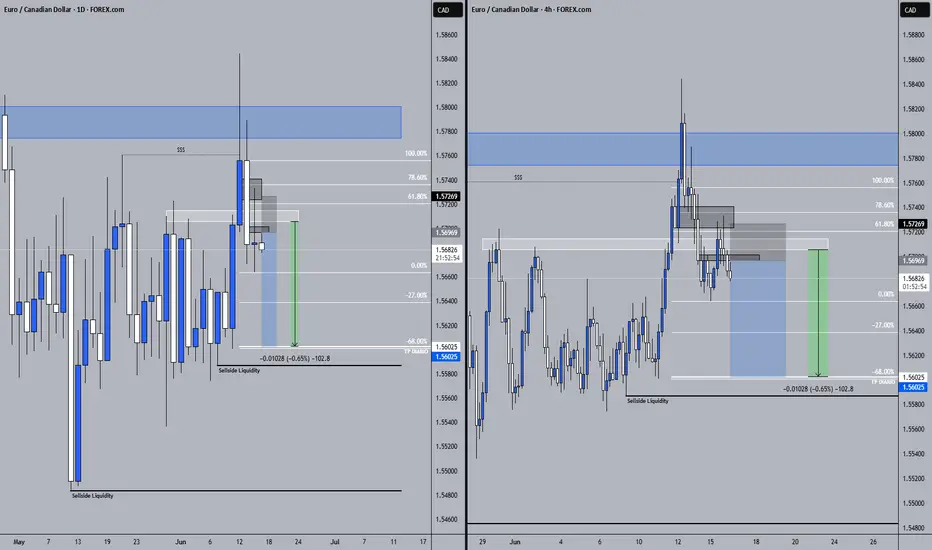
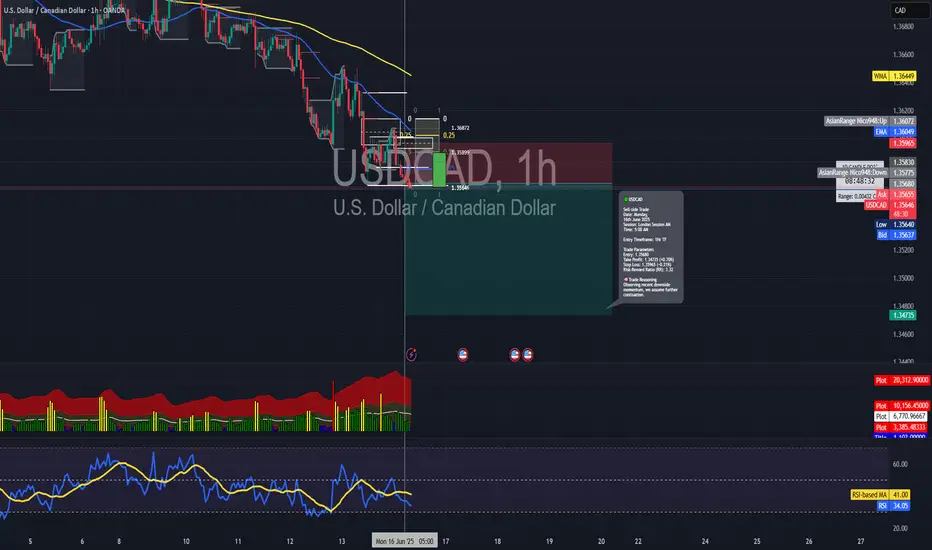
Short trade 🔻 USDCAD – Sell-side Trade
Date: Monday, 16th June 2025
Session: London Session AM
Time: 5:00 AM
Entry Timeframe: 1Hr TF
Trade Parameters
Entry: 1.35680
Take Profit: 1.34735 (+0.70%)
Stop Loss: 1.35965 (−0.21%)
Risk-Reward Ratio (RR): 3.32
🧠 Trade Reasoning
USDCAD has shown sustained bearish momentum on both 1Hr and 4Hr timeframes, with a clear lower high forming beneath the 1.35800 area. This trade was initiated on confirmation of a bearish rejection from a supply zone during the early London session volatility.
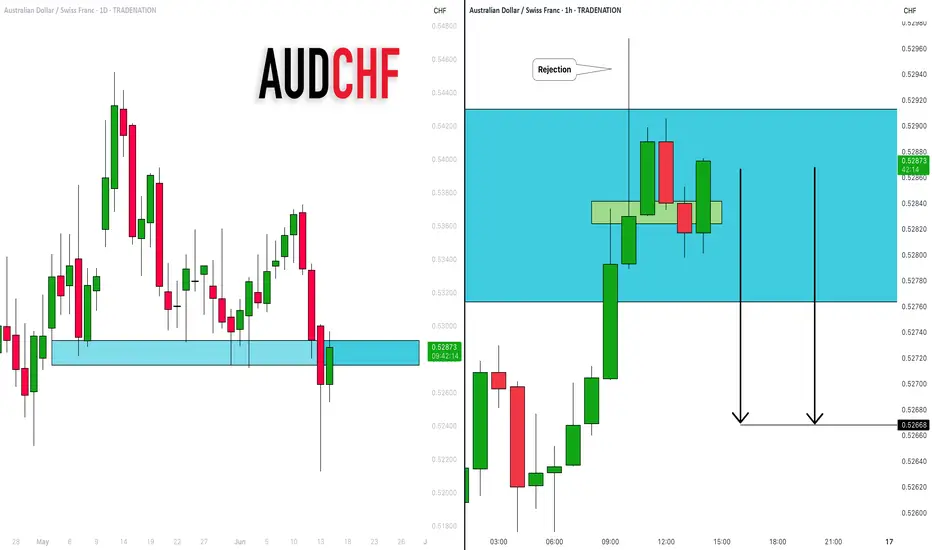
AUDCHF: Pullback From Resistance 🇦🇺🇨🇭
There is a high chance that AUDCHF will retrace from a key daily resistance.
As a confirmation, I see a strong rejection on an hourly time frame.
Goal - 0.5267
❤️Please, support my work with like, thank you!❤️
I am part of Trade Nation's Influencer program and receive a monthly fee for using their TradingView charts in my analysis.
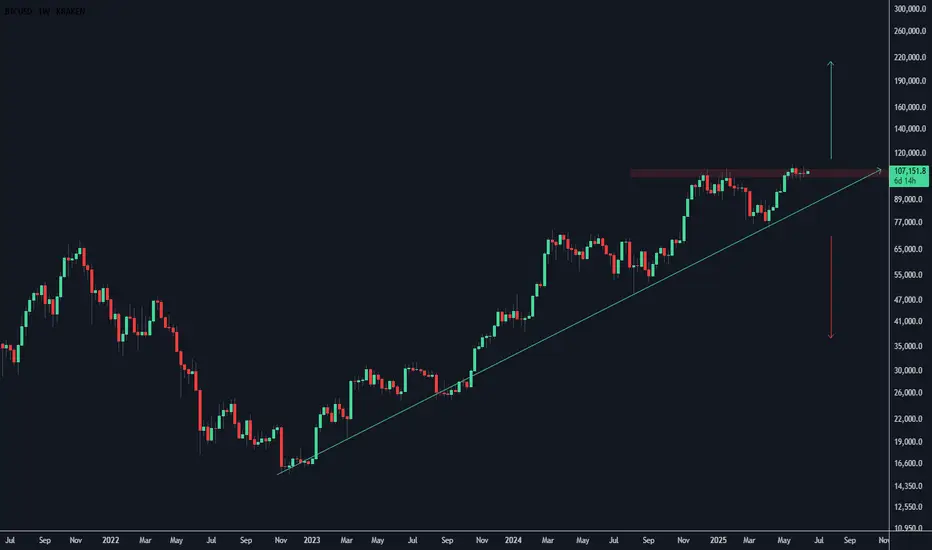
BTC Weekly ChartJust consolidating around ATHs at this point.
Its bound to see a huge move either way eventually.
GOLD UPDATE .......Hello Traders, here is the full analysis for this pair,
let me know in the comment section below if you have any questions,
the entry will be taken only if all rules of the strategies will be
satisfied. I suggest you keep this pair on your watch list and see if
the rules of your strategy are satisfied.
Dear Traders,
If you like this idea, do not forget to support it with a like and follow.
PLZ! LIKE COMMAND AND SUBSCRIBE