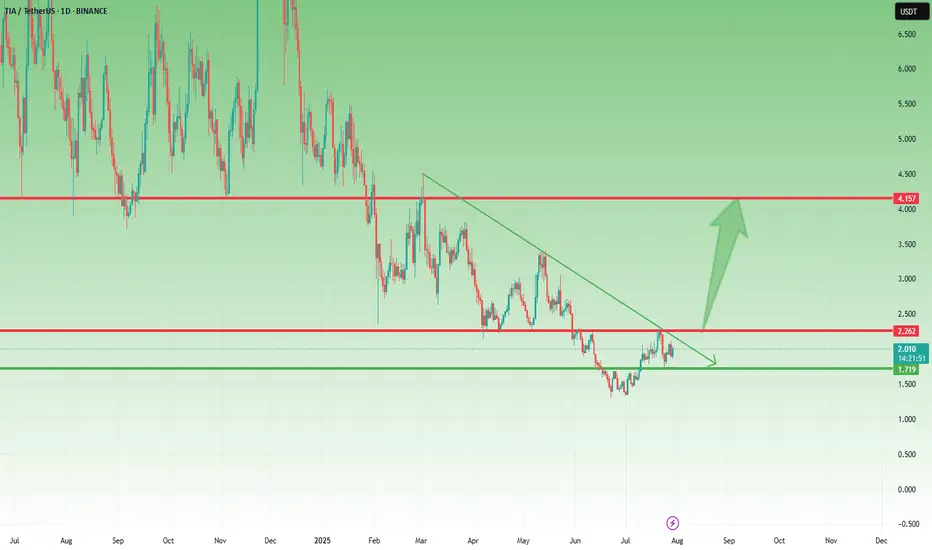
TIA Holding Support – Break Above $2.20 Could Trigger Big MoveLast week, I mentioned that TIA could be preparing for a move and that buying dips around $1.75 might be a good opportunity.
Well, price dropped exactly into that support zone, bounced slightly, and is now consolidating, which could be the calm before the next wave.
________________________________________
📌 Here’s what I’m watching:
• The $2.10–$2.20 zone is now a confluence resistance area (horizontal + descending pressure)
• A break and daily close above this level could trigger a strong leg up, with the next major target around $4.00
________________________________________
📈 Bias remains bullish
As long as $1.70 holds, this setup stays valid, and dips continue to be buyable.
________________________________________
🎯 Trading Plan:
• Looking to buy dips toward $1.80–1.85
• Acceleration expected only above $2.20
• Bearish invalidation only below $1.70
________________________________________
Conclusion:
TIA is respecting structure perfectly. If it breaks above $2.20, we could be looking at a potential double in price toward $4.
Multiple Time Frame Analysis
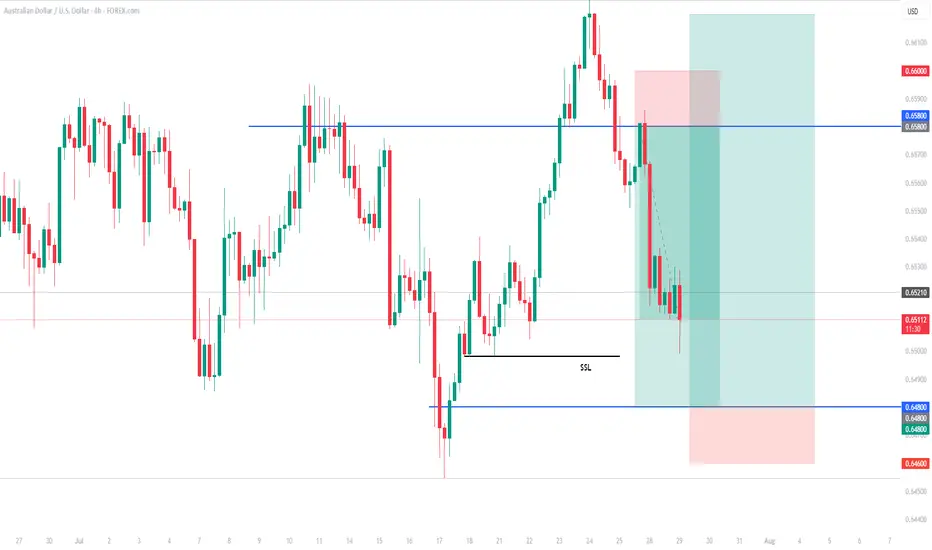
AUDUSD BUY SETUPAUDUSD is bullish on the daily timeframe and is currently retracing to continue buying. I want to see structural liquidity taken and tap my entry before continuing to the upside.
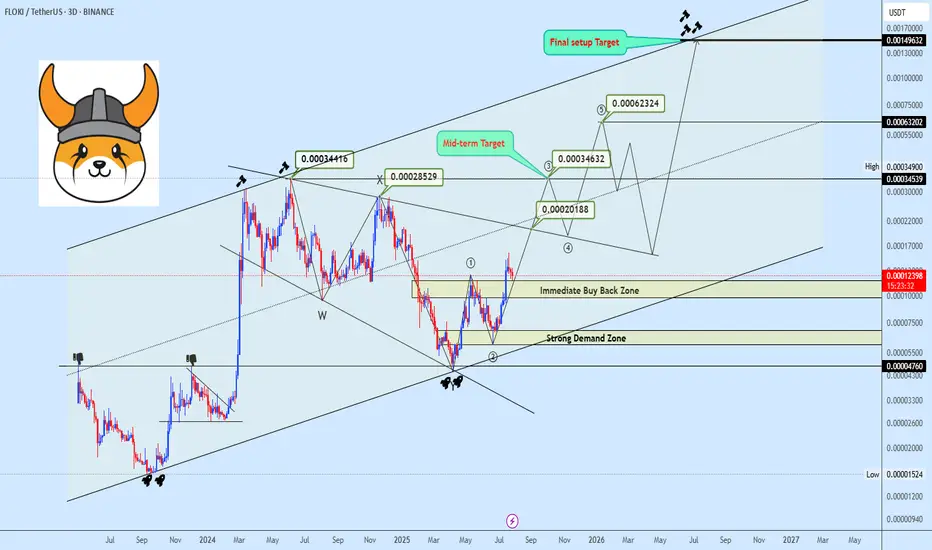
Wave 3 Loading? FLOKI Prepares for Potential Upside ContinuationFLOKIUSDT is trading within an ascending channel, recently rejecting from the upper boundary near $0.00034416. Price has since entered a prolonged consolidation phase, forming a descending broadening wedge.
The current focus remains on the $0.00020188 region; a breakout from this level would validate a potential wave 3 extension. Overall structure still targets a revisit to the channel’s upper boundary, supported by the recent bounce from the lower channel trendline.
Key levels and targets are illustrated on the chart.
EURJPY ANALYSISAfter seeing the previous daily candle close as an engulfing and trading below the moving average we could be looking for further sell off but with the fundamentals coming out for the day we could see slowed movement till the news comes out

GBPUSD SELL After seeing the previous daily close below the low of the weekly bullish support we could expect this pair to continue its move down following the 4hr structure now at a low point we could see a retracement into the Fibonacci area

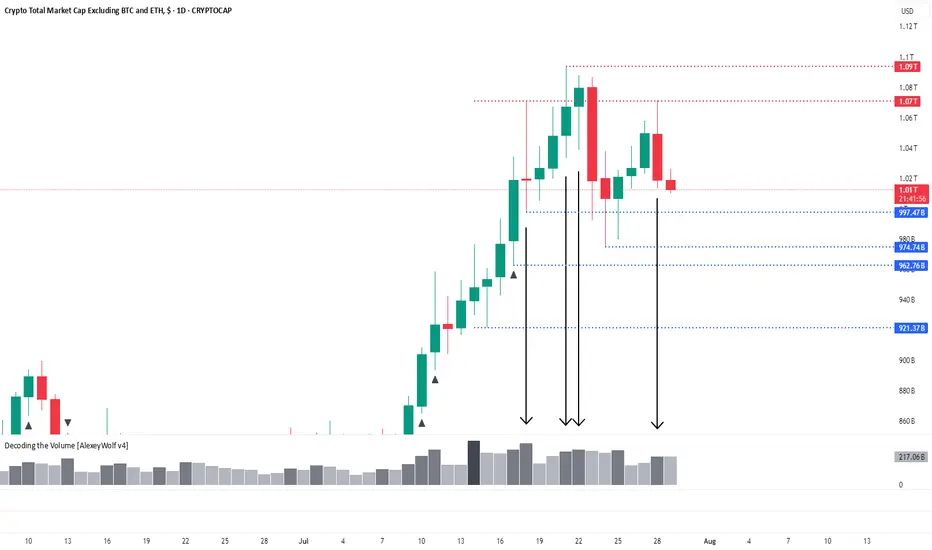
Total3: Fourth Interaction with 1.07 LevelHi traders and investors!
The altcoin market capitalization (Total3) is interacting with the 1.07T level for the fourth time — and once again, on increased volume. Yesterday’s price action formed a bearish candle after touching this level — a clear seller’s candle.
We’re now watching the 997.47B level closely. A reaction from this level could trigger a reversal in altcoins, with buyers potentially regaining initiative.
Since the last outlook, a new level has appeared at 974.74B — this could also serve as a strong support area and trigger a buyer response, aiming for a retest of the local high at 1.09T.
👉 If no bullish reaction follows at 997.47B, attention shifts to 974.74B.
👉 If that level also fails to hold, we return to the previously mentioned support zone between 921B and 963B — the optimal correction range for a potential new ATH scenario.
This analysis is based on the Initiative Analysis concept (IA).
Wishing you profitable trades!
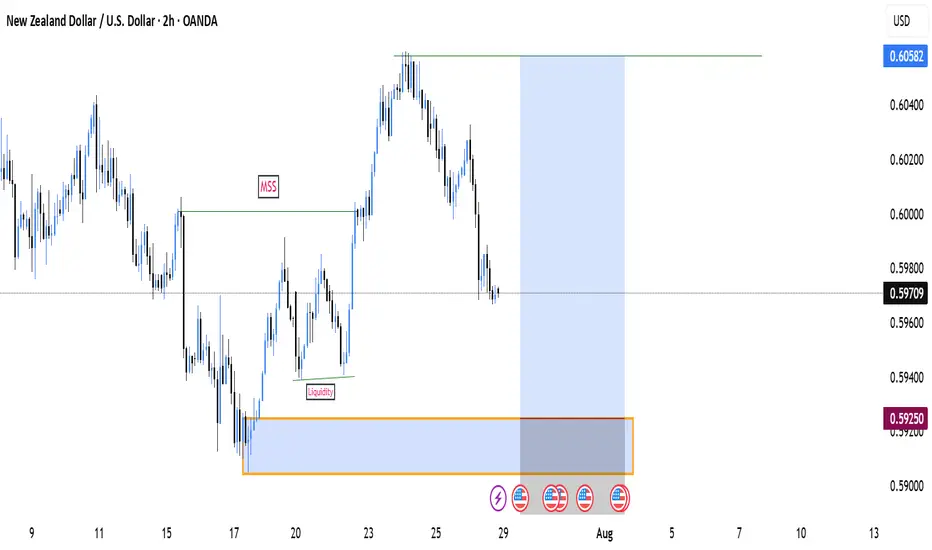
NZDUSDT Long Looking to enter NZD/USD around 0.59250 at the Order Block due to a liquidity inducement zone and potential Market Structure Shift (MSS).
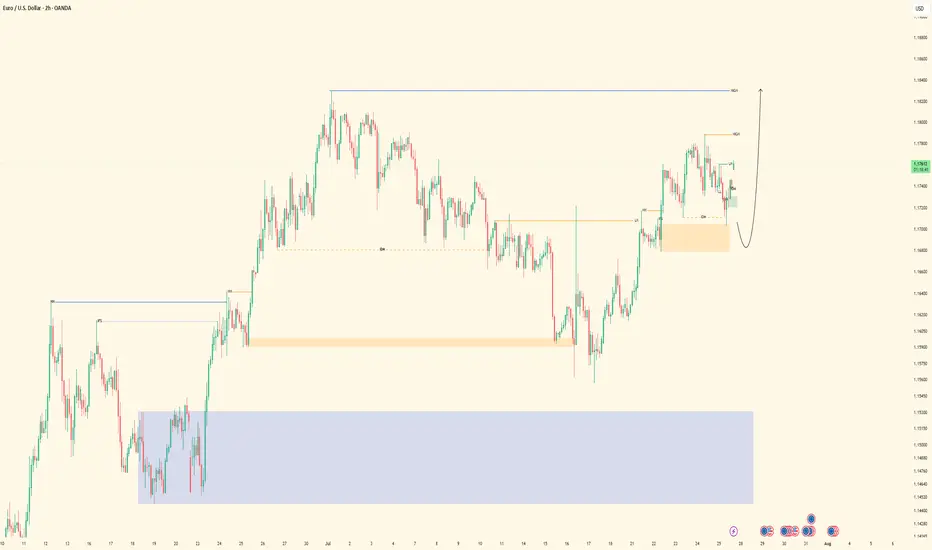
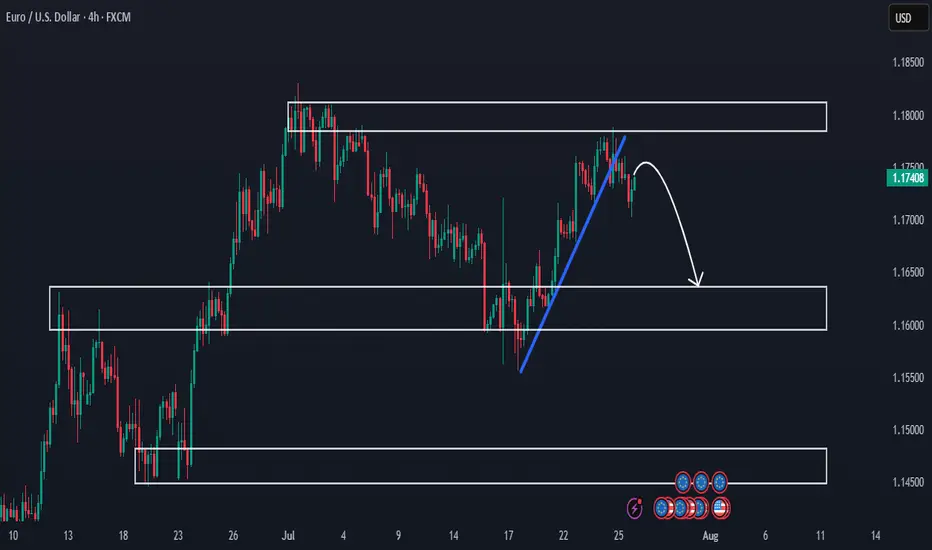
Premarket Analysis - Will Price Head Lower?Hello everybody!
We’re looking at three key areas on the chart.
Price has been rejected from a supply zone.
The clean upward trendline has been broken, and we expect the price to move lower this week.
If the drop continues, we’ll look to sell and aim for the more likely target around 1.16400.
Then we’ll see whether this first demand/support area holds or not.
Have a good trading week ahead!
GBPCHF SHORT Market structure bearish on HTFs 3
Entry at Daily AOi
Weekly Rejection at AOi
Daily Rejection at AOi
Previous Structure point Daily
Around Psychological Level 1.07500
H4 EMA retest
H4 Candlestick rejection
Rejection from Previous structure
Levels 2.98
Entry 100%
REMEMBER : Trading is a Game Of Probability
: Manage Your Risk
: Be Patient
: Every Moment Is Unique
: Rinse, Wash, Repeat!
: Christ is King.

Incoming 40% correction for FacebookOn the above 10 day chart price action has rallied 500% since October 2022. It is somewhat unfortunate to see so many long ideas at the moment.
Motley Fool August 8th:
“Here's how Meta could achieve a $2 trillion valuation within three years, and if it does, investors who buy the stock today could earn a 67% return.”
Very misleading.
Why bearish?
Failed support. It is very clear to see, price action has broken through support and confirmed it as resistance. You can see this more clearly on the Log chart below.
Regular bearish divergence. Multiple oscillators now print negative divergence with price action across a 50 day period.
On the monthly chart below a hanging man candle print can be seen. Although the candle does not confirm until the end of the month there is a clear indication of buyer exhaustion. This is an important trend reversal indication.
Is it possible price action continues to rise? Sure.
Is it probable? No.
Ww
Log chart
Monthly hanging man candlestick

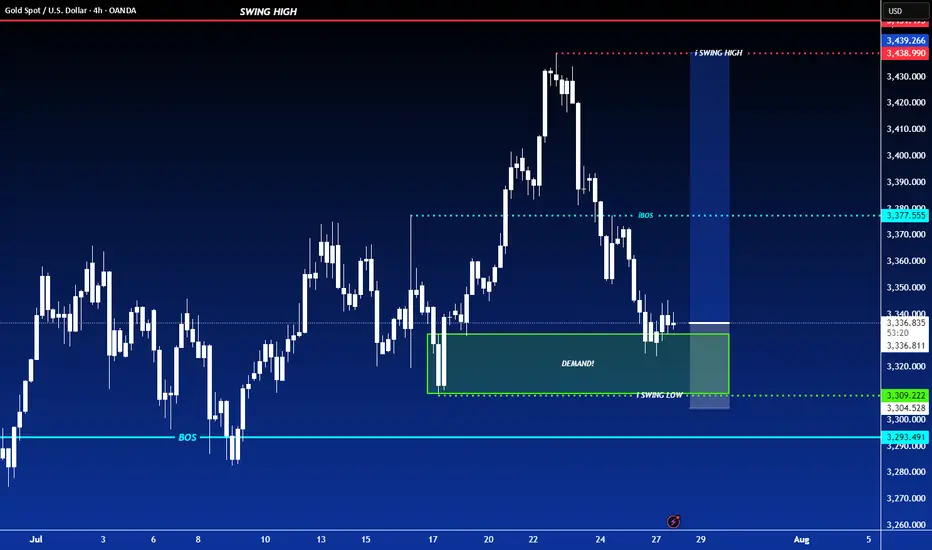
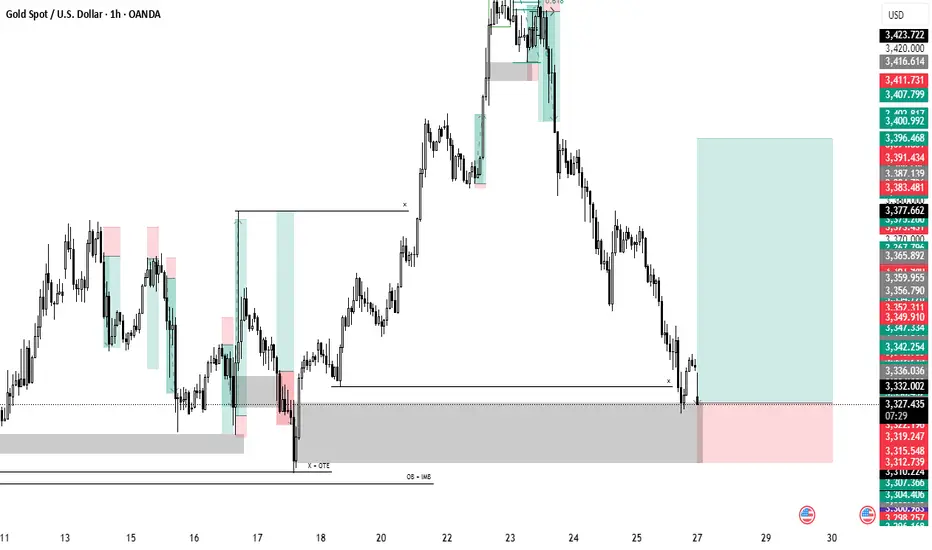
LONG ON GOLD (XAU/USD)Gold is at a nice demand level with the dollar currently falling.
I will be buying gold looking to make over $102 move to the previous high.
Thats over 1000 pips on gold.
EURJPY ANALYSIS After seeing the weekly close bullish we could expect the pair to continue the bullish leg this new week with the daily and 4hr trading in the same direction. An upside target of 175.000 could be the profit taking areas for the next leg to the upside

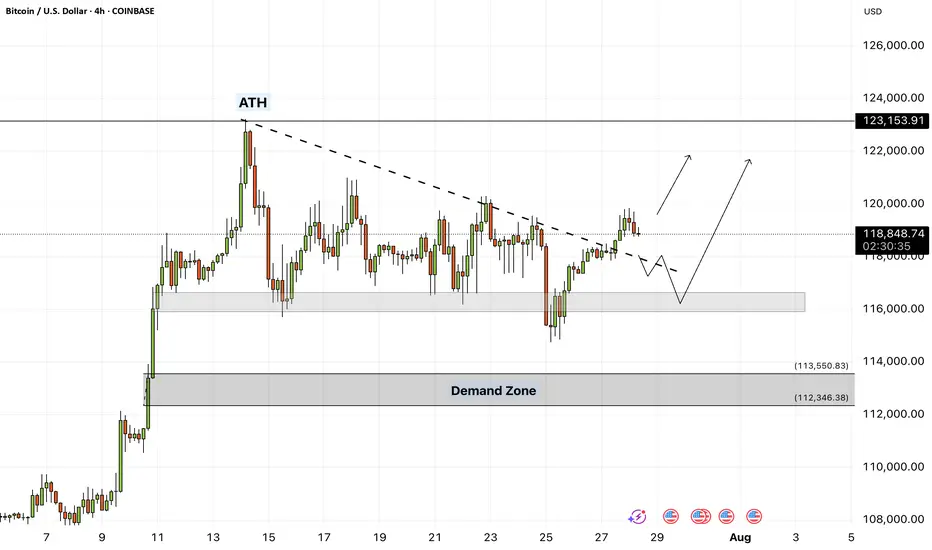
Bitcoin - Will Bitcoin continue its upward trend?!Bitcoin is above the EMA50 and EMA200 on the four-hour timeframe and is in its medium-term ascending channel. Bitcoin’s current upward momentum has the potential to reach its previous ATH. If it corrects, you can look for Bitcoin buying opportunities from the identified support area, which is also at the intersection of the bottom of the ascending channel.
If this support is lost, the decline will continue to around $113,000, where you can again buy Bitcoin with a better risk-reward ratio.
It should be noted that there is a possibility of heavy fluctuations and shadows due to the movement of whales in the market, and capital management will be more important in the cryptocurrency market. If the downward trend continues, we can buy within the demand range.
Last week, a group of U.S. senators released an initial draft of a new legislative proposal aimed at creating a clearer regulatory framework for the digital asset industry in the United States. The proposal builds on the recently passed CLARITY Act in the House of Representatives and focuses on strengthening market structure, enhancing consumer protection, and expanding regulatory oversight.
According to the senators, the bill addresses key areas such as banking, disclosure requirements, securities classification, and measures to combat illicit financial activity.Senator Lummis, in highlighting the proposal, stressed the urgent need for legal clarity to support the growth of this emerging industry within the U.S. The legislation aims to facilitate the integration of digital assets into banking services and would allow financial holding companies to provide services based on such assets.
The draft also includes measures aimed at preventing illegal financial activities, such as improving regulatory standards and boosting inter-agency cooperation to identify and block misuse of digital assets.
In addition, the senators have issued a “Request for Information” (RFI) to support the legislative process and have invited the public to share their opinions on more than 35 related topics, encouraging broader engagement in shaping the bill.
Meanwhile, in Asia, Japan-based firm Metaplanet announced that it has added 780 BTC worth $93 million to its digital holdings. This acquisition brings the company’s total Bitcoin reserves to 17,132 BTC, valued at roughly $2 billion. Metaplanet is fast becoming one of the largest institutional Bitcoin treasuries in the region—potentially serving as a model for other firms across Asia.
At the same time, publicly traded U.S. companies have significantly ramped up their Bitcoin holdings. By the end of Q2 2025, these companies had accumulated nearly 900,000 BTC, marking a 35% increase over the previous quarter. This surge, driven primarily by firms such as MicroStrategy, has sent demand for Bitcoin soaring.
Some analysts believe that the $1.5 trillion in free cash flow held by companies within the S&P 500 index could spark a new wave of institutional Bitcoin buying.
Looking ahead, the upcoming week is packed with critical U.S. economic data. Alongside the Non-Farm Payroll (NFP) employment report and inflation metrics via the Personal Consumption Expenditures (PCE) index, the initial estimate for Gross Domestic Product (GDP) and various other indicators will be released—potentially offering a clearer picture of where the U.S. economy is heading.
The Federal Reserve remains primarily focused on inflation and labor market dynamics. June CPI data indicated signs of inflationary pressure caused by tariffs. If Thursday’s PCE report—particularly its core reading—confirms a similar trend, the Fed may decide against a rate cut in September. As a result, financial markets have priced in only about a 65% chance of a rate cut at that meeting.
Bitcoin Next Leg Incoming? Targets $134K from Bullish WedgeBTCUSDT is consolidating within a descending wedge right above a critical demand zone, following a impulsive breakout from its prior range structure. This current setup suggests another potential bullish continuation, especially as price continues to respect both the wedge support and internal demand.
With the higher timeframe structure favoring bulls and previous demand zones holding firm, the projected breakout targets align with $123,218 and $134,446 respectively.
A clean invalidation would only be confirmed on a sustained break below the wedge and loss of the strong support area near $110K.
All eyes on the wedge apex as BTC prepares for its next major leg.

GBPUSD ANALYSIS After seeing the weekly find support at the low of the previous bullish candle we could be looking for a push up on this pair but waiting to see how the pair trades for the London session today and if there will be a break of resistance on the 4hr timeframe

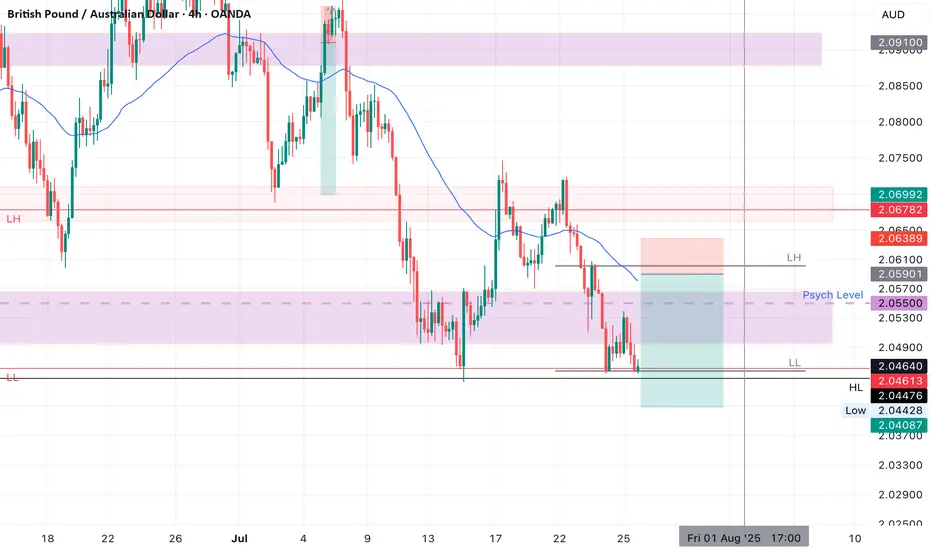
GBPAUD SHORT Market structure bearish on HTFs DH
Entry at both Weekly and Daily AOi
Weekly Rejection at AOi
Daily Rejection at AOi
Previous Structure point Daily
Around Psychological Level 2.05500
H4 EMA retest
H4 Candlestick rejection
Rejection from Previous structure
Levels 3.78
Entry 100%
REMEMBER : Trading is a Game Of Probability
: Manage Your Risk
: Be Patient
: Every Moment Is Unique
: Rinse, Wash, Repeat!
: Christ is King.
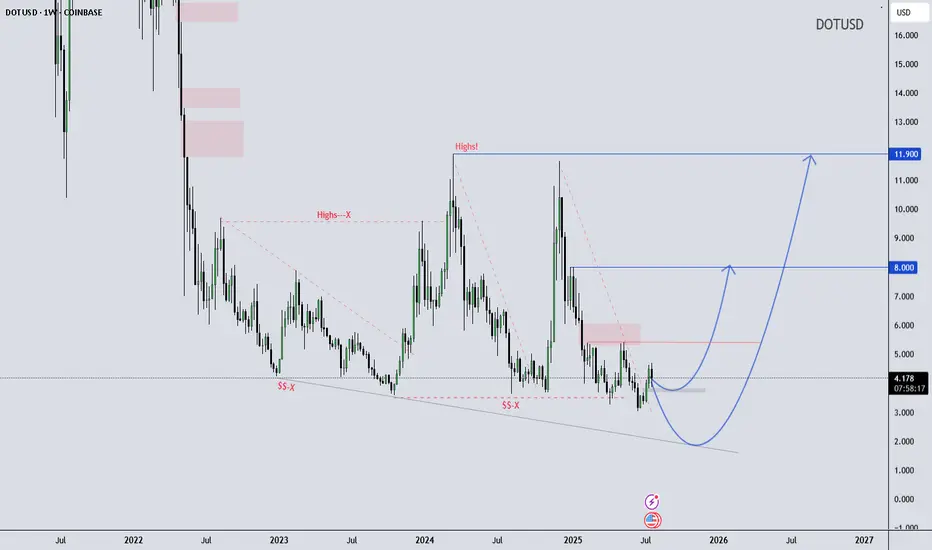
DOT/USD Weekly Structure - - Reversal Possibility Developing DOT/USD Weekly Outlook – Educational Perspective
Polkadot (DOT) is trading near the lower boundary of a long-term falling wedge structure, showing early signs of stabilization around the $4.20 support zone. Price has respected this level multiple times, potentially forming a rounded bottom, which often suggests shifting momentum.
If the structure holds, it may continue developing a macro reversal pattern. This kind of formation is typically monitored by swing traders looking for high risk-reward setups in longer timeframes.
Key Technical Levels to Watch:
$8.00 – Mid-range structural resistance
$11.90 – Historical supply / macro pivot zone
This chart is shared for educational purposes only to support market structure learning. Always follow your own analysis and risk management plan.
Wave Trader Pro
Learn & Earn
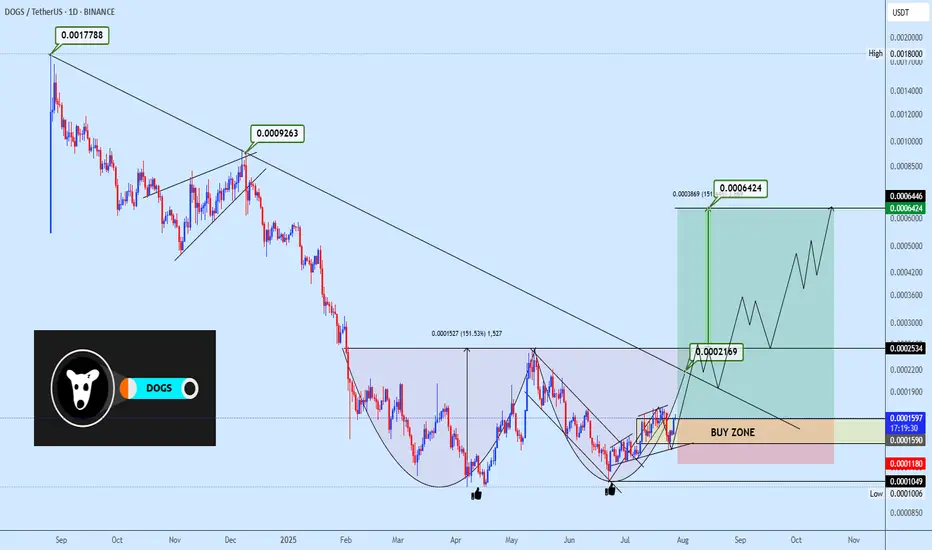
Dogsusdt double bottom formationDOGSUSDT is exhibiting a micro double bottom formation, with price rebounding from a previous support zone. The strategy is to accumulate within the highlighted area and monitor the neckline reaction around 0.0002534. A breakout above this level would validate the entire double bottom structure and set the stage for a move toward the projected targets. Enjoy.
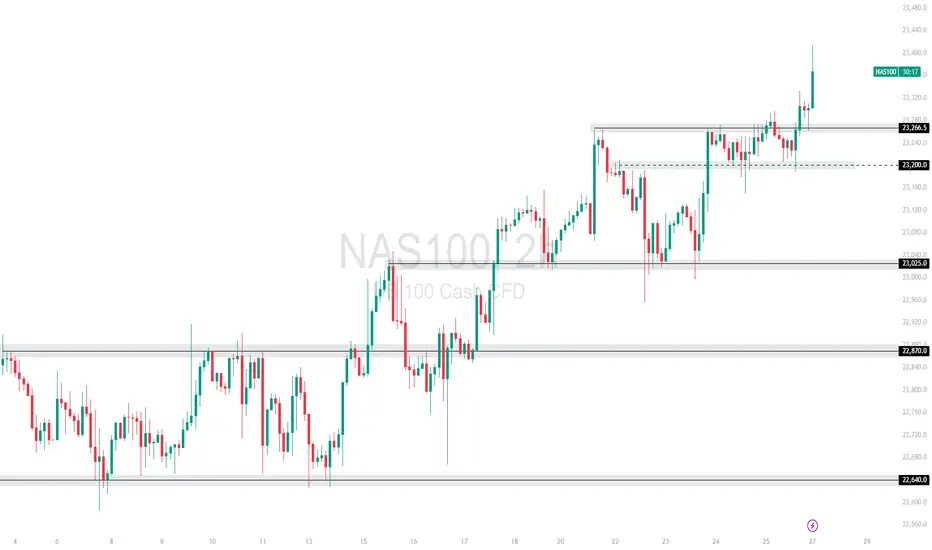
NAS100 Gaps Up on Trump Trade Deal – Bullish Continuation The market opened with a bullish gap after Trump announced new trade deals, sparking investor optimism. Price cleanly broke above the 23,266.5 🔼 resistance level, confirming it as a fresh support zone.
Buyers are now in full control, and price is forming a strong bullish structure with higher highs and higher lows.
Support at: 23,266.5 🔽, 23,200 🔽, 23,025 🔽
Bias:
🔼 Bullish: As long as price holds above 23,266.5, the path is clear for a move toward 23,400 and possibly 23,540+. Watch for minor pullbacks into support for continuation setups.
🔽 Bearish: A break back below 23,266.5 would be the first warning of bullish exhaustion, with downside potential toward 23,200.
📰 News Insight: The bullish gap came after Donald Trump announced new trade deals, boosting risk sentiment across U.S. indices. This has become a key short-term fundamental catalyst.
📛 Disclaimer: This is not financial advice. Trade at your own risk.
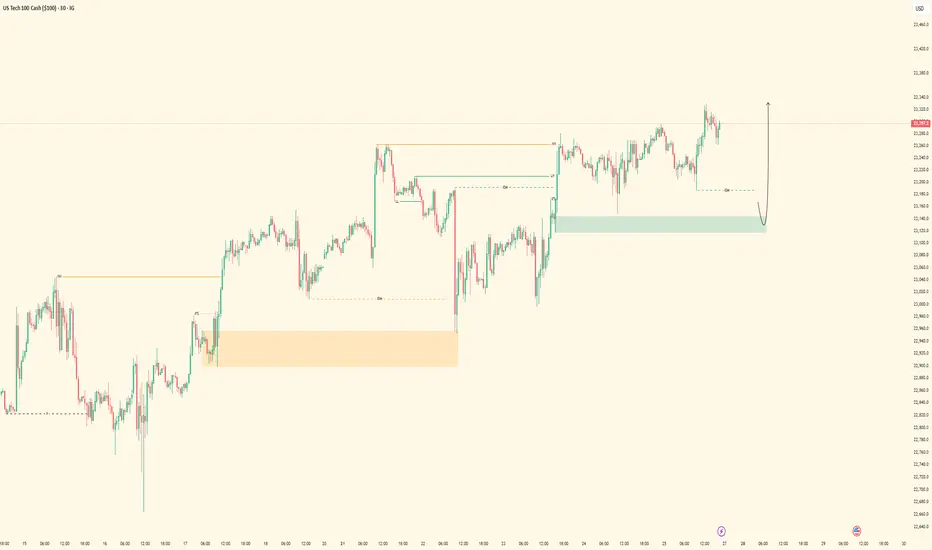
NASDAQ| Bullish Bias - Refined OB Near MitigationPair: NASDAQ (NAS100)
Bias: Bullish
HTF Overview (4H):
Strong bullish structure has been the narrative, and last week’s upside intent confirmed the move. Current action suggests price is preparing for continuation after brief consolidation.
LTF Confirmation (30M):
Structure has been refined with a key OB in play. Price is approaching mitigation, and I’ve been tracking this level closely since last week.
Entry Zone: Waiting for clear 5M shift after OB mitigation. 5M OB already tapped — now I’m watching for confirmation to execute.
Targets: 5M highs first, 30M highs if price maintains momentum
Mindset Note: Focused and flowing. No forcing — I’ve tracked this from HTF to LTF and now I’m just waiting for price to invite me in. Clarity + patience = execution.
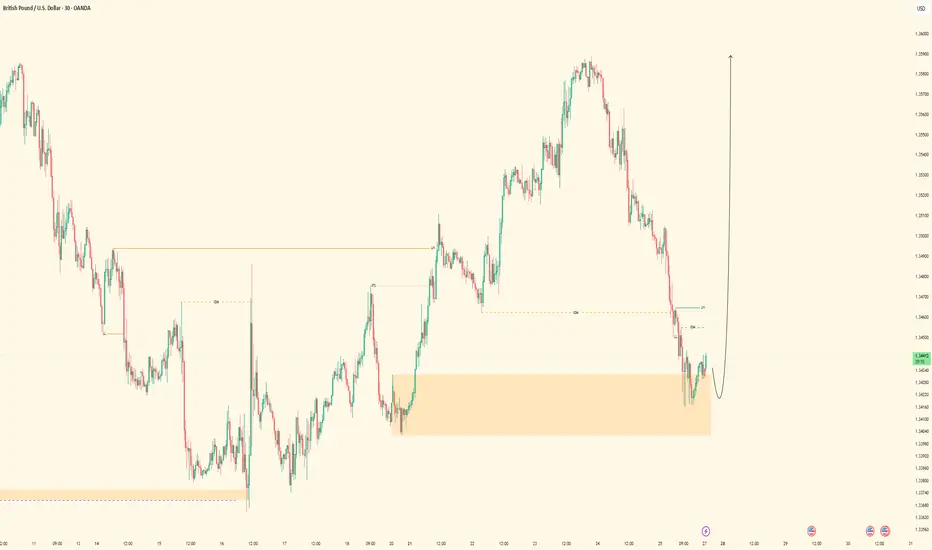
GBPUSD | Bullish Bias - Midframe Alignment After SSL SweepPair: GBPUSD
Bias: Bullish
HTF Overview (4H):
Price structure is clearly bullish with strong intent. Looking to ride momentum as price continues toward 30M and 4H highs.
LTF Confirmation (30M):
Structure has been refined. Price swept sell-side liquidity and cleanly mitigated a key 30M OB — now I’m monitoring for LTF alignment to catch the continuation.
Entry Zone: Waiting for 5M CHoCH to flip bullish. Entry comes on the pullback into demand once the shift confirms.
Targets: 5M highs, 30M highs — trailing based on delivery and momentum
Mindset Note: No emotion, no forcing. Waiting for alignment from Smart Money and letting price invite me in. Clarity leads, execution follows.
EURUSD| Bullish Bias - Refined OB Play into ContinuationPair: EURUSD
Bias: Bullish
HTF Overview (4H):
Bullish structure remains intact — recent break to the upside was followed by a healthy pullback. Now price is continuing the push toward external 4H highs.
LTF Confirmation (30M):
Structure refined from last week. Price recently mitigated a 30M demand OB and is now showing signs of continuation. Watching for clean 5M shift to confirm the next leg.
Entry Zone: 5M CHoCH flip followed by pullback into demand zone
Targets: 30M highs, then extended target at 4H highs
Mindset Note: Keeping it clean and reactive. No guessing — I’m tracking Smart Money flow, structure shift, and waiting on my cue.