Gold has option to go into a steep bullish retest of broken lowsExplanation in video. Let me know if there was anything I missed in this analysis.
Share with anyone who may be interested 🫡
Multiple Time Frame Analysis

NASDAQ Still failing to secure meaningful closes above the rangeAll explained in video. Please let me know if there is anything I may have missed in this analysis.
Thanks and share with anyone who may be interested 🔓

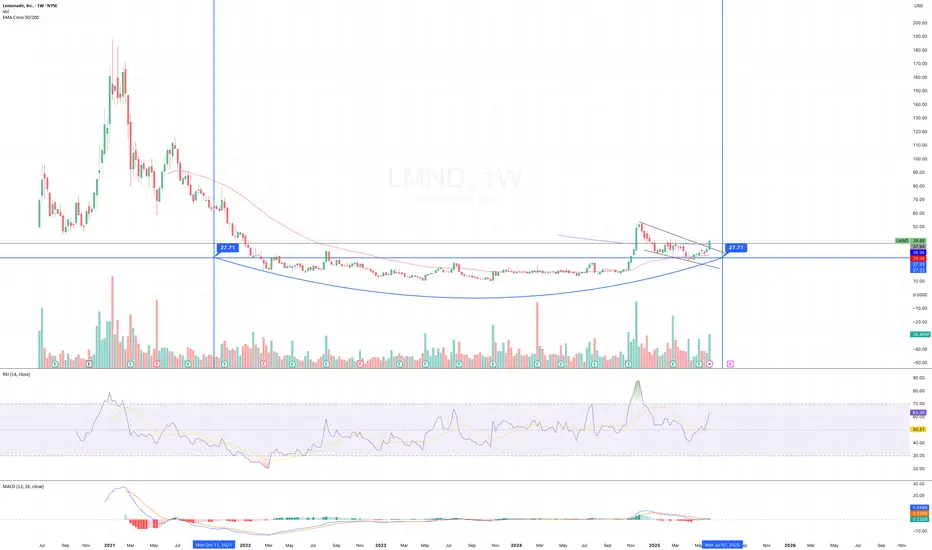
Stock of the Week ! LMND Price Action June 2025Overview
Name: Lemonade, Inc.
Ticker Symbol: LMND
Exchange: New York Stock Exchange (NYSE)
Founded: 2015
Headquarters: New York City, USA
CEO: Daniel Schreiber (as of 2025)
Sector: Financial Services
About
Lemonade is a technology-driven insurance company that uses artificial intelligence (AI) and behavioral economics to disrupt traditional insurance. It offers a variety of insurance products through a mobile-first, digital platform:
Renters insurance
Homeowners insurance
Pet insurance
Term life insurance
Car insurance
Fundamentals
Overview
Statements
Earnings
Revenue
Key Takeways
Lemonade had a robust quarter with growth accelerating to 27% year-on-year to $151 million in Q1 2025., the 6th quarter of year-over-year (YOY) acceleration, and outperforming. The company posted losses this quarter that was less than expected.
Technicals
Price has crossed above the 50-week EMA (~$30) and is now at $38.98, suggesting strong bullish momentum. The 50-day MA also just crossed the 200 day MA forming a golden cross.
It also recently broke out of a falling wedge pattern formation on the 4hr timeframe.
It has formed and broken out a saucer suggesting a price reversal from 2021 on the weekly chart suggesting bullish momentum.
My Take
NYSE:LMND is showing a clear bullish momentum though it has entered overbought RSI signaling a consolidation or pullback near $42-$45 range. I am looking for a potential upside to
$52 by the end of the month.
Position: LMND 40 Call June 20 2025
Quantitly: 10
Average Cost Basis: 1.26
Last Price: 2.33
Total % Gain/Loss: +85%
Follow Up To Lemonade VideoHi, all. Just posting the chart idea outside of my video as well. This way you can press that "play" button and track how my trade idea is doing in real time. I've always really liked this feature.
If you want more of the thesis behind why I like NYSE:LMND , please feel free to scroll through the video that I just recorded.
Here's to further strong price action!
Reagen

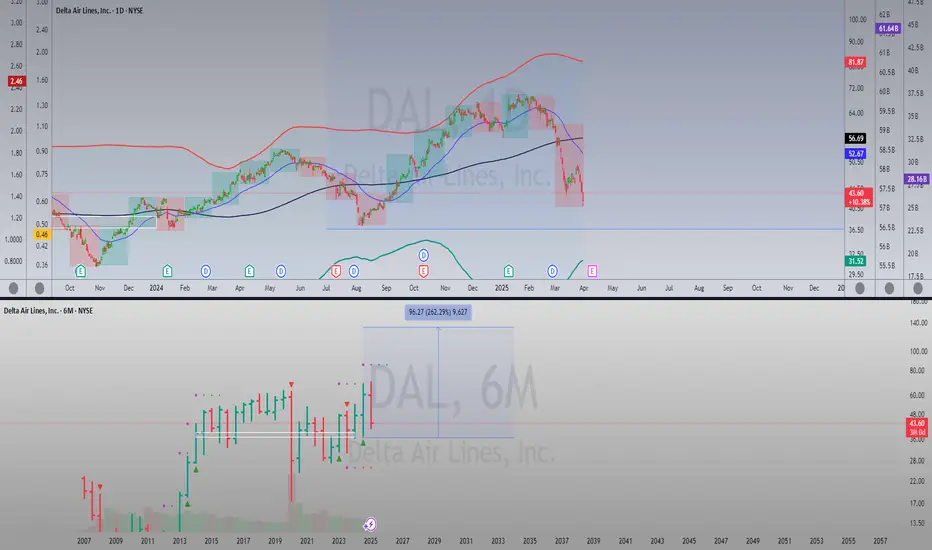
Delta Airlines - Long Term FlyerHey, all. Pretty intense idea here, but I am a buyer of NYSE:DAL at these levels. Obviously, the chart looks awful from a recent performance perspective. However, if you take a long term view, we could actually be rebalancing after an initial range expansion to the upside. Just like NASDAQ:RIVN , airlines are/have been a pretty brutal investment. I guess I have a thing for pain. Ha.
I am certainly a believer that airlines are undervalued here and can reverse back to the upside. Of course, it goes against the current narrative that the economy is showing signs of weakness. But I am just willing to take the risk on this one. I believe the consumer and culture shift in the US to have more experiences in life will continue to hold.
Are we going to come in for a hard landing, or take off to cruising altitude? We'll see what kind of lift the market will give us. Right now the turbulence is pretty intense.
Lemonade, Inc. Showing Momentum - Lets Make Lemonade!Hey, everyone. Wanted to get a video out since it has been awhile. Sorry about the rustling in the audio - bear with me as it is not a theme throughout.
I am pretty excited about the momentum that NYSE:LMND is showing. I've been in it with a position for a little bit lately, and was fortunate to catch the previous pump with profit, but I think the momentum has a strong chance to continue here.
I pretty much cover all my thoughts behind the idea in the video, so feel free to scroll through it at your own rate. I will post it as a chart idea as well so that you can hit the play button and track how the idea is actively performing.
Hope you all were able to whether the tariff tantrum and hoping the market can maintain its current positioning, or, better yet, show continued strength.
Enjoy,
Reagen

EURJPY ANALYSIS After seeing the previous week close really bullish on the daily and weekly timeframes, we could expect that momentum to continue pushing but since the pair is at a HH area on the daily we could expect a pull back before the bullish move kicks in

GBPUSD ANALYSISAfter seeing the previous week close above 135.000 we could expect a retest of that area before the market continues to the upside, but in the mean time the daily and 4hr are currently showing bearish type setups which could be a sign that the retracement on the weekly could form

SUPER Showing Same Cycle Structure as Last 2 RalliesSuperVerse is forming the exact same base structure that preceded its last two explosive rallies — both of which yielded 400%+ and 1800%+ moves within a few months.
We’re currently trading in the $0.61–$0.67 range — right where historical expansion phases have begun. Volume is drying up, EMA ribbons are compressing, and the chart is coiling just above proven structural support. This is typically the point where patient entries see the most asymmetric upside.
Stop placement is clear ($0.55 or $0.49 depending on risk appetite), and the first leg up targets $0.90. Beyond that, $1.30 and $2.00 line up with past cycle symmetry.
If $0.75 breaks clean, this setup activates fully. I’ll be watching volume closely for confirmation. Until then, I’m accumulating with tight risk and clear conviction.
Drop your thoughts below — do you see the same pattern repeating?

Weekly Forex Outlook Sun.June.8.2025 - Fri.June.13.2025Like and Comments would be appreciated :D Not Financial Advice, Just my outlook/opinion

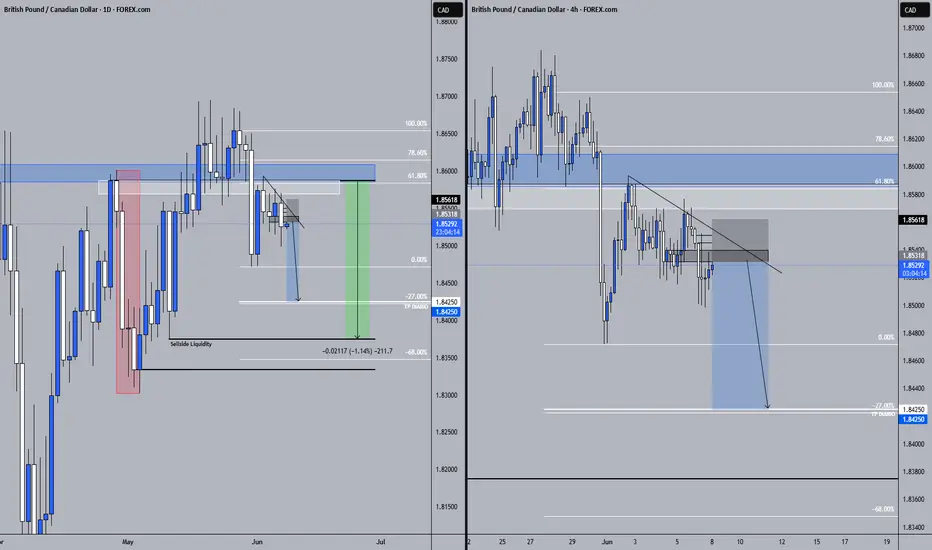
GBPCAD 08/06/2025Weekly:
-Price is at weekly highs and we could expect a reaction.
Daily:
-H&S pattern.
4H:
-Bearish W pattern.
-H&S pattern.
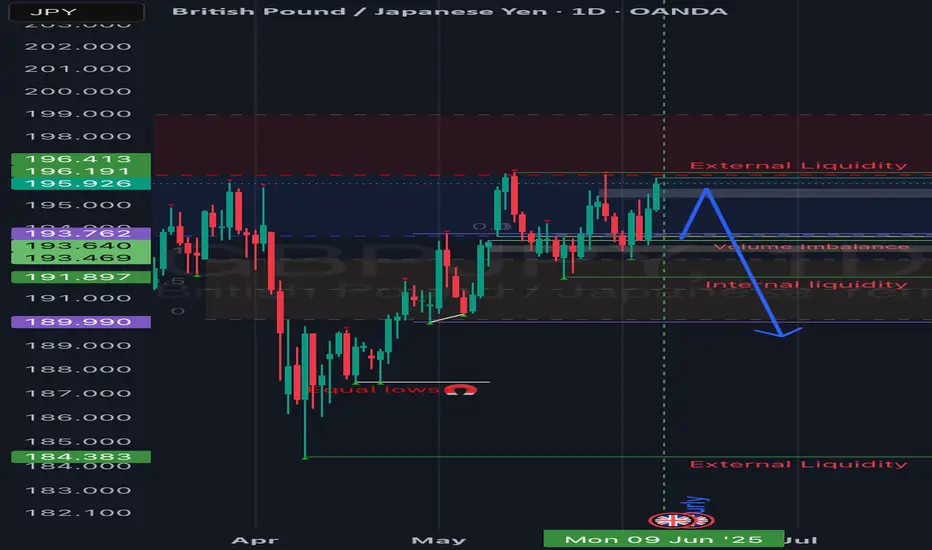
GBPJPY UPDATE!!Good day traders, I am back again with an update and this time it's on GBP/JPY. On the 1st of June I posted a setup but I mentioned that I will explain it later because I will be able to make my point clearer and easy to understand.
When this setup was posted I had that daily order block in mind, only because I needed to see it revisit the order block for the last time before price could make a run for that internal liquidity resting inside an unfilled FVG(BISI). We can also use that thought as confluence when looking for short term reversals or partial exits. Just by taking a look on the chart I posted again I will put it in the description below, you can see in the sell side of the chart we have a lot of equal lows and ICT teaches us that price looks for relative lows/equal lows and old lows.
On the daily TF price is currently inside a bearish order block and what we do not wanna see is price going over the wick of that wick of a candle that was booked on the 29th of May. We are also inside the premium zone of the wick meaning we can expect to run from there to our objectives below. As always my first objective is always the internal liquidity and that is only because that internal liquidity are my LTF | Highs/Lows.
On the 4H price is inside a balanced price range again that's in my favour meaning I have to note it. ICT teaches that we always wanna trade towards the direction where all our PD arrays are lining up and in this case, it's in the sellside, I believe we are in the starting phase of ICT's sell model.
My name is Teboho Matla but you...you don't know me yet!!
Long trade
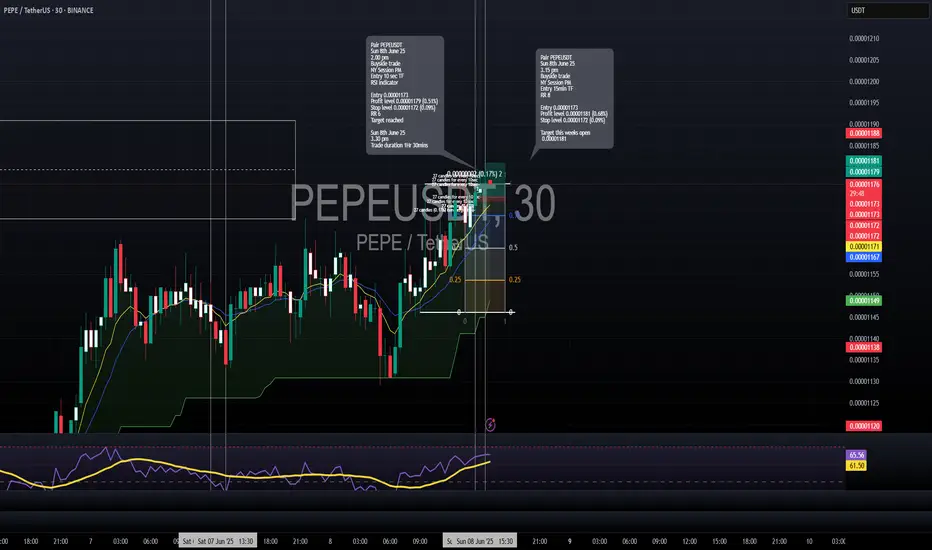
30min TF overview
📘 Trade Journal Entry — PEPEUSDT (Buyside Trade)
🗓 Date: Sunday, 8th June 2025
⏰ Time: 3:15 PM
📍 Session: NY Session PM
📈 Timeframe: 15-Minute
🎯 Target: This Week’s Open (0.00001181)
📊 Risk-Reward Ratio: 8.0
🔹 Trade Details:
Entry Price: 0.00001173
Take Profit: 0.00001181 (+0.68%)
Stop Loss: 0.00001172 (−0.09%)
15min TF overview
🔹 Technical Breakdown:
Bias: Buyside pressure observed with steady reclaim of mid-range levels.
Market Context: Entered during a slow grind upwards toward the weekly open.
Confluence Factors:
Clean 15m structure supported upward continuation.
RSI was rising with momentum, confirming higher lows.
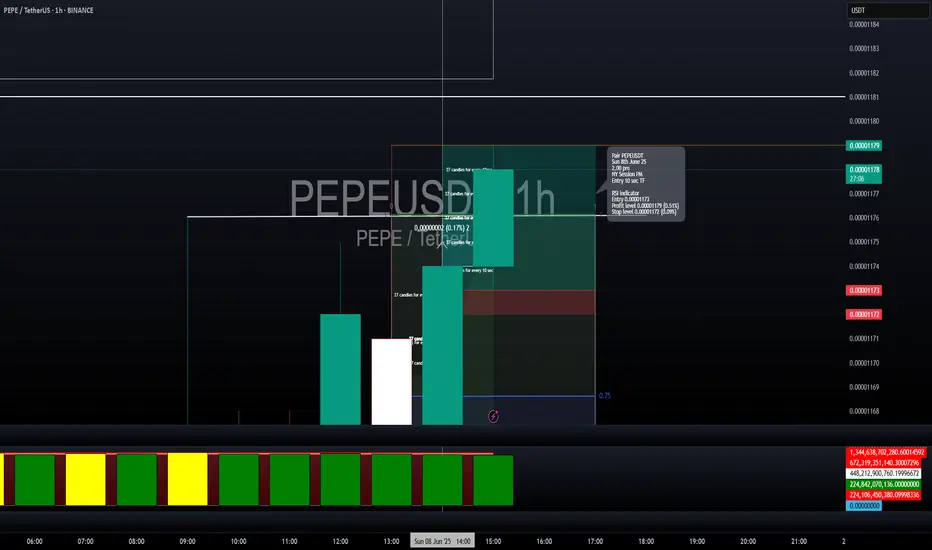
Long trade
15min TF overview
📘 Trade Journal Entry — PEPEUSDT (Buyside Trade)
🗓 Date: Sunday, 8th June 2025
⏰ Time: 2:00 PM
📍 Session: NY Session PM
📈 Timeframe: 10-Second Chart (High-Frequency Scalping)
🧠 Confirmation Tool: RSI Indicator for directional bias
🎯 Result: ✅ Target hit successfully
🔹 Trade Details:
Entry Price: 0.00001173
Take Profit: 0.00001179 (+0.51%)
Stop Loss: 0.00001172 (−0.09%)
Risk-Reward Ratio: 5.10
10 sec TF entry
🔹 Technical Breakdown:
RSI Confirmation: RSI divergence spotted on microstructure, indicating short-term oversold conditions. Entry Trigger: Price action reclaimed the short-term support zone while RSI reversed upward from the 30-level—execution: Executed immediately after a bullish micro-candle and RSI confirmation crossover.
10 sec TF entry overview
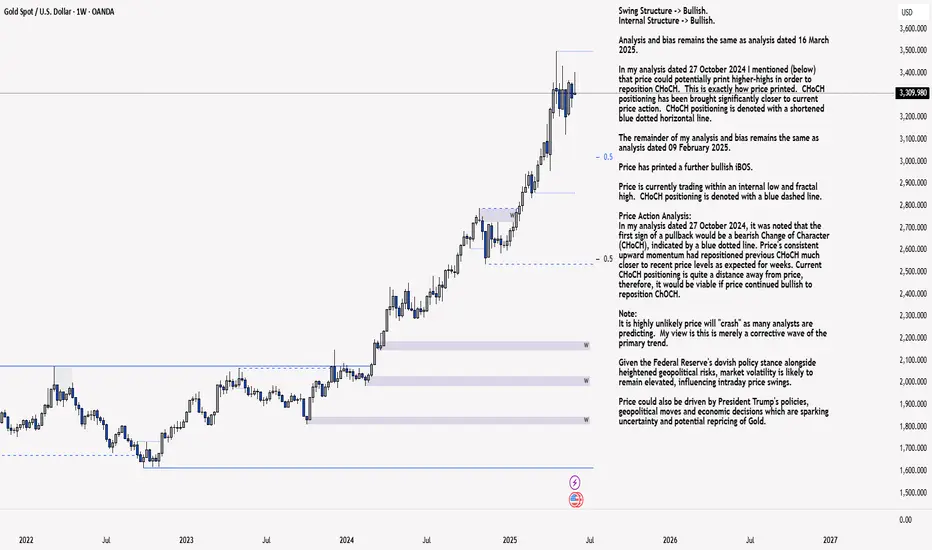
XAU/USD 09-13 June 2025 Weekly AnalysisWeekly Analysis:
Swing Structure -> Bullish.
Internal Structure -> Bullish.
Analysis and bias remains the same as analysis dated 16 March 2025.
In my analysis dated 27 October 2024 I mentioned (below) that price could potentially print higher-highs in order to reposition CHoCH. This is exactly how price printed. CHoCH positioning has been brought significantly closer to current price action. CHoCH positioning is denoted with a shortened blue dotted horizontal line.
The remainder of my analysis and bias remains the same as analysis dated 09 February 2025.
Price has printed a further bullish iBOS.
Price is currently trading within an internal low and fractal high. CHoCH positioning is denoted with a blue dashed line.
Price Action Analysis:
In my analysis dated 27 October 2024, it was noted that the first sign of a pullback would be a bearish Change of Character (CHoCH), indicated by a blue dotted line. Price's consistent upward momentum had repositioned previous CHoCH much closer to recent price levels as expected for weeks. Current CHoCH positioning is quite a distance away from price, therefore, it would be viable if price continued bullish to reposition ChOCH.
Note:
It is highly unlikely price will "crash" as many analysts are predicting. My view is this is merely a corrective wave of the primary trend.
Given the Federal Reserve's dovish policy stance alongside heightened geopolitical risks, market volatility is likely to remain elevated, influencing intraday price swings.
Price could also be driven by President Trump's policies, geopolitical moves and economic decisions which are sparking uncertainty and potential repricing of Gold.
Weekly Chart:
Daily Analysis:
Swing -> Bullish.
Internal -> Bullish.
Analysis and Bias remains the same as Analysis dated 11 May 2025.
Since my last weekly analysis price has finally printed a bearish CHoCH.
This is the first indication, but not confirmation of bearish pullback phase initiation.
Price is now trading within an established internal range.
Price should now technically trade down to either discount of 50% internal EQ, or Daily demand zone before targeting weak internal high, priced at 3,500.200.
Note:
The Federal Reserve’s continued dovish stance, coupled with escalating geopolitical uncertainties, is expected to sustain elevated market volatility, influencing both intraday and broader trend developments.
Additionally, price action may be further shaped by U.S. policy decisions, including measures enacted under President Trump. Shifts in geopolitical strategy and economic policymaking could introduce further uncertainty, contributing to the ongoing repricing dynamics within the gold market.
Daily Chart:
H4 Analysis:
-> Swing: Bullish.
-> Internal: Bullish.
Analysis and bias remains the same as analysis dated 23 April 2025
Price has now printed a bearish CHoCH according to my analysis yesterday.
Price is now trading within an established internal range.
Intraday Expectation:
Price to trade down to either discount of internal 50% EQ, or H4 demand zone before targeting weak internal high priced at 3,500.200.
Note:
The Federal Reserve’s sustained dovish stance, coupled with ongoing geopolitical uncertainties, is likely to prolong heightened volatility in the gold market. Given this elevated risk environment, traders should exercise caution and recalibrate risk management strategies to navigate potential price fluctuations effectively.
Additionally, gold pricing remains sensitive to broader macroeconomic developments, including policy decisions under President Trump. Shifts in geopolitical strategy and economic directives could further amplify uncertainty, contributing to market repricing dynamics.
H4 Chart:
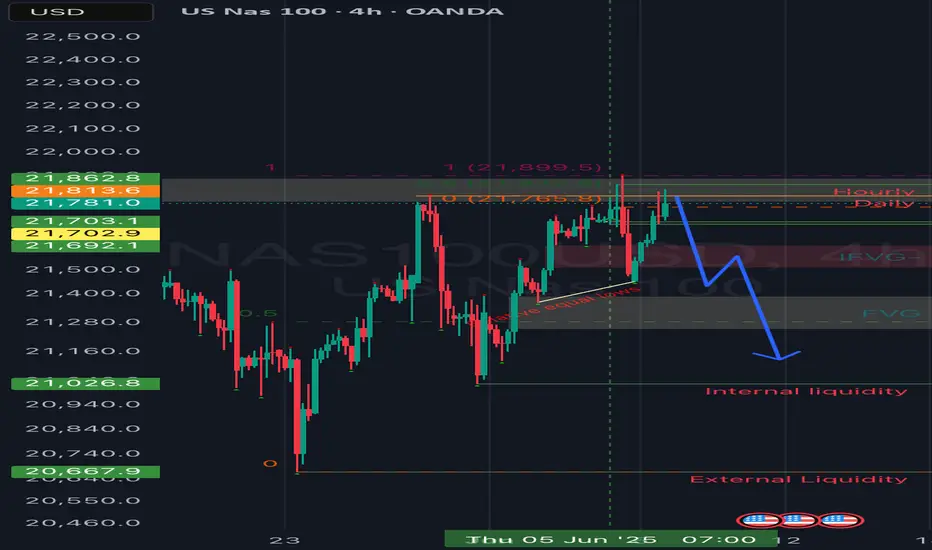
NQ tumbles?Good day traders, I don't know why but I get a bit scared when it comes to analyzing NQ. I always doubt myself with it.
On the weekly TF price is trading inside an order block and for the past two weeks price has visited the order block two times. In the two times that price revisited the order block it failed to close above the midpoint indicating the strength of the order block, going into the new week I am going to use the discount zone of the OB+ as my resistance.
On the daily TF before I say much, THERE IS A GAP, and price did not trade to it since opening high on the 12th May. That gap is my target and I want to see price go and fill that volume imbalance as ICT calls it.
Still on the daily TF...when you read price for past two weeks on NQ, you'll quickly come to a realization that price has been expanding higher since Tuesday 3rd June, but expanding to where?...well liquidity resting above the high of the candle booked on the 29th of May.
Now on the 4 hour TF things are opening up and price is becoming clearer and it goes to show the importance of multi time frame analysis. The lows of Tuesday and Thursday make the relative equal lows that are shown on the chart. The internal liquidity shown below is my short term target or TP1. The red triangle represents that 4H inverse FVG and once price is trading below the inverse any movement inside that inverse should show weakness!
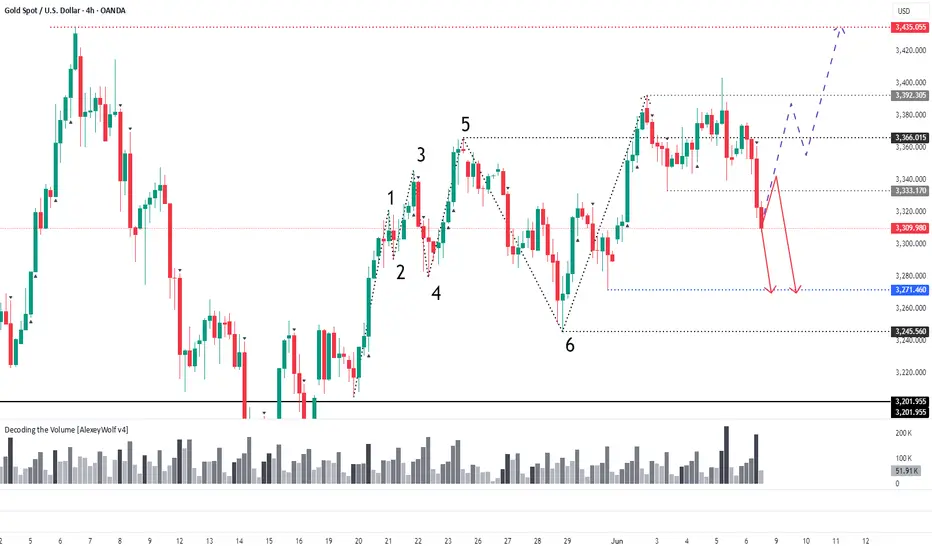
GOLD 4HLocal range near top of broader sideways (gray lines = local range).
Seller broke down from it.
Price now in buyer zone — possible buyer reaction. Just below: a gap.
Seller targets: 3271, 3245.
Conservative shorts: watch for buyer activity + seller defending local range breakout (3333).
Note: buyer initiative still active on daily TF (!).
For longs, better to wait near 3245–3271 and look for bullish patterns.
This analysis is based on the Initiative Analysis concept (IA).
Wishing you profitable trades!
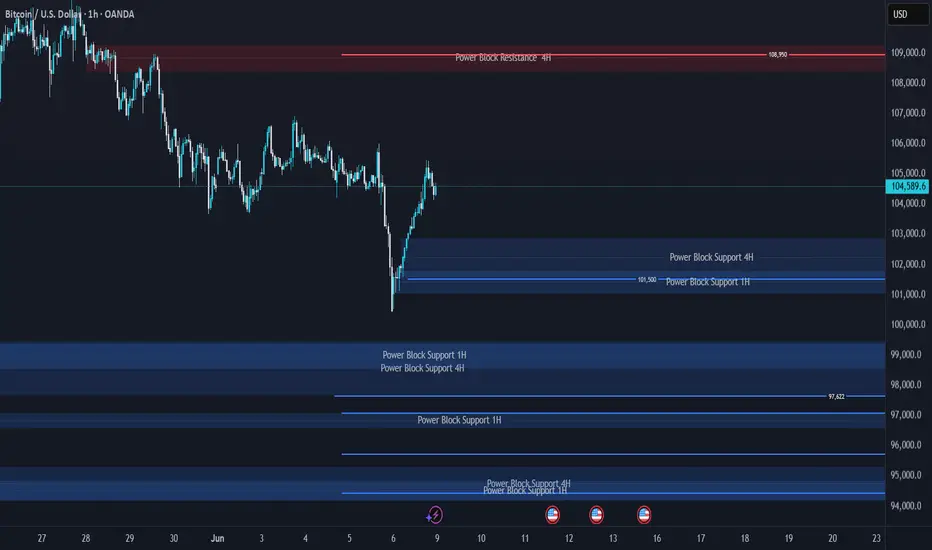
BITCOIN Support & Resistance Levels🚀 Here are some key zones I've identified on the H4/H1 timeframe.
These zones are based on real-time data analysis performed by a custom software I personally developed.
The tool is designed to scan the market continuously and highlight potential areas of interest based on price action behavior and volume dynamics.
Your feedback is welcome!
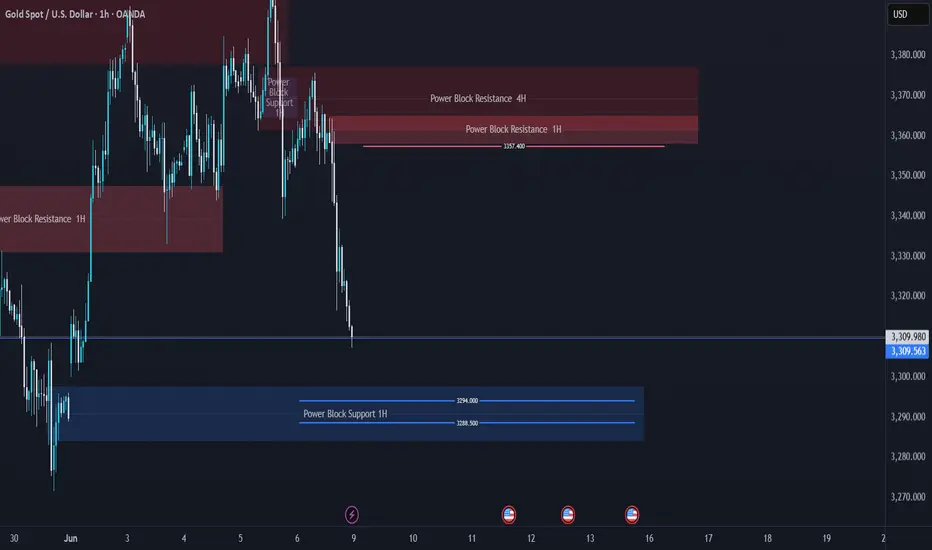
XAUUSD Support & Resistance Levels🚀 Here are some key zones I've identified on the H4/H1 timeframe.
These zones are based on real-time data analysis performed by a custom software I personally developed.
The tool is designed to scan the market continuously and highlight potential areas of interest based on price action behavior and volume dynamics.
Your feedback is welcome!
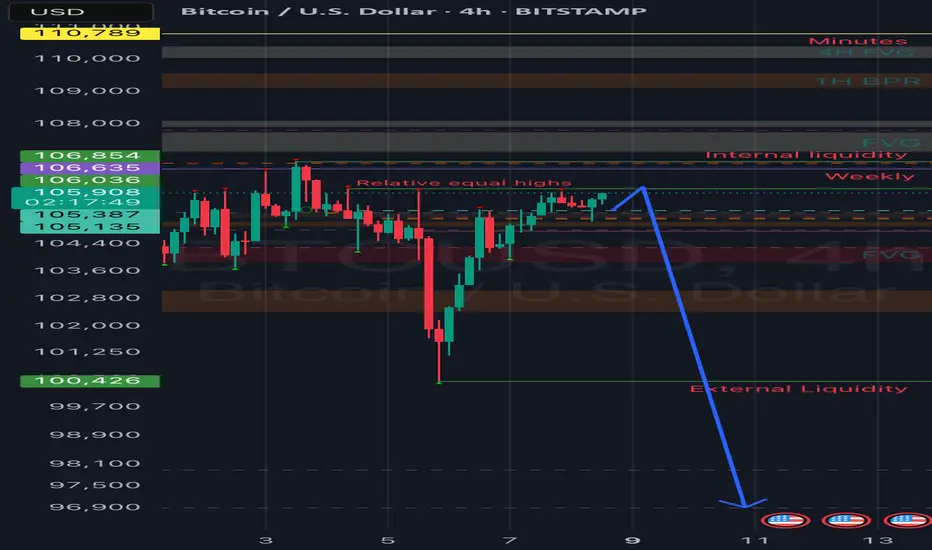
Bitcoin plummets!!Good day traders, I am back with yet another update on BTC/USD. My last update on bitcoin what I was expecting price to do unfortunately did not happen as price was very weak, I had a FVG(SIBI) that I really wanted price to revisit and the two price levels that make up the SIBI are 107752 and 107149.
Now that both our sellside liquidity were taken does that mean price is now gonna look for the buyside liquidity? My honest opinion is I don't think because I said 97k is insight and I believe it can still happen and it will according to my HTF perspective.
On the daily TF we have clear sight of relative highs that we wanna see price take and that might happen today but my short term objective is the high that was booked on Tuesday. That Tuesday's candlestick has a very large wick and from my time learning with ICT's content, wicks contain a lot of price data that can be used either for entries or exits.
4H- Here we had a shift in market structure lower on Thursday but price has been bullish ever since the shift happened. On this respective TF we have equal highs too, and ICT teaches us to always focus our attention on them mainly because price looks for liquidity and imbalances on the 4 hour TF...should we look closely on the left of our screens or chart, there is an order block from the wick I mentioned above. Again what are the rules of an order block?..
FROM TOMORROW PRICE WILL START TO PLUMMET!!
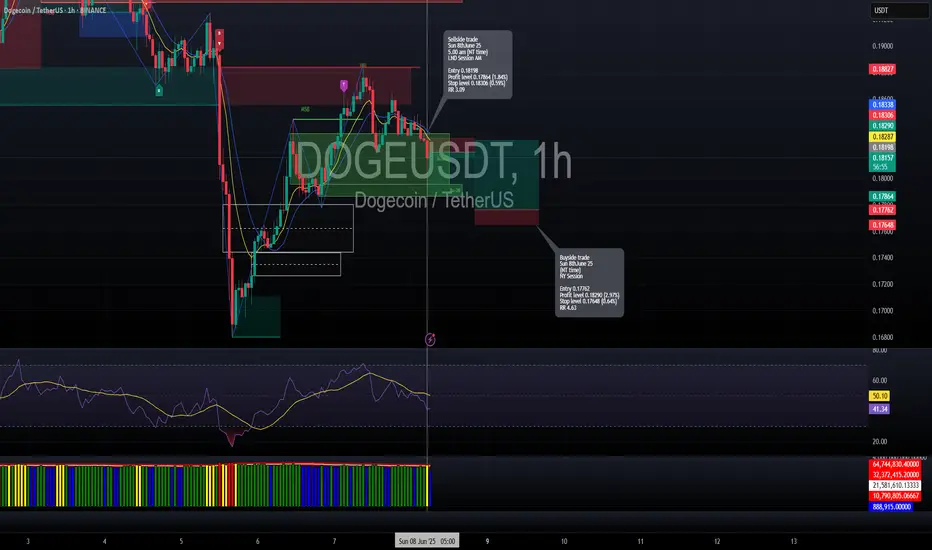
Short trade
📕 Trade Journal Entry — DOGEUSDT (Sellside Trade)
🗓 Date: Sunday, 8th June 2025
⏰ Time: 5:00 AM (NY Time)
📍 Session: London Session AM
📈 Timeframe: (Not specified – assumed short-term trade)
🔹 Trade Details:
Entry Price: 0.18198
Take Profit: 0.17864 (+1.84%)
Stop Loss: 0.18306 (−0.59%)
Risk-Reward Ratio: 3.09
🔹 Technical Context:
Trade was taken on signs of rejection at a previous resistance level after a rally.
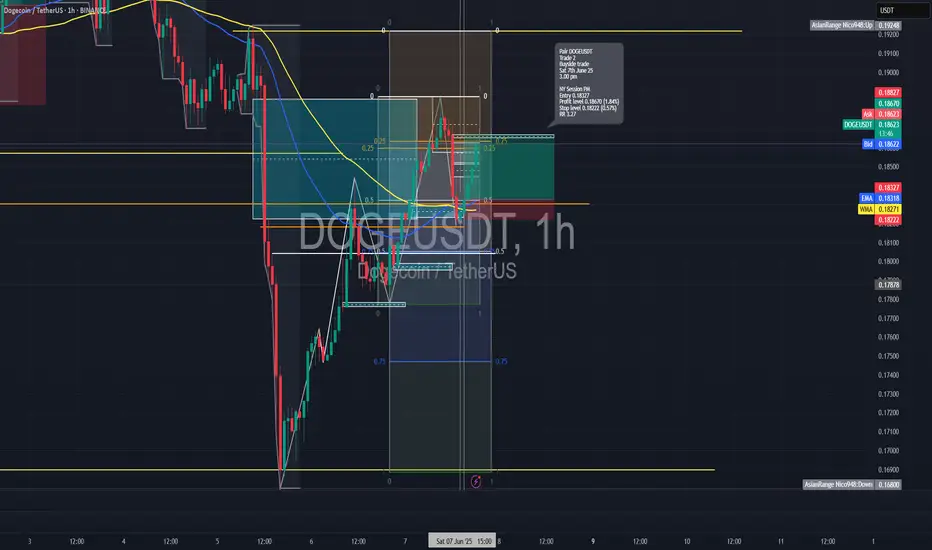
Long trade
📘 Trade Journal Entry — DOGEUSDT (Buyside Trade 2)
🗓 Date: Saturday, 7th June 2025
⏰ Time: 3:00 PM
📍 Session: New York PM
📈 Timeframe: 1-Hour
📊 Market Structure Tool: Bullish Break of Structure + Fair Value Gap Retest
🧠 Confirmation Tool: Rejection from Demand + Volume Support
🔹 Trade Details:
Entry Price: 0.18327
Take Profit: 0.18670 (+1.84%)
Stop Loss: 0.18222 (−0.57%)
Risk-Reward Ratio: 3.27
🔹 Technical Breakdown:
Market Structure:
On the 1-hour chart, price broke a key lower high, shifting the structure bullish.
Entry was taken after a clean retracement into a fair value gap (FVG) within the new bullish leg.
Entry Confirmation:
Price exhibited a clear bullish reaction at the FVG zone,
Momentum & RSI:
RSI stayed above 50, showing strong bullish momentum.
Long trade
📘 Trade Journal Entry — ETHUSDT (Buyside Trade)
🗓 Date: Saturday, 7th June 2025
⏰ Time: 4:00 PM (NY Time)
📍 Session: NY Session PM
📈 Timeframe: 1-Hour
🎯 Result: ✅ Target hit successfully
🔹 Trade Details:
Entry Price: 2,518.91
Take Profit: 2,561.82 (+1.70%)
Stop Loss: 2,513.19 (−0.23%)
Risk-Reward Ratio: 7.5
🔹 Technical Context:
Entered a strong bullish continuation pattern on the 1Hr timeframe.
Confirmed by confluence of higher lows and demand zone support.
