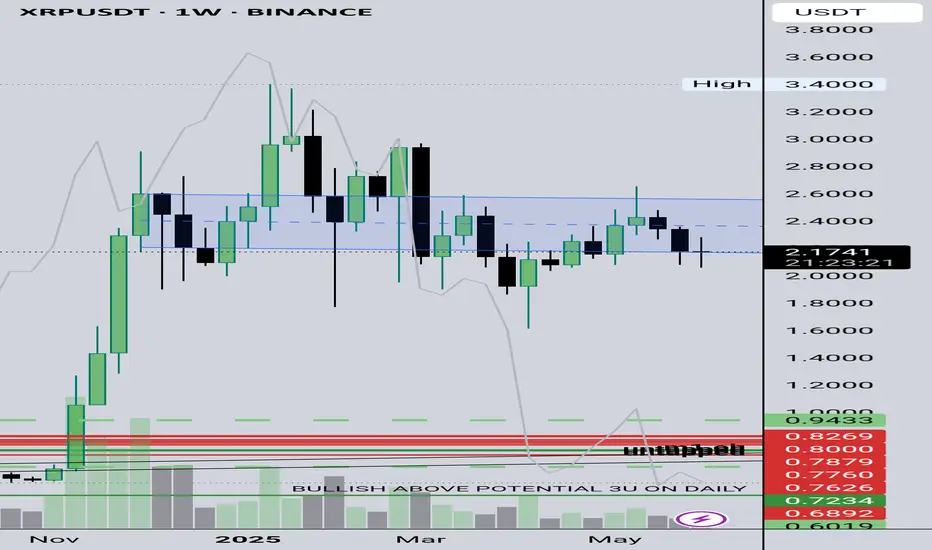
XRP Back on the MENU! XRPUSD Ripple next move? XrpUsdtIt's been a while since we looked at this chart.
🌍 SeekingPips 🌎 View remains the same and so we are strictly looking for strategic LONG entry points in
TIME & PRICE. 👌
Yes it's a WEEKLY chart and I understand that many of the trigger happy TRADERS or in some cases GAMBLERS can't stand to look at anything longer than a 30 minute chart BUT really sometimes you really just have to STEP RIGHT BACK to see the BIGGER PICTURE👍
✅️This week's candle CLOSE really has the potential to setup the next few weeks for easy MULTIDAY TRENDING MOVE TRADE SETUPS 👍
ℹ️ Note the price location on what we viewed as a HTF FLAG MANY WEEKS AGO .
Yes it was breached both sides but 🌎SeekingPips🌍 doesn't trade the patterns themselves but the HUMAN PSYCHOLOGY AROUND THESE PATTERNS.🤔
ℹ️ Note where most of the volume has been trading and also note the moves around the extreems of the dead patteren too.💡
In an even higher TIMEFRAME THE FLAG would still be valid and forming the flag itself too.
📊 [ b]CHECKOUT the MONTHLY chart for the example. 📉
Anyway we will see what the next 48 hours🕦 hold but no doubt this one is on our RADAR this week.
✴️ 2.048 to hold otherwise a potential for current low of this year to be tested.
✴️ Alternatively if support starts to form on the 240min chart at current levels last weeks high could expected to be tested
✴️ if so Xrp could easily give a multiday upside trending move.
Now like a NINJA we wait and stalk...
As always ladies and gentlemen whilst Seeking Pips 🌍 SeekingPips 🌎 says
" NO TRIGGER NO TRADE"
& "STICK TO YOUR PLAN"✅️
👍 Have a GREAT WEEK and we will see you soon with an UPDATE...
Multiple Time Frame Analysis
Long trade
1Hr TF overview
📘 Trade Journal Entry
BTCUSD (Buyside Trade)
Date: Saturday, 7th June 2025
⏰ Time: 5:00 AM (NY Time)
📍 Session: London AM
📈 Timeframe: 1Hr
📊 Market Structure Tool: Break of Structure + FVG Entry
🧠 Confirmation Tool: Clean Bullish Momentum
🔹 Trade Details:
Entry Price: 104,993.53
Take Profit: 106,180.50 (+1.13%)
Stop Loss: 104,687.73 (−0.29%)
Risk-Reward Ratio: 3.88
🔹 Technical Breakdown:
Market Structure:
Clean bullish market structure with higher highs and higher lows.
Break of previous structure and retrace into a bullish FVG confirmed intent.

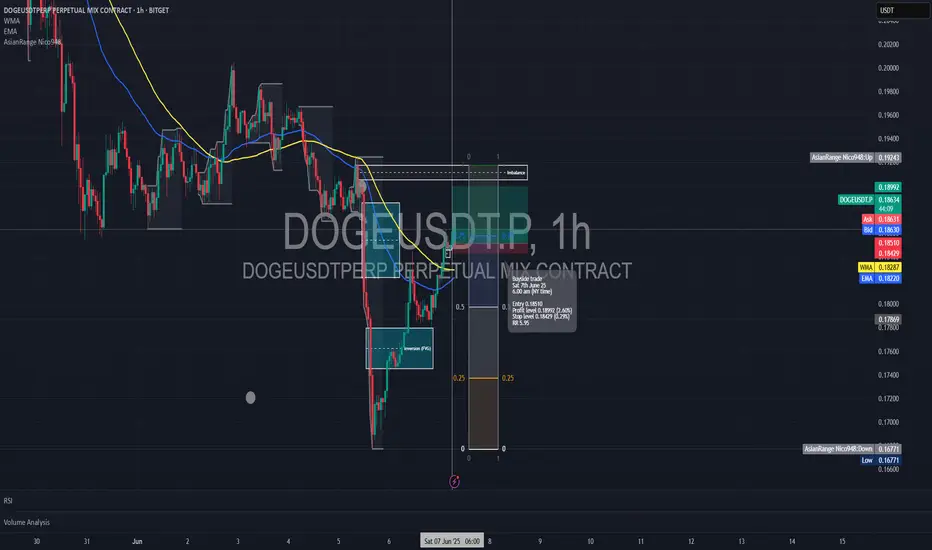
Long trade
1Hr TF overview
📘 Trade Journal Entry
DOGEUSDT (Buyside Trade)
Date: Saturday, 7th June 2025
⏰ Time: 6:00 AM (NY Time)
📍 Session: London AM
📈 Timeframe: 1Hr
📊 Market Structure Tool: Bullish Break of Structure + FVG Reaction
🧠 Confirmation Tool: Bullish Momentum Continuation
🔹 Trade Details:
Entry Price: 0.18510
Take Profit: 0.18992 (+2.60%)
Stop Loss: 0.18429 (−0.29%)
Risk-Reward Ratio: 5.95
Momentum & Flow:
Clean continuation pattern post-entry.
RSI remained neutral to bullish, supporting the direction with no divergence.
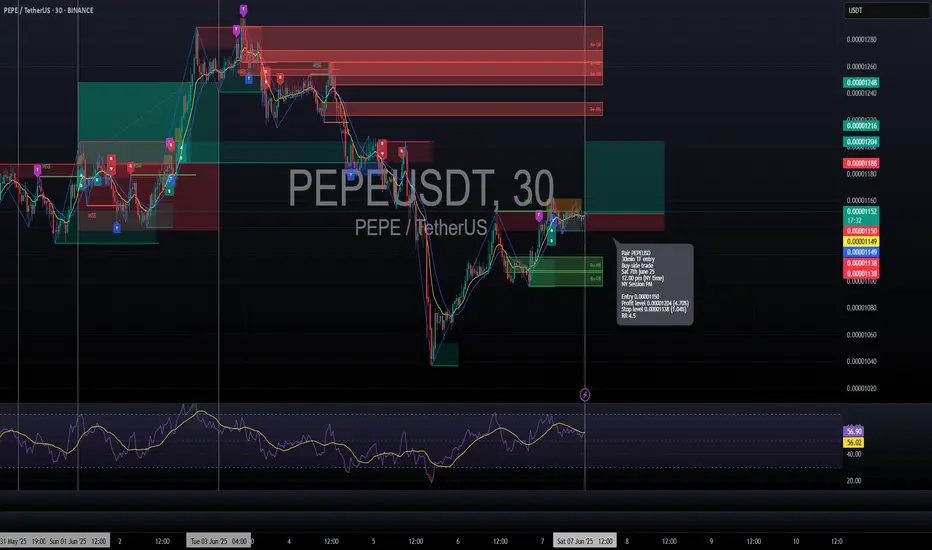
Long trade
30min TF
📘 Trade Journal Entry
PEPEUSD (Buyside Trade)
🗓 Date: Saturday, 7th June 2025
⏰ Time: noon (NY Time)
📍 Session: New York PM
📈 Timeframe: 30 minutes
📊 Market Structure Tool: Break of Structure
🧠 Confirmation Tool: Bullish Continuation + Range Expansion Setup
🔹 Trade Details:
Entry Price: 0.00001150
Take Profit: 0.00001204 (+4.70%)
Stop Loss: 0.00001138 (−1.04%)
Risk-Reward Ratio: 4.5
🔹 Technical Breakdown:
Market Structure:
Trade entered after confirmation of bullish structure break and higher low formation.
Price pulled back into a discounted range, respecting a prior accumulation zone.
XRPUSD SCALPING XRPUSD – Scalp Setup: Buy Into Sell (AUTH Liquidity Framework)
XRPUSD is presenting a two-phase scalp opportunity based on liquidity behavior — first a buy-side reaction, followed by a sell-off from premium liquidity.
🔹 Buy Phase – Liquidity Rebound Setup
Price has swept a key sell-side liquidity pocket below recent equal lows, triggering a reactive move.
• Buy Entry: After lower timeframe confirmation (M5–M15 bullish shift)
• Target: Short-term rally toward internal highs where buy-side liquidity rests
• Exit Zone: Prior to major resistance or supply zone to secure profits
🔹 Sell Phase – Reversal From Overhead Liquidity
Once internal highs are cleared and liquidity is taken, a reversal setup forms.
• Sell Entry: Upon rejection from premium zone or after liquidity sweep above key highs
• Confirmation: Bearish structure shift or strong rejection wick
• Target: Value area retrace or inefficiency fill toward lower structure
📌 Follow for a free intro class on the AUTH Masterpiece System — learn how to spot precision setups like this using liquidity, structure, and value alignment.
Disclaimer: This idea is for educational purposes only and does not constitute financial advice. Trade at your own risk.

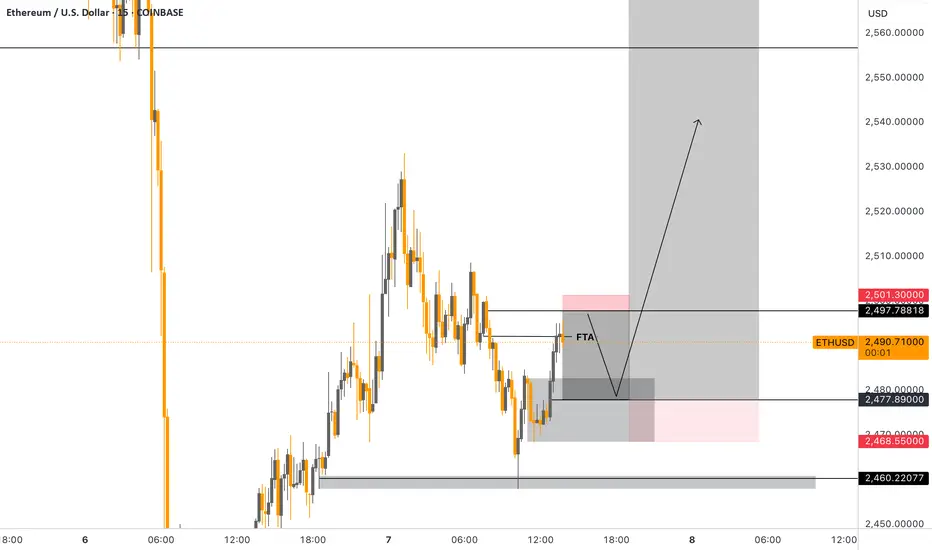
BTCUSD SELLSBTCUSD – Clean Sell Setup (AUTH Liquidity-Based)
BTCUSD is approaching a high-probability short zone after a strong retracement into overhead liquidity. Based on AUTH (Areas of Liquidity Trading), this setup identifies key zones where liquidity is likely to be collected before a potential drop.
Setup Breakdown:
FTA – First Trouble Area:
A nearby reaction zone just below current price. This may cause a temporary bounce or slowdown in the bearish move but is not the main target.
Inversion Point:
A previously significant support level that has been broken and now acts as resistance. This level may trap late buyers and provide fuel for continuation lower.
VAL – Value Area Low:
The lower edge of a past consolidation range. Price often gravitates here during rebalancing moves and it acts as a realistic profit target.
AUTH Liquidity Zones:
• Above price: Resting buy stops above recent highs and engineered wicks — a common area for stop-hunt reversals.
• Below price: Clean equal lows, unfilled imbalances, and trendline supports — ideal targets for institutional-level downside expansion.
Trade Plan:
Wait for upper liquidity to be swept and monitor for lower timeframe confirmation (e.g. bearish engulfing, break of structure) before entering. Focus is on entering after liquidity is triggered — not before.
🔔 Follow me for a free intro class to my AUTH Masterpiece Liquidity System — designed to help traders read market intention through liquidity flow, not indicators.
Disclaimer: This is not financial advice. The content is for educational purposes only. Always do your own analysis and manage risk carefully.
ETHUSDETHUSD – Bearish Sell Setup (AUTH Liquidity Model)
ETHUSD is currently in a retracement phase after rejecting from a recent high. Price action is approaching a zone rich in overhead liquidity, offering a clean short opportunity based on AUTH (Areas of Liquidity) principles.
⸻
Key Elements of the Setup:
FTA – First Trouble Area:
A minor demand zone just below current price where a short-term reaction could occur. This is not the main target, but a potential bounce point.
Inversion Point:
A previously supportive level that now acts as resistance. Often, this is where trapped buyers from earlier rallies exit, fueling momentum for further downside.
VAL – Value Area Low:
A historically high-volume area where price previously consolidated. It often acts as a target for rebalancing moves.
AUTH Liquidity Zones:
• Above price: Stacked buy stops above recent highs and wick clusters
• Below price: Sell-side liquidity in the form of equal lows, trendline bounces, and inefficient zones
The setup anticipates a sweep of upper liquidity before a drop into deeper value.
⸻
Execution Idea:
The setup favors a short entry after liquidity above is cleared and bearish confirmation prints on a lower timeframe. The goal is to enter after price rejects from high liquidity and begins targeting value and imbalance zones below.
⸻
Disclaimer: This is a technical idea shared for educational purposes only. It does not constitute financial advice. Always perform your own analysis and manage risk responsibly.
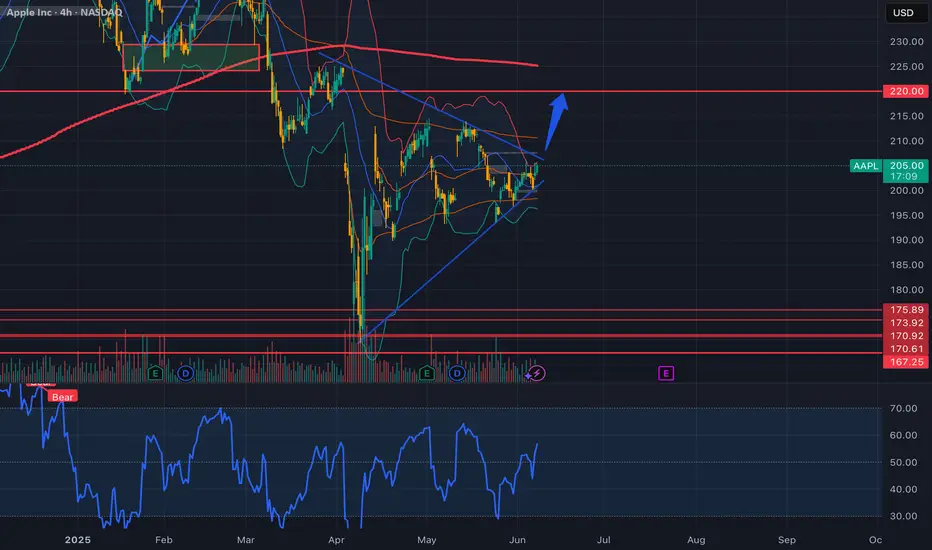
Could AAPL Breakout Soon...Symmetrical Triangle Setup...Pre-WWDCAAPL is forming a symmetrical triangle on the 4H chart, setting up for a potential breakout. This neutral pattern, with converging trendlines, signals consolidation before a big move. The upper trendline (resistance) is near $207, and the lower trendline (support) is around $200, with the current price at $205. RSI is neutral at 50, and volume is decreasing—classic signs of an imminent breakout.
Fundamental Catalyst: WWDC next week could be a game-changer, with potential AI updates (think “Apple Intelligence” enhancements). Positive news could fuel a bullish breakout, while a “sell the news” reaction might trigger a downside move.
Why I Think Gold Will Sell Today...Technical AnalysisHey Rich Friends,
Happy Tuesday! I wanted to share my Gold analysis and why I think it will sell. This is only a technical analysis so please check the news and cross-reference your own charts. Here is what I am looking at:
- There was a break of structure on H1 and previous support was retested as resistance.
- Bearish confluence on additional time frames: D, H4 and M15
- The stoch is facing down, both lines have crossed below 20, slow line (orange) is above the fast line (blue) which is a bearish confirmation for me.
Additional information:
- I would set sell stops to catch the momentum going down
- I will be setting sell stops and using previous highs as my SL and previous lows as my TPs.
- Focus on closing the gap from last week
Good luck if you decide to take this trade, let me know how it goes.
Peace and Profits,
Cha
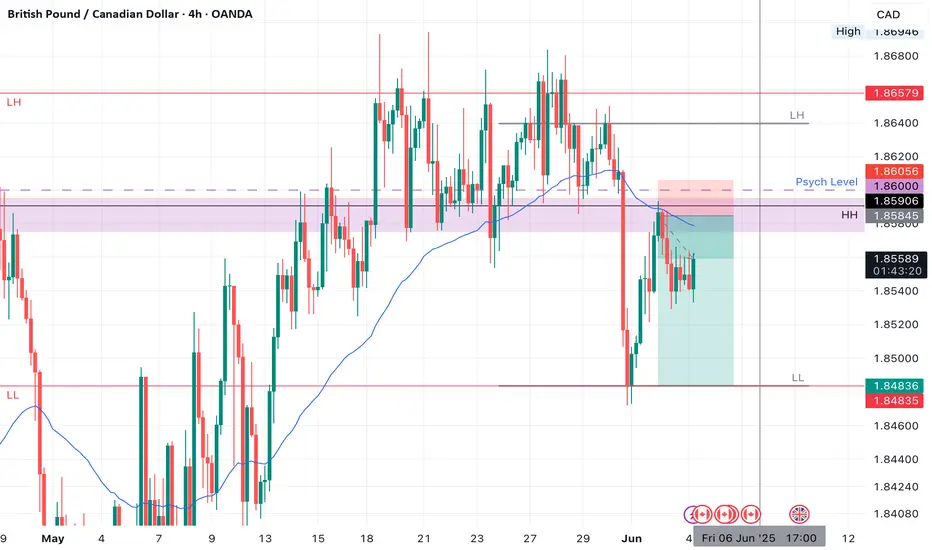
GBPCAD SHORT Market structure bearish on HTFs DW
Entry at both Weekly and Daily AOi
Weekly Rejection at AOi
Daily Rejection At AOi
Previous Structure point Daily
Around Psychological Level 1.86000
H4 EMA retest
H4 Candlestick rejection
Rejection from Previous structure
Levels 4.78
Entry 100%
REMEMBER : Trading is a Game Of Probability
: Manage Your Risk
: Be Patient
: Every Moment Is Unique
: Rinse, Wash, Repeat!
: Christ is King.
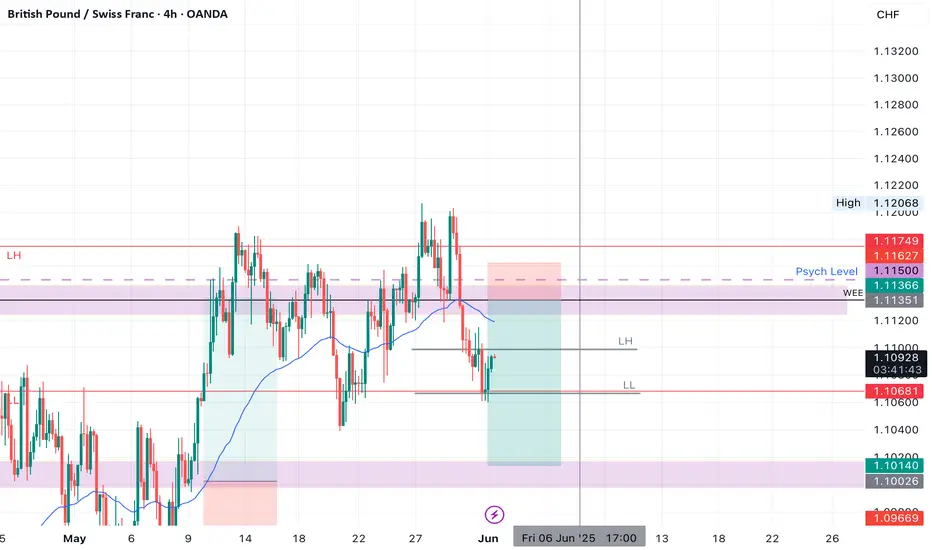
GBPCHF SHORT Market structure bearish DW
Entry At both Weekly and Daily AOi
Weekly Rejection at AOi
Previous Weekly Structure Point
Daily Rejection At AOi
Previous Structure point Daily
Around Psychological Level 1.11500
H4 EMA retest
H4 Candlestick rejection
Levels 4.39
Entry 100%
REMEMBER : Trading is a Game Of Probability
: Manage Your Risk
: Be Patient
: Every Moment Is Unique
: Rinse, Wash, Repeat!
: Christ is King.
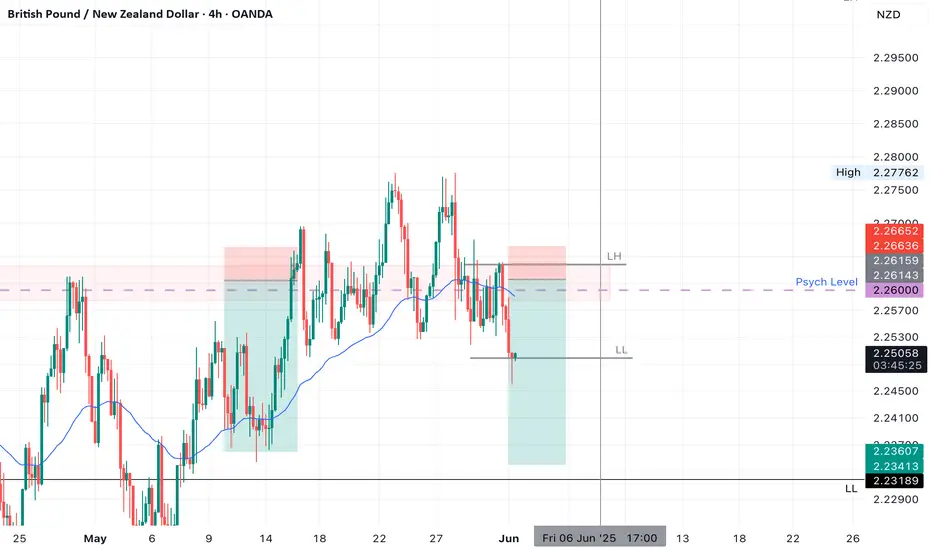
GBPNZD SHORTMarket structure bearish o HTFs 3
Entry at Daily AOi
Weekly Rejection At AOi
Weekly Previous Structure Point
Daily Rejection AOi
Daily Previous Structure Point
Around Psychologiical Level 2.26000
H4 EMA retest
H4 Candlestick rejection
Rejection from Previous structure
Levels 5.14
Entry 110%
REMEMBER : Trading is a Game Of Probability
: Manage Your Risk
: Be Patient
: Every Moment Is Unique
: Rinse, Wash, Repeat!
: Christ is King.
USDCHF SHORT Market structure bearish on HTFs 3
Entry at Daily AOi
Weekly Rejection at AOi
Daily Rejection at AOi
Previous Structure point Daily
Around Psychological Level 0.83000
H4 EMA retest
H4 Candlestick rejection
Rejection from Previous structure
Levels 3.99
Entry 100%
REMEMBER : Trading is a Game Of Probability
: Manage Your Risk
: Be Patient
: Every Moment Is Unique
: Rinse, Wash, Repeat!
: Christ is King.

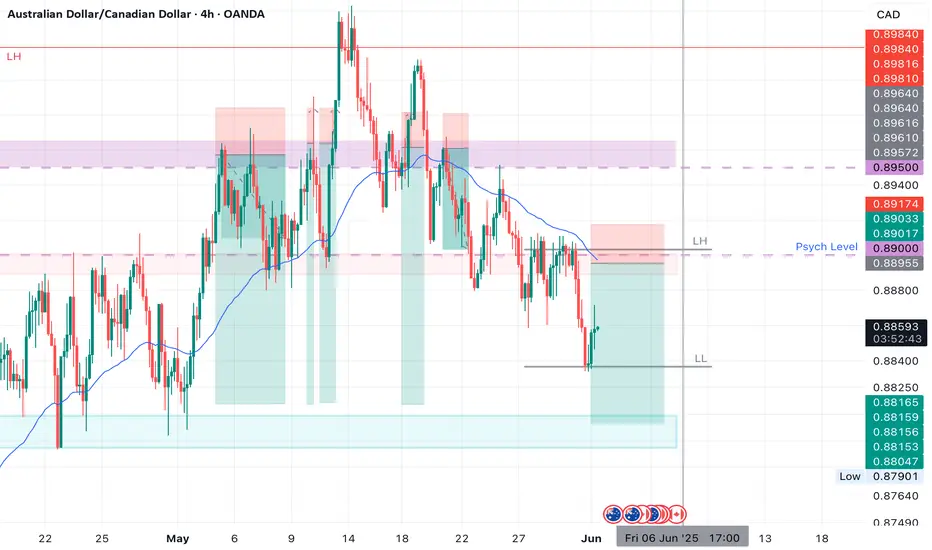
AUDCAD SHORTMarket structure bearish on HTFs 3
Entry at Daily AOi
Weekly Rejection at AOi
Daily Rejectioon at AOi
Daily EMA retest
Previous Structure point Daily
Around Psychological Level 0.89000
H4 EMA retest
H4 Candlestick rejection
Rejection from Previous structure
Levels 4.15
Entry 105%
REMEMBER : Trading is a Game Of Probability
: Manage Your Risk
: Be Patient
: Every Moment Is Unique
: Rinse, Wash, Repeat!
: Christ is King.
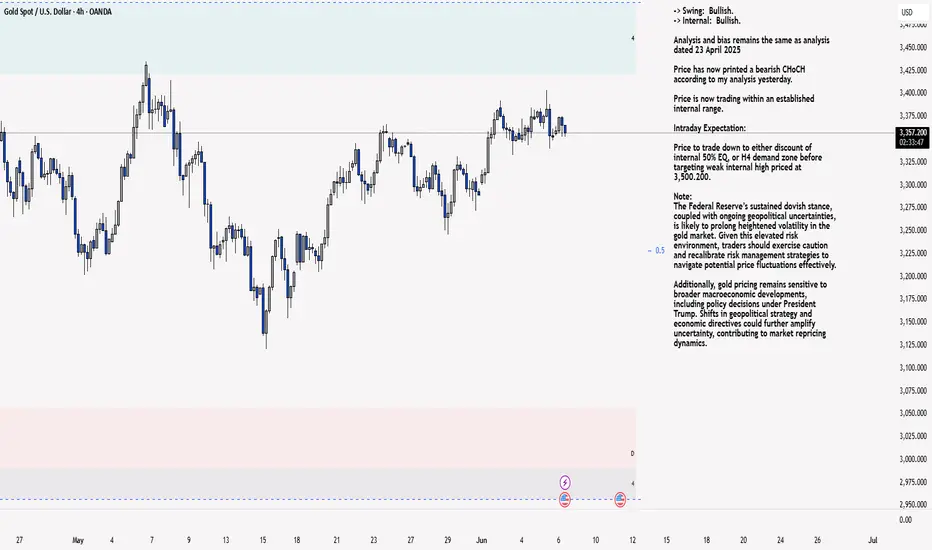
XAU/USD 06 June 2025 Intraday AnalysisH4 Analysis:
-> Swing: Bullish.
-> Internal: Bullish.
Analysis and bias remains the same as analysis dated 23 April 2025
Price has now printed a bearish CHoCH according to my analysis yesterday.
Price is now trading within an established internal range.
Intraday Expectation:
Price to trade down to either discount of internal 50% EQ, or H4 demand zone before targeting weak internal high priced at 3,500.200.
Note:
The Federal Reserve’s sustained dovish stance, coupled with ongoing geopolitical uncertainties, is likely to prolong heightened volatility in the gold market. Given this elevated risk environment, traders should exercise caution and recalibrate risk management strategies to navigate potential price fluctuations effectively.
Additionally, gold pricing remains sensitive to broader macroeconomic developments, including policy decisions under President Trump. Shifts in geopolitical strategy and economic directives could further amplify uncertainty, contributing to market repricing dynamics.
M4 Chart:
M15 Analysis:
-> Swing: Bullish.
-> Internal: Bearish.
Analysis and bias remains the same as analysis dated 22 May 2025.
In my analysis from 12 May 2025, I noted that price had yet to target the weak internal high, including on the H4 timeframe. This aligns with the ongoing corrective bearish pullback across higher timeframes, so a bearish internal Break of Structure (iBOS) was a likely outcome.
As anticipated, price targeted strong internal low, confirming a bearish iBOS.
Price has remained within the internal range for an extended period and has yet to target the weak internal low. A contributing factor could be the bullish nature of the H4 timeframe's internal range, which has reacted from a discounted level at 50% of the internal equilibrium (EQ).
Intraday Expectation:
Technically price to continue bullish, react at either premium of internal 50% EQ or M15 demand zone before targeting weak internal low priced at 3,120.765.
Alternative scenario:
Price can be seen to be reacting at discount of 50% EQ on H4 timeframe, therefore, it is a viable alternative that price could potentially print a bullish iBOS on M15 timeframe.
Note:
Gold remains highly volatile amid the Federal Reserve's continued dovish stance and persistent geopolitical uncertainties. Traders should implement robust risk management strategies and remain vigilant, as price swings may become more pronounced in this elevated volatility environment.
Additionally, President Trump’s recent tariff announcements are expected to further amplify market turbulence, potentially triggering sharp price fluctuations and whipsaws.
M15 Chart:
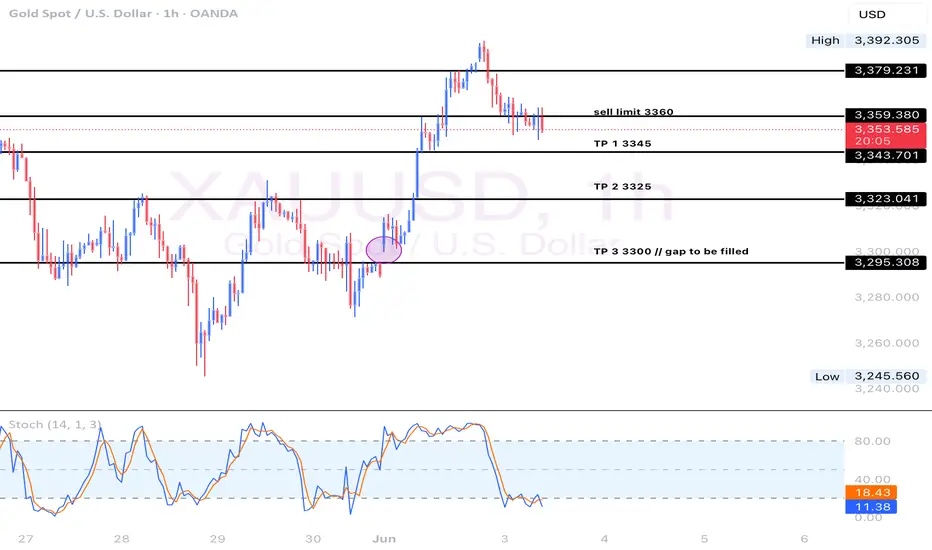
Short gold after reboundOvernight, gold broke through the 3400 mark due to the intensification of geopolitical risks, but plunged sharply due to the reduction of the risk of Sino-US trade decoupling. Because the news swept up and down, it brought certain difficulties to the transaction. Today, we will focus on the NFP market!
After overnight gold plunged to around 3340, it is currently maintaining a small rebound state. Relatively speaking, the rebound potential is weak, and with the sharp plunge of gold in the short term, the market bulls' confidence has been hit. At present, without major good news, it is difficult to make breakthrough progress based on technical support alone. The upper side faces short-term resistance of 3365-3375 area resistance. If gold cannot break through this area in the short term, gold will be weak!
Trading strategy:
Consider shorting gold in the 3370-3380 area, TP: 3355-3345

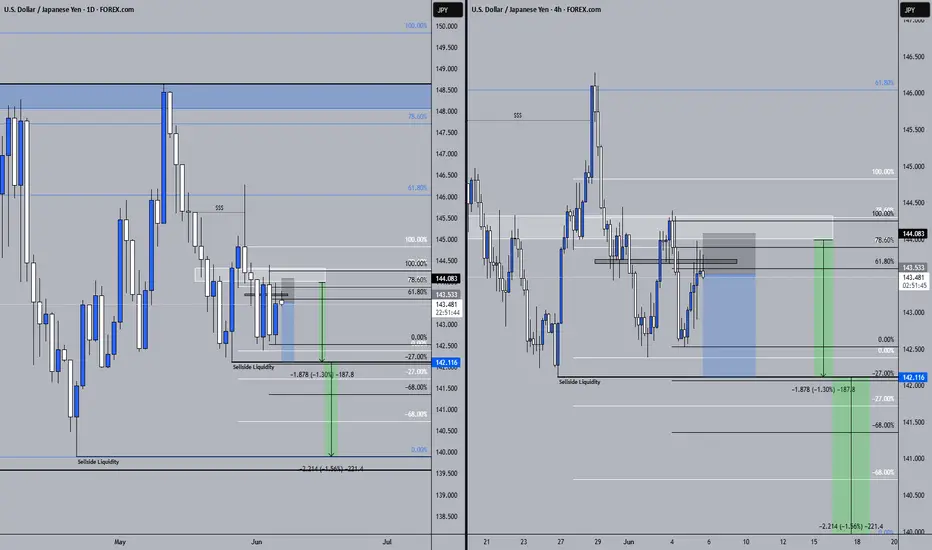
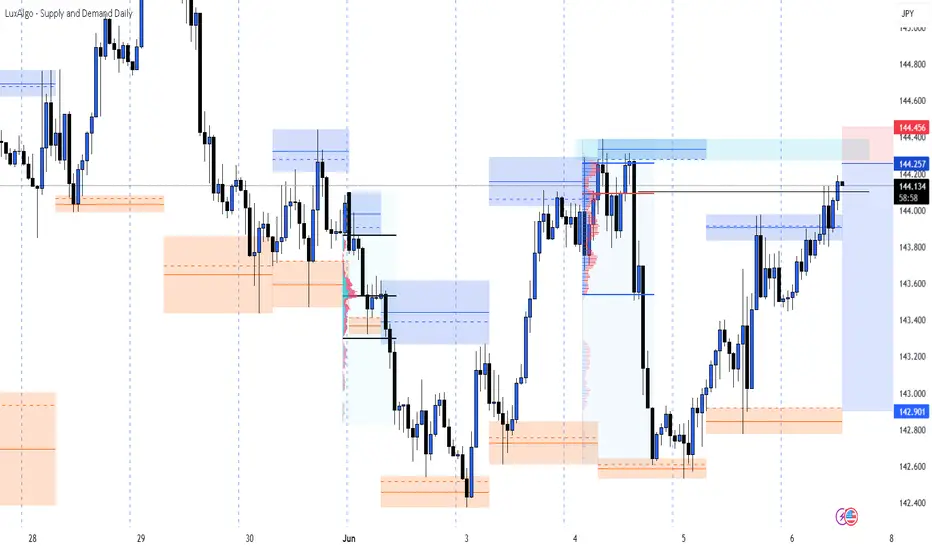
USDJPY – Supply Zone Rejection Incoming?June 6, 2025 | Short-Term Bias: Bearish
USDJPY is currently trading around 144.16, testing a key supply zone between 144.25 – 144.45. This area has historically acted as a strong resistance, and we’re now seeing signs of exhaustion after a solid bullish run from the 142.90 demand zone.
🔍 Technical Highlights:
Price is inside a high-probability supply zone, with clear historical rejection at this level.
A strong bearish risk-reward setup is in play, with the target at 142.90 and a stop above 144.456.
The volume profile shows high activity around 144.00–144.25, hinting at possible consolidation or distribution.
Previous structure confirms this level has served as a seller’s stronghold.
📉 Bias:
Leaning bearish as long as price remains below 144.456.
A break and close above that level would invalidate this setup and shift the bias to bullish, targeting the 145.00+ area.
📌 Trade Idea (Not Financial Advice):
Entry: Current level (~144.16)
SL: Above 144.456
TP: 142.90
Let’s see if sellers step in again here, or if bulls are ready to break through. ⚔️
Drop your thoughts below! 👇
USDCHF Primed for Monster Move to 0.92? Here's Why!In today’s video, I break down a potentially strong bullish opportunity on USDCHF and why, with the right entry signal, we might see a solid push up towards 0.88 and eventually 0.92 in the weeks and months ahead.
First off, let's check the monthly chart. In April, price finally broke and closed below the major 0.84 support, a level that held firm since 2011. Below, I've marked the massive buy zone created around the 2011 lows—interestingly, depending on your broker, you’ll notice this zone was tested during the dramatic Swiss franc unpegging event back in 2015 as well.
But here's why I don’t think we’re headed down to retest that monthly zone anytime soon. Zooming into the weekly charts, we clearly see a key weekly buy zone. This was actually the origin point for the massive move up from the 2011 lows to 0.95. This exact weekly level is already proving its significance again, given the strong buying reaction we saw here in May.
Now, zooming further into the daily charts, we had a nice bounce at that weekly buy zone, pushing price back up to retest the previous support at 0.84. If the market truly wanted lower prices, we would've seen a sharp sell-off from there. Instead, price has slowly been grinding lower, forming a clear W double-bottom pattern—a powerful reversal signal.
This all points to higher prices ahead, especially considering USDCHF currently offers one of the most attractive swap carry opportunities due to the interest rate differentials and the SNB’s hints about possibly returning to negative rates to weaken the franc.
Here's my game plan:
Wait patiently for the next bullish daily candle with a clear close above 0.83.
My first target will be the 0.88 area (previous strong resistance and weekly sell zone).
The longer-term target will be around the 0.92 resistance zone.
My stop loss will be placed comfortably below 0.80. Should we spike lower to that level, I'll remain alert for another high-probability bullish entry signal.
Let me know your thoughts below!

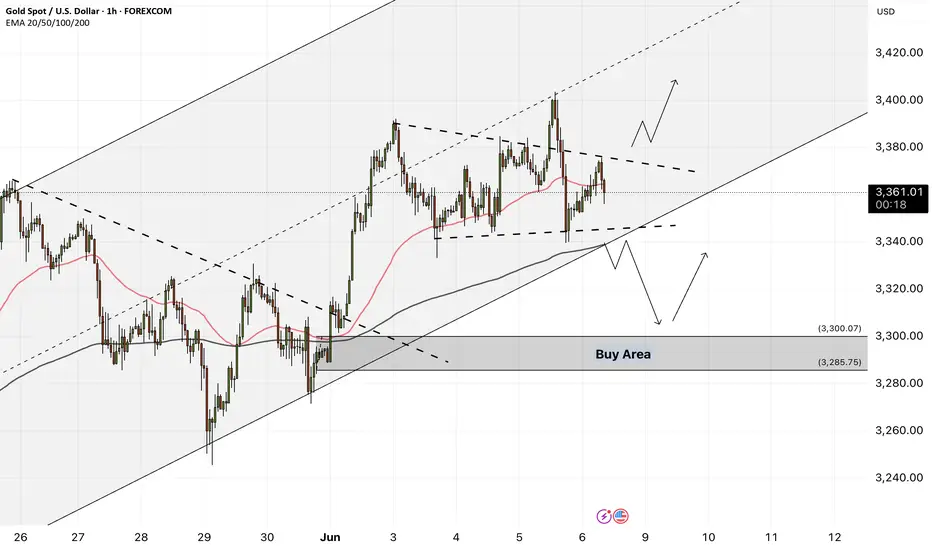
XAUUSD - Gold awaits NFP!Gold is trading in its ascending channel on the hourly timeframe, between EMA200 and EMA50. We should wait for a valid breakout of the pattern we identified yesterday, from which we had a Fick break above. We can enter the trade after it breaks in the formed pattern, and on the other hand, if gold corrects towards the demand zone, we can buy it in the short term with a reward at an appropriate risk.
Gold came under downward pressure amid renewed optimism regarding U.S.-China trade talks. Although prices surged to a four-week high earlier in the day due to strong demand from Asian and European buyers, a wave of selling during U.S. trading hours reversed part of that gain.
This shift in momentum coincided with rising U.S. Treasury yields and a boost in market sentiment following a phone call between the presidents of China and the United States. While no official statement has been issued yet, the decision to initiate a new round of high-level negotiations was seen as a positive signal. In recent months, gold has become a key indicator for gauging geopolitical and trade-related risks, having previously surged to an all-time high of $3,500 after the “Freedom Day” tariffs were implemented.
Despite ongoing concerns over Ukraine, Iran, and the growing U.S. fiscal deficit—which provide fundamental support for gold—the metal’s inability to break above the key resistance level of $3,437 has cast doubt on the short-term bullish outlook.
Meanwhile, Goldman Sachs has projected that the upcoming U.S. nonfarm payrolls (NFP) report for May will show a 125,000 increase in jobs. The unemployment rate is expected to remain steady at 4.2%, and monthly wage growth is estimated at 0.3%. The bank also anticipates a 10,000-job decline in the public sector, largely due to tariff-related policies and reduced hiring. Overall, Goldman Sachs expects the report to be balanced and free of surprises, which should encourage the Federal Reserve to maintain its current policy stance.
Although gold has managed to stabilize above $3,000 per ounce in recent weeks, many investors remain focused on reclaiming the historic peak reached in April. According to one research firm, it’s only a matter of time before that level is tested and broken again.
In the annual “Gold Focus 2025” report published Thursday by the UK-based firm Metals Focus, analysts stated that gold retains strong momentum for further gains in 2026. They forecast that the average gold price this year could reach an unprecedented $3,210, with new highs likely in the second half of the year.
In an interview with Kitco News, Metals Focus CEO Philip Newman said it is difficult to envision a scenario that would derail the current bull market. While this perspective isn’t included in their formal forecasts, he believes the rally could extend into 2026.
Newman added, “If you look at what’s happening across the global economy, all the ingredients for a structural bull market are present.” He highlighted that one of gold’s unique traits is how quickly investors adapt to new price levels, often converting previous resistance levels into future support. A year ago, he admitted he would have expected $3,000 to trigger widespread profit-taking.
However, despite ongoing economic uncertainty and geopolitical instability, investors have not been discouraged by current price levels. Newman emphasized that what makes 2025 distinct is that new investors are just now entering the market. While gold has been rallying since 2023, much of the demand until recently came from central banks and Asian markets—particularly China.
Newman noted that only in Q4 of last year and early this year did retail investors begin to decisively adopt a bullish stance. “We’ve seen strong growth in investment demand this year,” he said, “but there’s still a large amount of capital that hasn’t entered the market yet. This is not a bubble—this is a well-supported, structurally sound market.”
He concluded by identifying changing perceptions of the U.S. dollar as a major driver behind increased gold investment.While the dollar remains a traditional safe haven, ongoing trade tensions and unsustainable government debt levels have eroded market confidence, prompting investors to seek safety and diversification through gold.
Gold Update – The Reversal Is Still in PlayYesterday’s price action confirmed what we’ve been discussing in recent updates: the upside is vulnerable, and the real move could be lower.
Gold did push toward the 3400 zone, as expected — but that test was short-lived. Sellers stepped in aggressively, and price dropped back toward the 3350 support zone, closing the day with a bearish engulfing candle on the daily chart.
Will we have a new leg down?
That’s the big question now. While bulls are hoping for continuation, the current rebound is weak and seems to be shaping into a bear flag.
Why I Expect More Downside:
- Strong rejection from 3400 key level
- Daily chart printed a bearish engulfing
- Rebound structure looks corrective, not impulsive
Trading Plan:
I continue to look for selling opportunities on spikes, especially near resistance levels like 3375–3385.
If the 3340-3350 zone falls, I expect down acceleration and a drop even to 3200 zone.
Disclosure: I am part of TradeNation's Influencer program and receive a monthly fee for using their TradingView charts in my analyses and educational articles.

EURUSD failing to close above a key daily highThis is a quick analysis but we are at a key bearish range that may give a double top on the weekly/daily. If this Daily mother candle abides by Candle Range Theory mechanics, we will see it's low taken out.
We'll see 🎯

USDJPY 05/06/2025Weekly:
-Bearish W pattern.
-Previous week high iqudity sweep.
Daily:
-H&S pattern.
-Natural W pattern.
4H:
-H&S pattern.