XAUUSD | Bullish - Deep Liquidity Grab + OB MitigationPair: XAUUSD
Bias: Bullish
HTF Overview (4H):
Structure remains bullish, with continuation expected toward prior 4H highs. Last week’s strong bullish intent signaled Smart Money’s directional commitment. Price reached deeper to seek liquidity beneath major sell-side lows, setting the stage.
LTF Confirmation (30M):
Price cleanly mitigated a 30M order block resting just under the swept liquidity. This reinforces the bias, and I’ll now be watching for LTF confirmations once the market opens.
Entry Zone: Within or just above the 30M OB
Targets: 5M and 30M internal highs. Trailing targets will depend on how price delivers.
Mindset Note: Patience is key here. I’m waiting for clean confirmation before executing — no rush. The story is written. I just need the trigger.
Multiple Time Frame Analysis
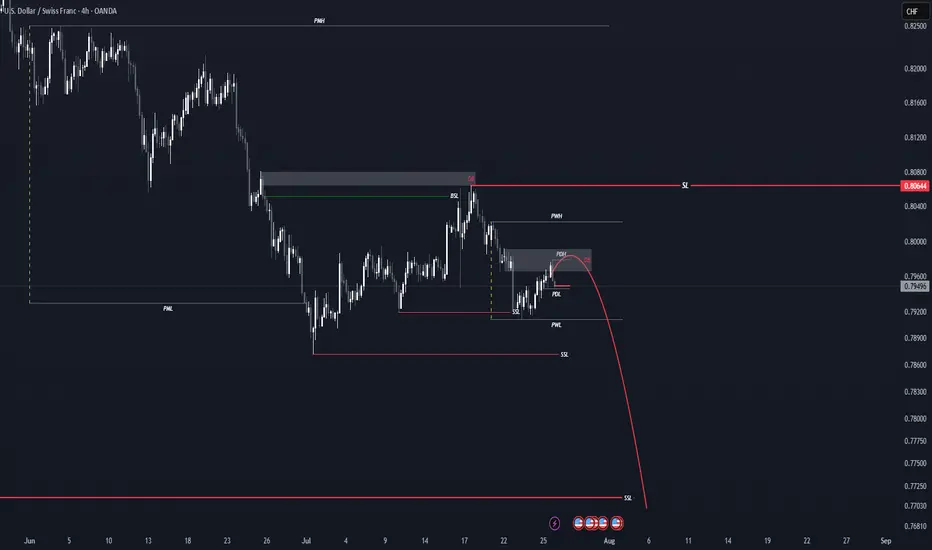
USDCHFHello Trader
I expect the price to start falling from these areas 🩸
The stop of this scenario is also visible in the image above❌
I hope you make the most of it...
XAUUSDHello Trader ❤
I expect the price to start growing from these two areas🚀
The stop of this scenario is also visible in the image above❌
I hope you make the most of it...

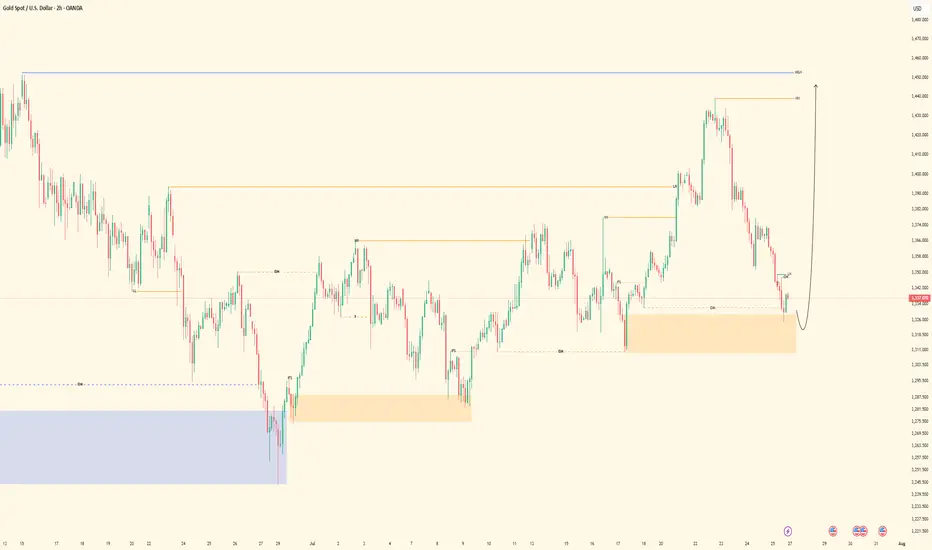
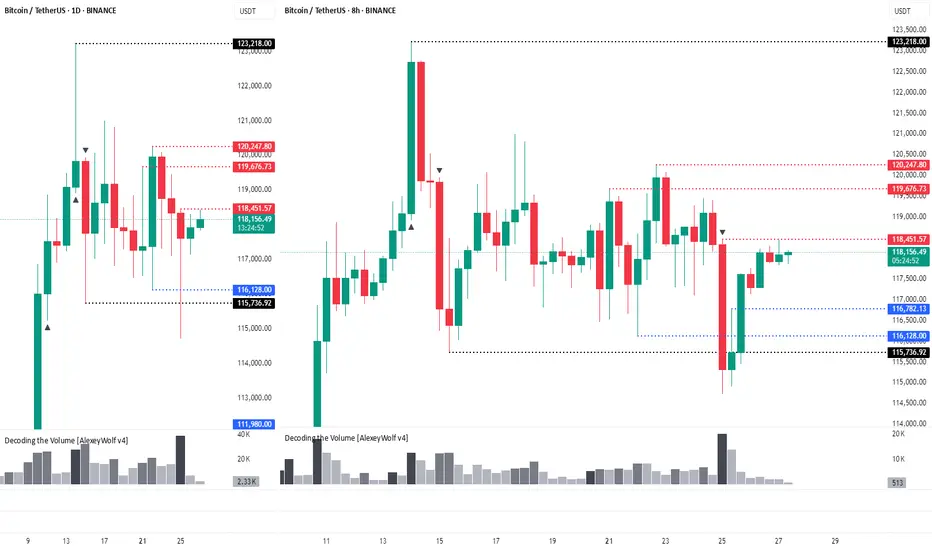
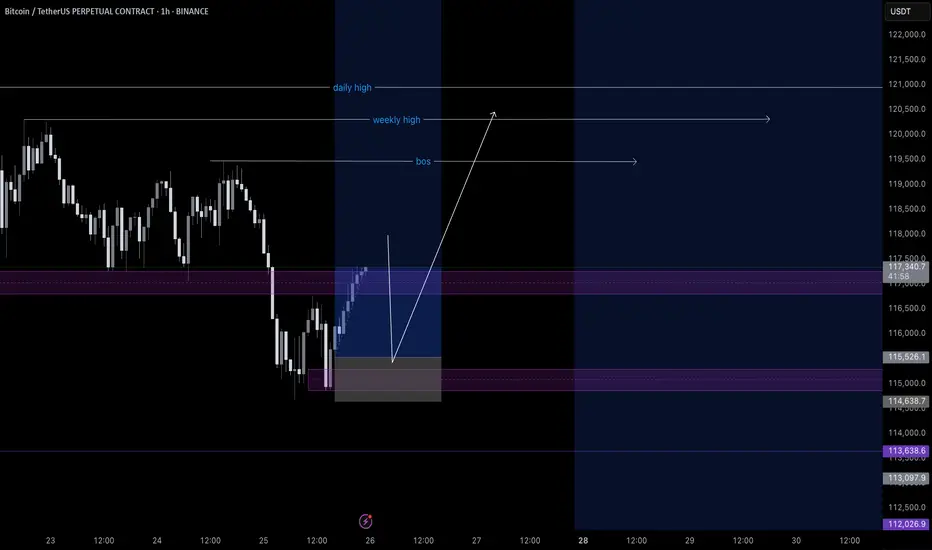
The move is up to the buyersHi traders and investors!
The price has already played out the upper boundary of the scenario, rising above 120,500. Then it also reached the lower boundary by dropping below 115,222.
Now we are at an interest moment: will the price continue to move upward or not?
This situation is clearly visible on the 8-hour timeframe.
On the 8H chart, we see a sideways range, similar to the 1D timeframe. The lower boundary is 115,736 and the upper boundary is 123,218. The active initiative is currently with the buyers, and their target is 120,998 и 123,218.
There is a notable bar attacking the lower boundary (115,736) with very high volume. The high of that bar is 118,451. We’re watching to see whether buyers absorb this bar — that will determine how the next move plays out.
There are three key levels where buyers may step in: 116,782, 116,128, and 115,736. If the price drops to any of these, we can look for a long setup.
Above, we also have three resistance levels from the sellers: 118,451, 119,676, and 120,247. We’ll be watching how sellers react if the price tests these zones.
This analysis is based on the Initiative Analysis concept (IA).
Wishing you profitable trades!
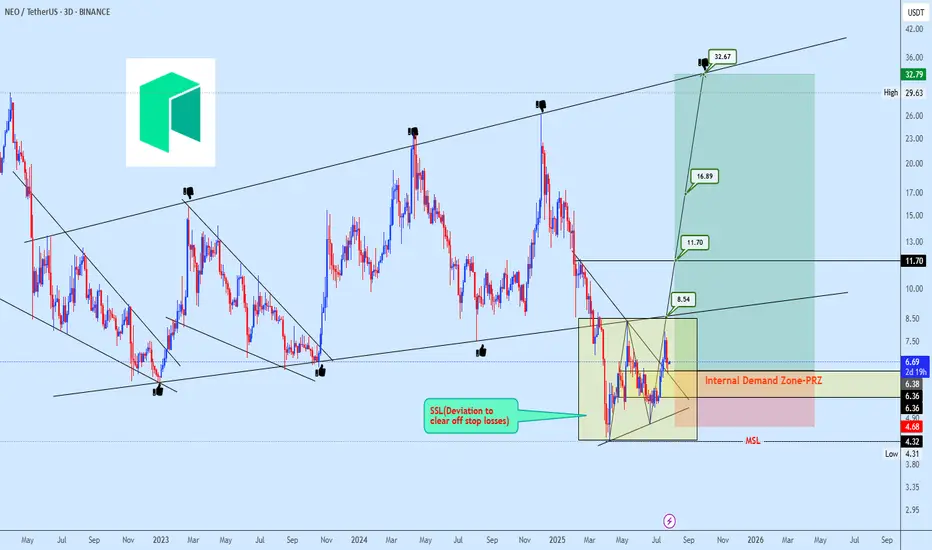
NEOUSDT Accumulation in Progress After Strategic Stop-Loss SweepNEOUSDT broke below its micro ascending broadening structure in what appears to be a strategic deviation to trigger stop-loss liquidity. Following this flush, price action has settled into a brief consolidation phase, often indicative of underlying bearish weakness losing momentum.
Our focus shifts to the internal demand zone, which is currently acting as a strong platform for accumulation. With price reclaiming the prior range low and reacting positively from the projected reversal zone (PRZ), we are positioning for a potential multi-leg bullish expansion.
Targets are projected at 8.54 → 11.70 → 16.89, with a final extension towards 32.67, aligning with the macro channel resistance.
Risk is clearly defined below 4.68, which serves as invalidation of this bullish view.
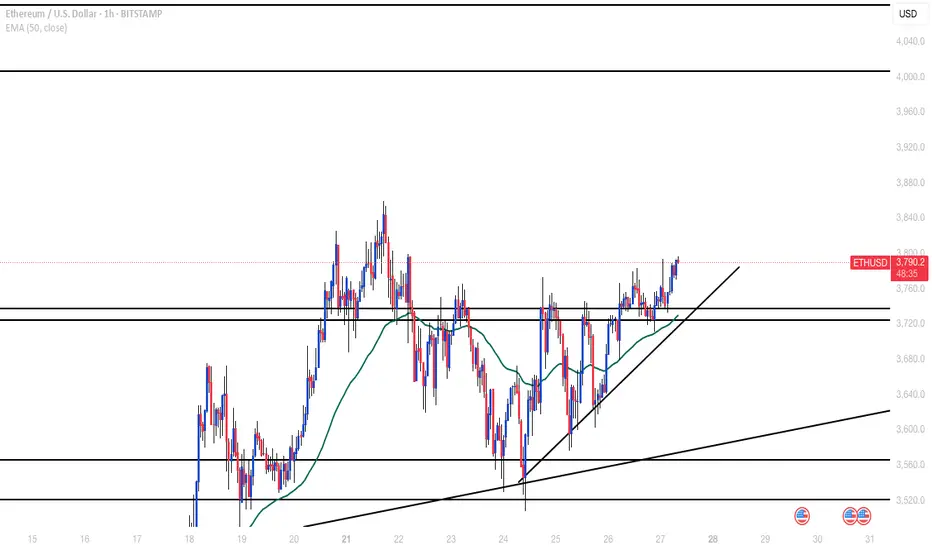
ETHUSDBroke above H4 resistance and retested multiple times. Also broke above minor H1 resistance with a retest. Looking at 4,000 as main target
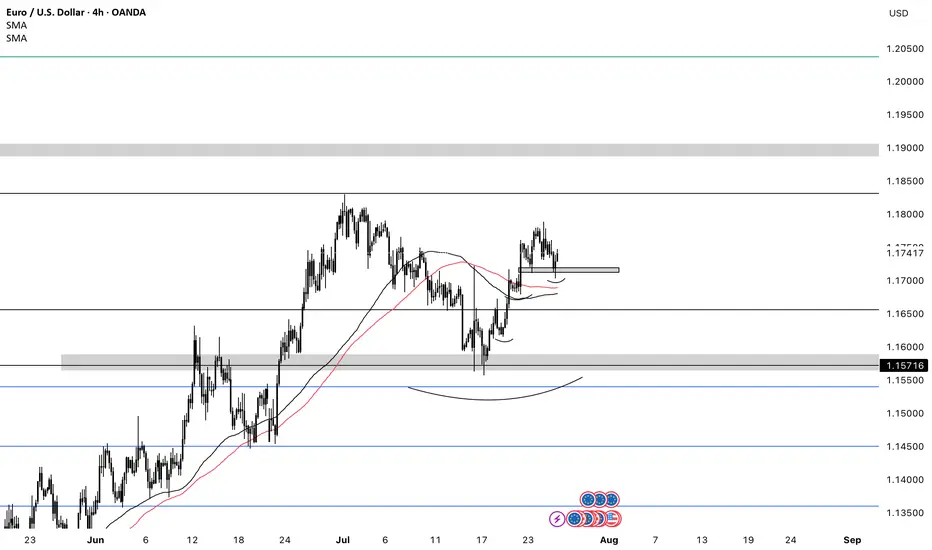
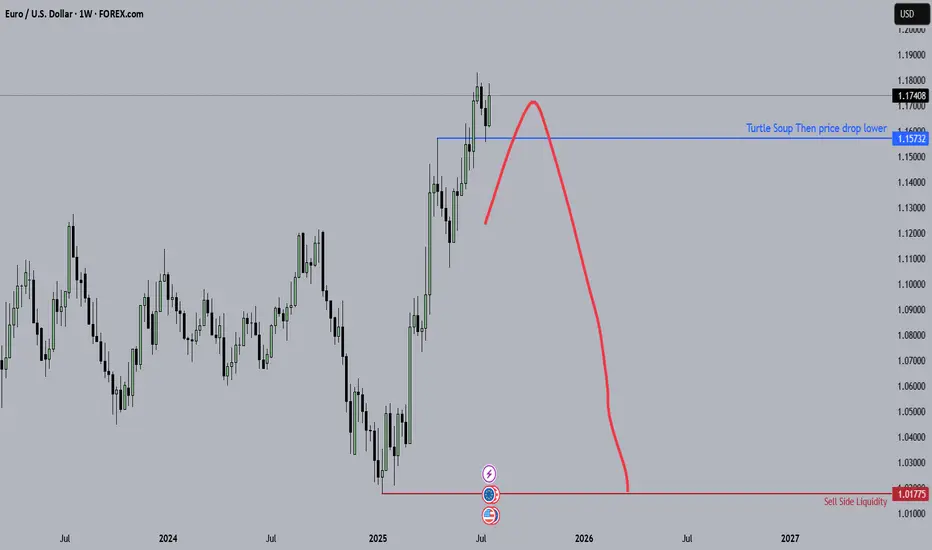
EURUSD BUYSEU is bullish. It has been consistently making HHs & HLs. I’d look for price to push towards the daily resistance @ 1.83000 then I’d look for price to push towards 1.19000.
XAUUSD Gold closed bearish and I’ll continue looking for sells. I’d prefer gold to retrace and create a LH and continue selling towards 3310. Last time price was around 3310, it had a massive bullish run so that’ll be the only area I’d sell to unless price breaks that support.

Vicusdt buy opportunityVICUSDT broke out of a falling wedge but encountered strong resistance at the supply zone, leading to a pullback for a potential retest of the wedge structure. The plan is to re-accumulate within the highlighted zone and monitor price action as it progresses toward the outlined targets on the chart.

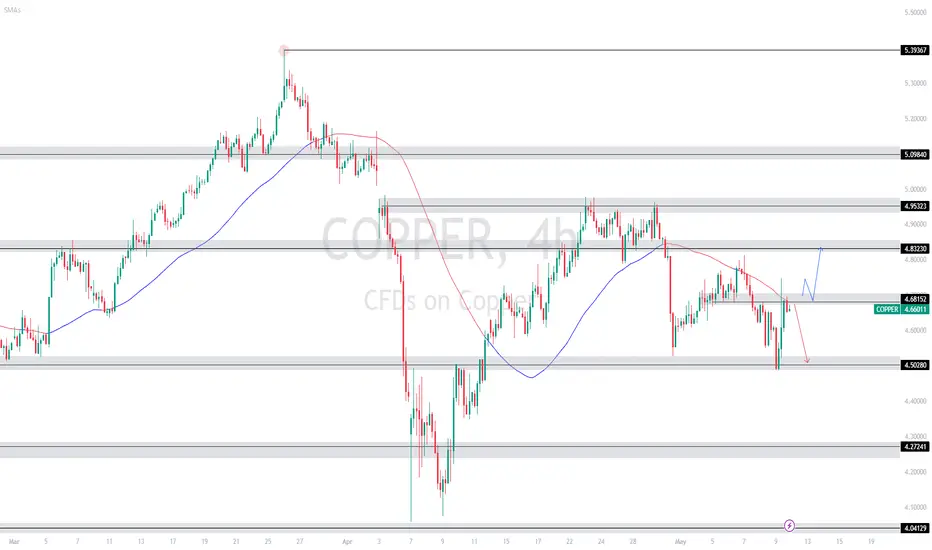
Copper Eyeing Key Reversal Point – Will It Break Above 4.68152 ?Copper is currently hovering near the 4.68152 🔼 resistance after rebounding from the 4.50280 🔽 support. Price is reacting to the 50-period SMA, which is slightly above current levels and may act as a dynamic resistance. The overall structure remains mixed with recent lower highs, but bulls have stepped in at key support.
Support at: 4.50280 🔽, 4.27241 🔽, 4.04129 🔽
Resistance at: 4.68152 🔼, 4.83230 🔼, 4.95323 🔼
Bias:
🔼 Bullish: A breakout and retest above 4.68152, and ideally a clean move above the 50 SMA, could signal bullish continuation toward 4.83230 and 4.95323.
🔽 Bearish: A strong rejection at 4.68152 or a drop below 4.50280 could send price back toward 4.27241.
📛 Disclaimer: This is not financial advice. Trade at your own risk.
Long trade tradingview.sweetlogin.com
🟢 Buyside Trade
Pair: LINKUSD
Date: Saturday, 5th July 2025
Time: 8:00 PM
Session: Tokyo Session PM
Time Frame: 4Hr TF Entry
🔢 Trade Metrics
Entry Price: 13.161
Take Profit (TP): 25.814 (+96.14%)
Stop Loss (SL): 12.984 (−1.34%)
Risk-Reward Ratio: 70.32: 1
📈 Chart Analysis
Structure: Price broke the previous consolidation zone and retested key support levels near the 13.16 area before launching upward.
Indicators:
200 WMA (Yellow) & 50 EMA (Blue) both support continuation.
Break of market structure confirmed prior resistance as new support.

GBP/USD Retraces to Demand — Buy Setup FormingHello traders!
Price has been in a strong bullish trend throughout the week.
After forming a demand zone around 1.35300 and retracing back to it, we are looking to take a buy position in this area.
Manage your risk and trade safe!

Fiber (EU) This is my Analysis for the Eurousd, Fiber has been in down trend for years now and comparing the US Central bank interest rates with the European Central bank it shows that the Dollar is Stronger compared to the Euro, Blending the Fundamentals with Technical Analysis.
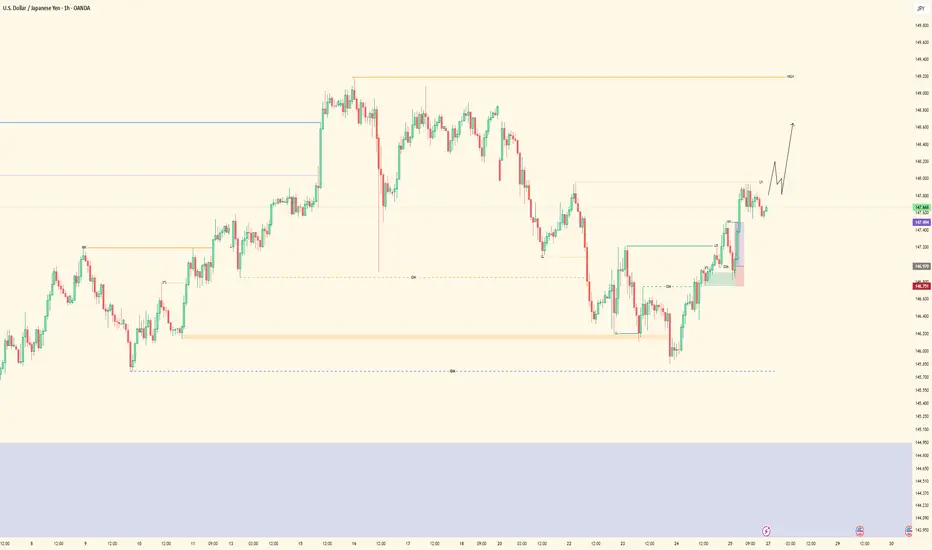
UJ| Bullish Structure Ride | 5M Demand ExecutionPair: USDJPY
Bias: Bullish
HTF Overview: 4H structure stayed bullish with clean intent. Internal liquidity resting above prior highs, and price is still pushing through the 30M range toward those 4H targets.
LTF Confirmation: 30M showed a clean continuation range with a lower high (LH) inside structure — price never broke character. I tracked it into 5M where the OB was sitting patiently.
Entry Zone: Tapped into the 5M OB with a short-term sweep right before — no need for extra confirmation. The move had structure, inducement, and momentum on its side.
Target: TP hit at the 5M highs, but overall I’m watching for the 30M LH to go first, then ultimately expecting price to run the 4H internal highs this upcoming week.
Mindset Note: When the story is clear on the HTF, all you need is one clean LTF entry to ride with conviction. I’m letting the higher timeframe breathe and staying ready.
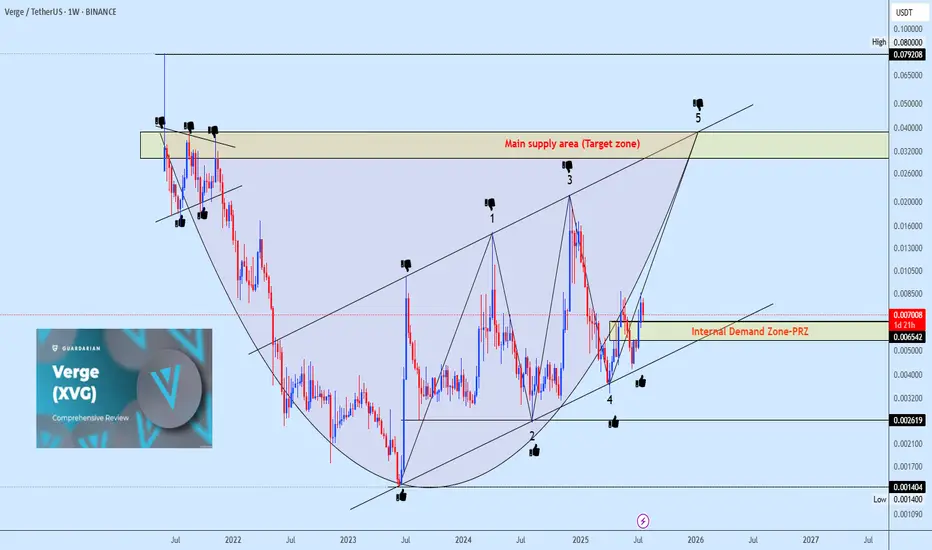
Xvgusdt buy opportunityXVGUSDT is showing a strong move within a rising channel following a well-defined rounding bottom reversal. The focus is on the neckline of the rounding bottom, where wave 5 of the channel is expected to complete before a possible correction. This correction could evolve into either a cup and handle or an inverse head and shoulders (iH&S) pattern, time will reveal the structure. Watch the highlighted demand zone for potential accumulation opportunities.
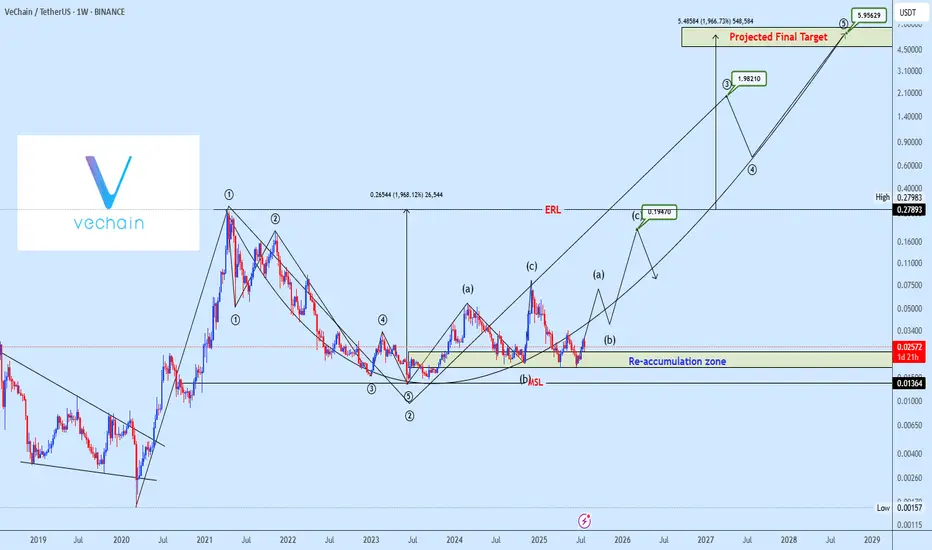
Vetusdt buy opportunityVetusdt completed wave 2 correction and price preparing for the big wave 3 move with the potential leading structure, the plan is to accumulate fromt the provided zone and hold for the setup targets.
Bitcoin AnalysisWe have an order block in 1Hour TF, price can retest this before bullish continuation. If it breaks below bearish momentum continues.
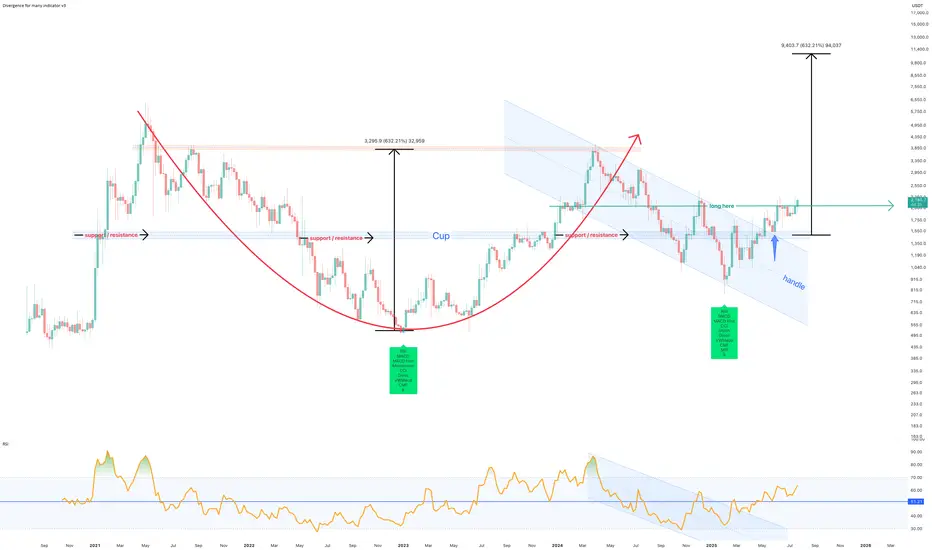
July 2025 - Marker DAO (MKR) to $10k before EthereumThe above forecast is predicted to strike before October 2025. Ethereum will never reach $10k in its lifetime, which a study for another post.
A 75% correction is shown on the above 6 day chart that began in March 2024. A number of compelling reasons now exist for a strong upward move.
Support and resistance
Look left, price action confirms support on past resistance, which follows a strong positive divergence. The resistance has held since May 2022. Incidentally on the topic of divergences, on the same time frame with the same settings, Ethereum prints a double negative divergence over the same period. (see below).
The trend
Both Price action and RSI resistances have broken out. RSI confirms a trend reversal on past resistance.
A Cup and Handle pattern confirmation
The forecast is derived from the Cup and Handle pattern topping out at around $10.5k, however it is not suggested to wait until this area before profits are taken.
Is it possible price action continues to print lower lows? Sure.
Is it probable? No.
Ww
Ethereum 6 day double negative divergencies
EURUSD - Next Buy Zone? This one has some nice potential
We will see how it plays out if we get tagged in
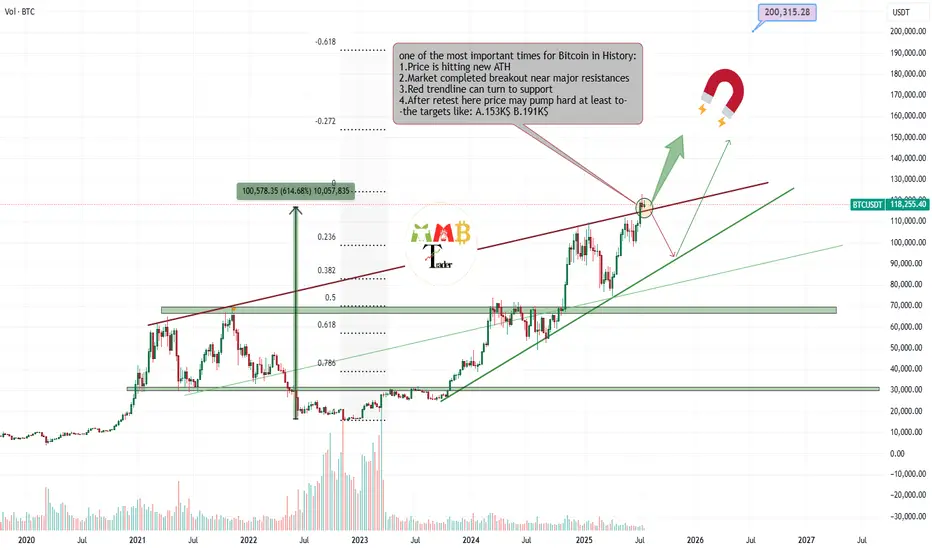
Bitcoin is retesting Critical zone for targeting almost 200K$Most traders around world now don't know what to do with their own trades or spot holdings, because some are in profit and how doubt of more pump and are still holding and some others miss this massive pump and think it can rest and fall now and it is not a good time to enter long.
And many other questions and thoughts At this time is simply check the chart and do these simple steps which are some mentioned and some not due to huge content.
Delete all of my previous drawings and start new Charting the price and see new trendlines or supports and resistances formed.
Then technically check the volume and breakouts and ... once again and here for Bitcoin i still find out chart looks extremely bullish to me and at this orange zone which is price is getting a little slow some important things may happen.
30% is expecting price fall below red trendline again and see short-term fall.
70% is expecting price complete retest of breakout here or pump more ASAP and then hitting targes like 150K$ and more for $BTCUSDT.
DISCLAIMER: ((trade based on your own decision))
<<press like👍 if you enjoy💚
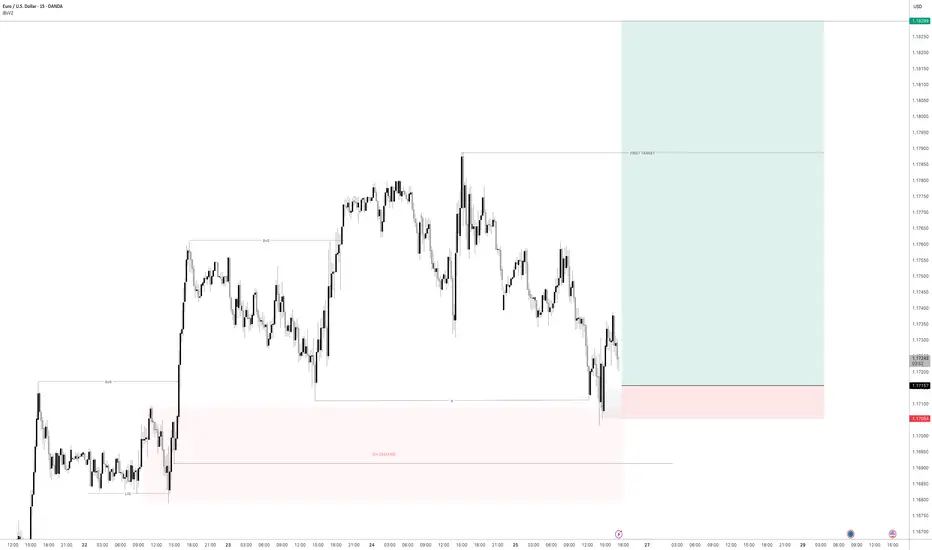
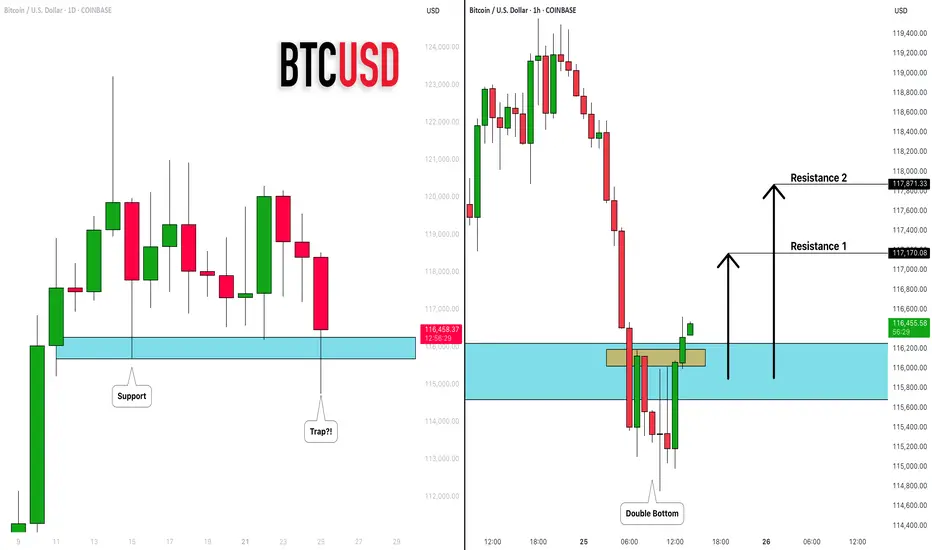
BITCOIN (BTCUSD): Recovery Starts
Bitcoin is going to rise from a key daily support.
After a liquidity grab, the market shows a clear strength,
forming a double bottom on an hourly time frame.
I expect a bullish movement at least to 117100
❤️Please, support my work with like, thank you!❤️
I am part of Trade Nation's Influencer program and receive a monthly fee for using their TradingView charts in my analysis.
SHORT ON EUR/NZDEZ Has given a nice CHOC to the downside with plenty of sell side liquidity to be collected.
I will be selling EZ to the next level of demand looking to catch 300-500 pips

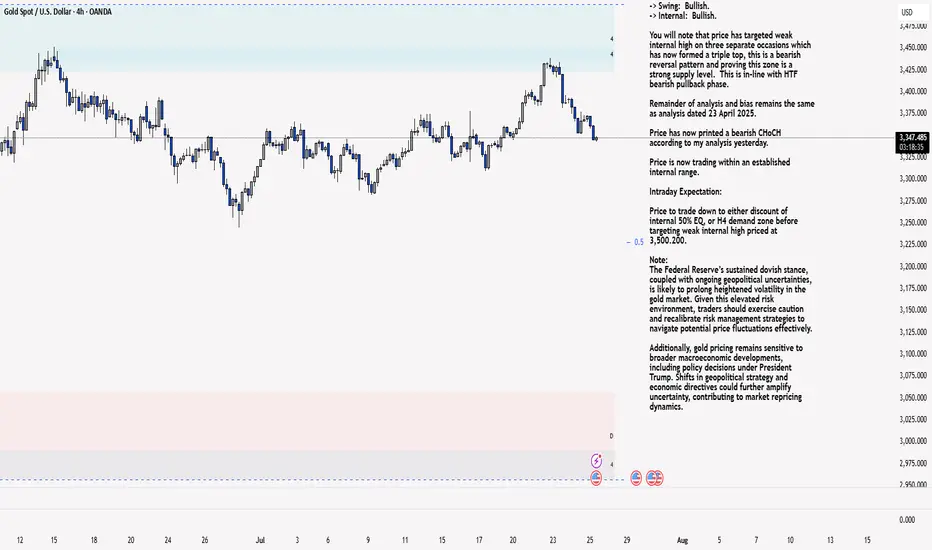
XAU/USD 25 July 2025 Intraday AnalysisH4 Analysis:
-> Swing: Bullish.
-> Internal: Bullish.
You will note that price has targeted weak internal high on three separate occasions which has now formed a triple top, this is a bearish reversal pattern and proving this zone is a strong supply level. This is in-line with HTF bearish pullback phase.
Remainder of analysis and bias remains the same as analysis dated 23 April 2025.
Price has now printed a bearish CHoCH according to my analysis yesterday.
Price is now trading within an established internal range.
Intraday Expectation:
Price to trade down to either discount of internal 50% EQ, or H4 demand zone before targeting weak internal high priced at 3,500.200.
Note:
The Federal Reserve’s sustained dovish stance, coupled with ongoing geopolitical uncertainties, is likely to prolong heightened volatility in the gold market. Given this elevated risk environment, traders should exercise caution and recalibrate risk management strategies to navigate potential price fluctuations effectively.
Additionally, gold pricing remains sensitive to broader macroeconomic developments, including policy decisions under President Trump. Shifts in geopolitical strategy and economic directives could further amplify uncertainty, contributing to market repricing dynamics.
H4 Chart:
M15 Analysis:
-> Swing: Bullish.
-> Internal: Bullish.
H4 Timeframe - Price has failed to target weak internal high, therefore, it would not be unrealistic if price printed a bearish iBOS.
The remainder of my analysis shall remain the same as analysis dated 13 June 2025, apart from target price.
As per my analysis dated 22 May 2025 whereby I mentioned price can be seen to be reacting at discount of 50% EQ on H4 timeframe, therefore, it is a viable alternative that price could potentially print a bullish iBOS on M15 timeframe despite internal structure being bearish.
Price has printed a bullish iBOS followed by a bearish CHoCH, which indicates, but does not confirm, bearish pullback phase initiation. I will however continue to monitor, with respect to depth of pullback.
Intraday Expectation:
Price to continue bearish, react at either M15 supply zone, or discount of 50% internal EQ before targeting weak internal high priced at 3,451.375.
Note:
Gold remains highly volatile amid the Federal Reserve's continued dovish stance, persistent and escalating geopolitical uncertainties. Traders should implement robust risk management strategies and remain vigilant, as price swings may become more pronounced in this elevated volatility environment.
Additionally, President Trump’s recent tariff announcements are expected to further amplify market turbulence, potentially triggering sharp price fluctuations and whipsaws.
M15 Chart: