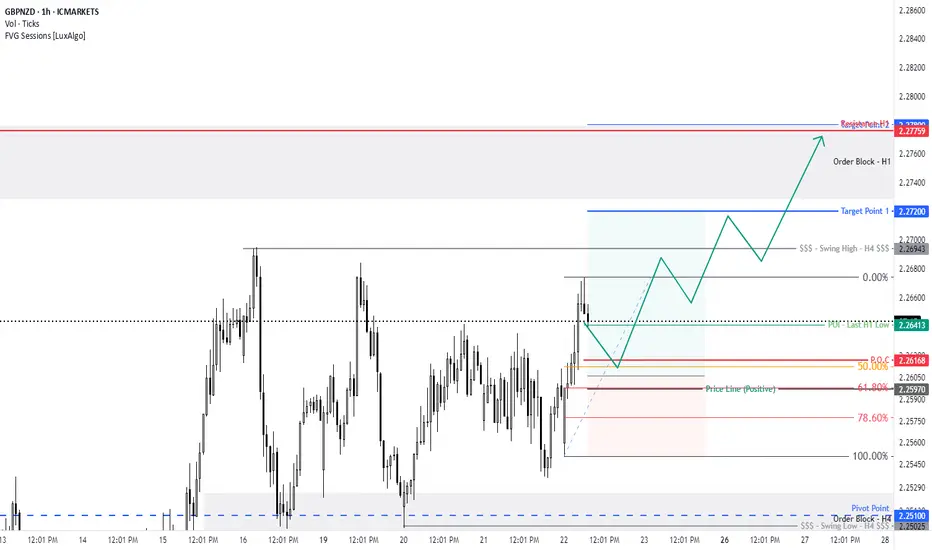
GBP/NZD For Bullishwait for pull-back near by entry point and then go long
general trend is up trend
NZD under pressure
have fun :)
Multiple Time Frame Analysis
Long trade
1Hr TF overview
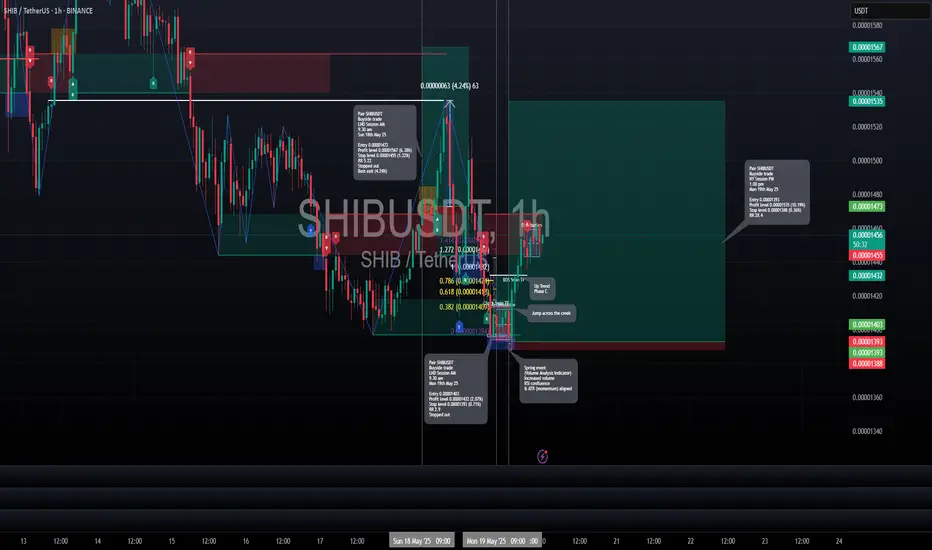
🟩 Buyside Trade Log
📈 Pair: SHIB/USDT
🏷️ Type: Intraday | NY Session PM
🧠 Setup: Wyckoff Accumulation (Breakout Phase)
📅 Date: Monday, 19th May 2025
🕐 Time: 1:00 PM (1.55 pm)
🔹 Entry Price: 0.00001393
🔹 Profit Target: 0.00001535 (+10.19%)
🔹 Stop Loss: 0.00001388 (-0.36%)
🔹 Risk-Reward Ratio: 28.4
🔍 Reasoning:
The trade was structured around the Wyckoff Accumulation narrative, where the price completed its consolidation phase and transitioned into a breakout from the resistance ceiling. This move followed clear signs of absorption, a spring phase, and confirmation via higher lows within a trading range. Volume confirmed the breakout leg during the NY PM session.
5min TF entry
Observe the failed first attempt (which provided the consolidation range) and added further conviction to the buy-side entry 2nd attempt.
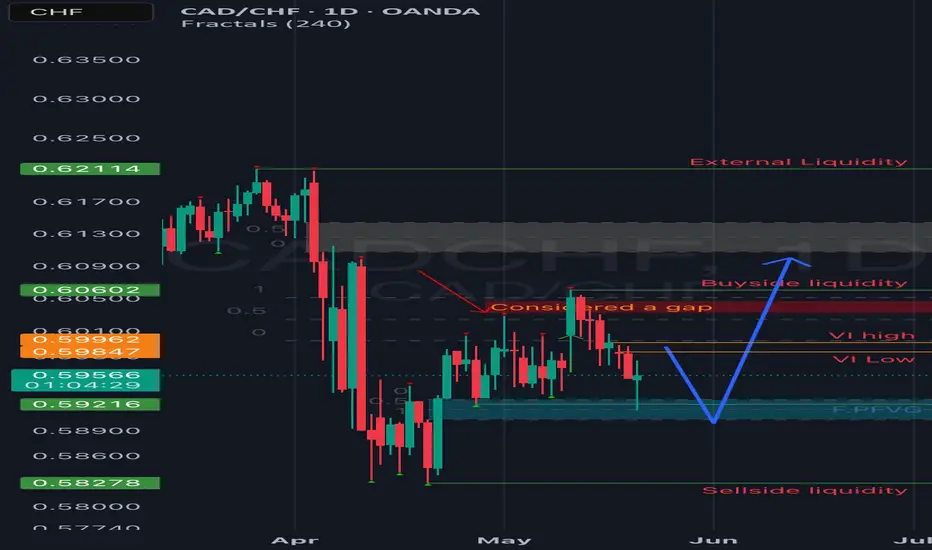
CADCHF update!!Good day traders, I’m back with yet another update on CadChf and if I can remember well I mentioned the first time I posted this setup that this one is special because it offer us opportunities to learn and get to see if what ICT(Micheal.J) says about his concepts true or not, for me they work!!
The first setup I posted here and the second one will both be tagged in the description below just to support my ideology and how I came about this setup. On the first setup there was a large wick that i stated should be considered as a Gap and we saw price close above it to balance that gap. And you move one TF higher on your weekly there you’ll see that price has failed multiple times to balance that weekly VI, back on our daily TF we can see that price did not fully trade through that 1st.PFVG and we want to see it come back to fully trade through the gap.
Overall bias is BUYSIDE LIQUIDITY!!
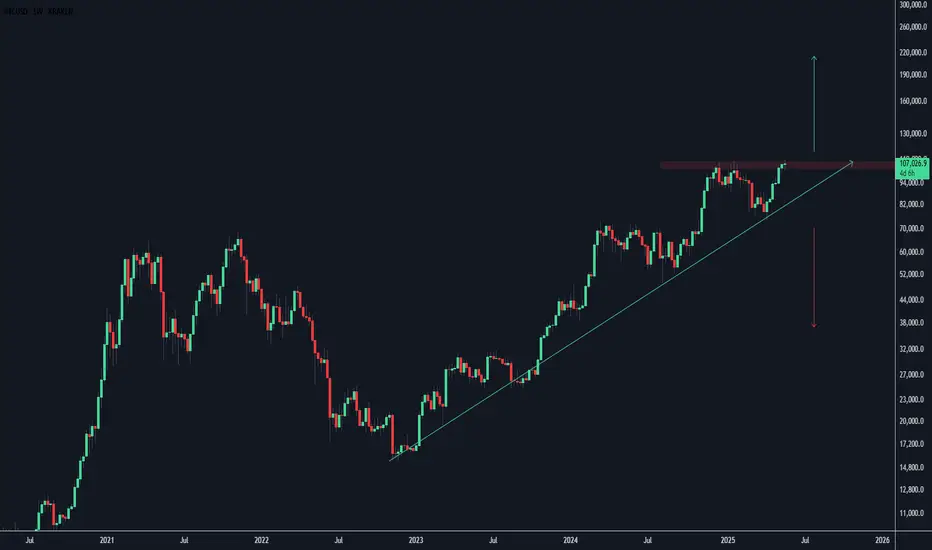
BTC Weekly ChartRejected this resistance on the lower timeframes after making new ATHs.
Just waiting to see if it will continue this trend or break and go back below $100K.
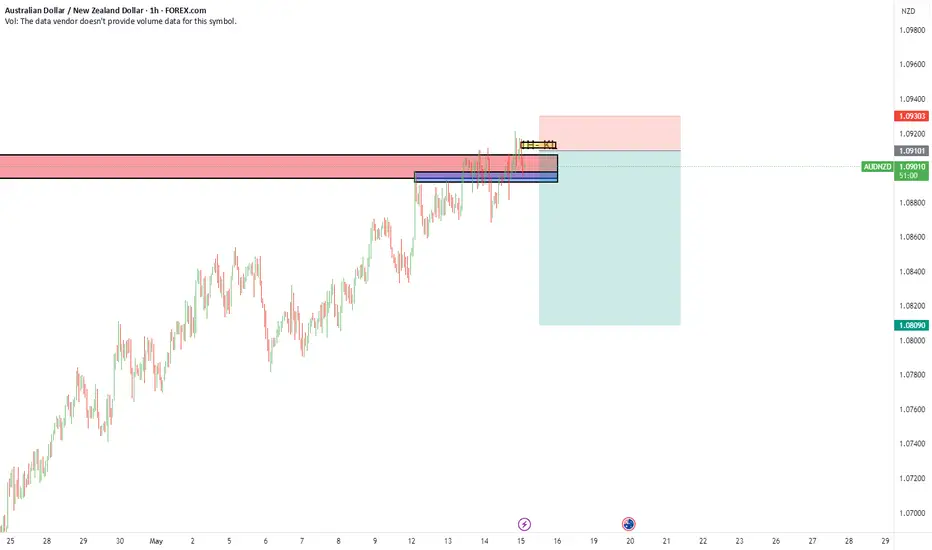
Sell limit AUDNZDAnalysis still same for this pair we might get in early in the previous trade
all breaks above 1H TF recent high are fake break outs
we will try to sell the pair from the top point at 1.0910 with 20 pip stoploss
sell limit @ 1.0910
stoploss @ 1,0930
Target @ 1.0810
1 : 5 RR
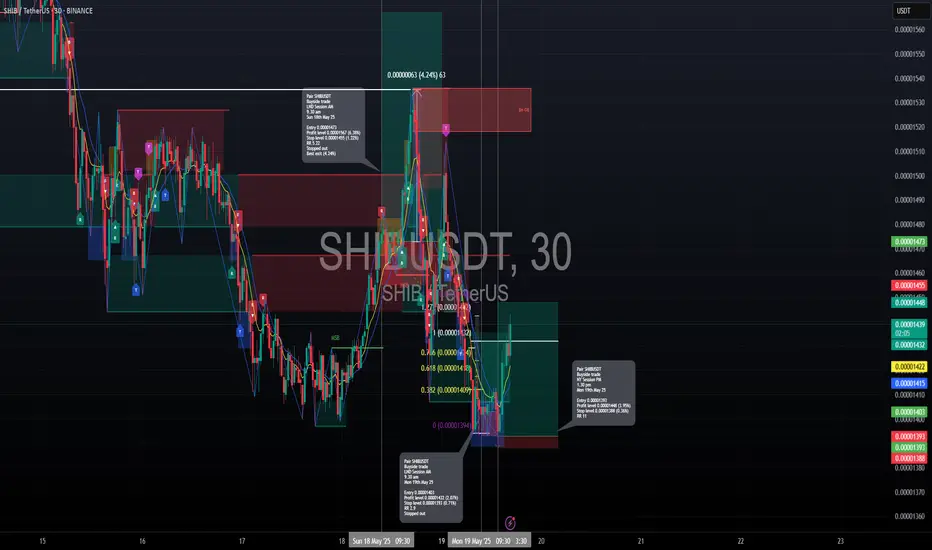
Long trade🟩 Buyside Trade Log
📈 Pair: SHIB/USDT
🏷️ Type: Intraday | NY Session PM
🧠 Setup: Breakout
📅 Date: Monday, 19th May 2025
🕜 Time: 1:30 PM
🔹 Entry Price: 0.00001393
🔹 Profit Target: 0.00001448 (+3.95%)
🔹 Stop Loss: 0.00001388 (-0.36%)
🔹 Risk-Reward Ratio: 11.00
🔍 Reasoning:
The trade was triggered during the NY PM session following a breakout from local consolidation. Price action demonstrated strong bullish intent with a clean sweep of near-term resistance and no immediate supply overhead
30min TF
AUDCHF: Bearish Reversal Confirmed! 🇦🇺🇨🇭
AUDCHF may return to a global bearish trend.
A breakout of a support line of a rising parallel channel,
bearish CHoCH and a lower high on a daily indicate a changing market sentiment.
I think that the pair may drop lower soon.
Goal - 0.53
❤️Please, support my work with like, thank you!❤️
I am part of Trade Nation's Influencer program and receive a monthly fee for using their TradingView charts in my analysis.

Why I think EURUSD will sell this week...Technical AnalysisHey Rich Friends,
Happy Monday! I wanted to share my analysis on EURUSD and why I think it will sell. This is only a technical analysis so please check the news and cross-reference your own charts. Here is what I am looking at:
- Momentum has picked up for the sellers after the swing high was hit. This means a downtrend has started and is picking up.
- The market structure was broken on the downside on M15 and H1. There was a retest and previous support became resistance.
- The stoch is facing down, both lines have crossed below 80, slow line (orange) is above the fast line (blue) which is a bearish confirmation for me.
Additional information:
- I will wait for both lines of the stoch to cross below 50 to confirm the down trend.
- I will use previous highs as my SL and previous lows as my TPs.
Good luck if you decide to take this trade, let me know how it goes.
Peace and Profits,
Cha

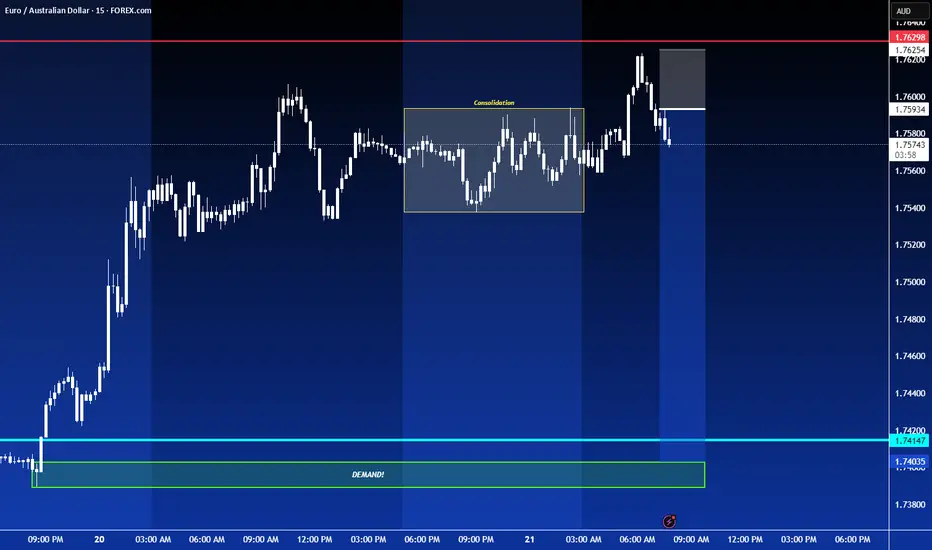
SHORT ON EUR/AUDEUR/AUD has swept the Asian high and am looking to short it to take out the Asian low as balance out a huge FVG from the higher timeframe.
GBPCHF: Bullish Move From Trend Line 🇬🇧🇨🇭
I think that there is a high probability that GBPCHF
will pull back from a rising trend line on a daily.
As a confirmation, I spotted a bullish engulfing candle
after its test on an hourly time frame.
Goal - 1.1085
❤️Please, support my work with like, thank you!❤️
I am part of Trade Nation's Influencer program and receive a monthly fee for using their TradingView charts in my analysis.

GBPNZD Sell Swing Trade Set upHello Traders,
Another sell swing trade set up.
With this market producing some very large candles, this does have the potential to be a big win and the start of a big move
Best of luck on the charts :)

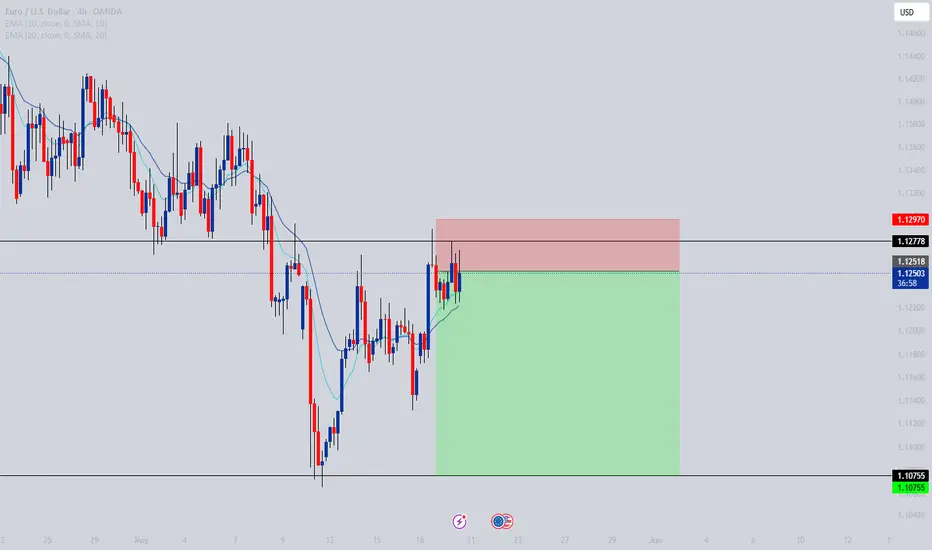
EURUSD Sell Swing TradeHello Traders,
I stumbled across the Euro Dollar chart on the daily time-frame only to notice we are coming near a level of some significance at 1.12778
I noticed some historic bearish rejections on this key level and whilst looking at market structure, I was interested in another bearish move from this market.
I zoomed into the 4hr time frame to see what candlestick patterns I could identify to build to some value into the trade idea.
Not only did I do this, but I found a large wick rejection candle form below my structure level which I have used for entry.
I anticipate that we will see this pair take price down to previous structure lows and break lower depending on how quickly the market reacts
Entry @ 1.12518
Stop Loss @ 1.12970 - 45.2pips
Take Profit @ 1.10751 - 176.3 pips
Best of luck if you take this !!!
EUR/GBP For Bullish as pull-backwait for pull-back near by entry point and then go long
general trend is down trend
current phase is pull-back
have fun :)
EUR/USD Sell – May 21 Bias: Bearish (4H / 1H / 15m all down) and in Orderblocks.
POI: 15m OB
Trigger: 1m BOS from 15m OB (means market reacted → valid)
Entry: On the last untouched 1m OB left behind after the BOS
TP: Final TP at gap (18RR), partial TP at 1:3RR
Risk: Asia high not swept → could spike into SL before dumping
⚠️ Key Notes
Asia High = liquidity → price might hunt it first, then reverse
If you entered before the sweep, SL spike risk is real
If you wait after the sweep and get a clean 1m OB + BOS again = higher probability entry

EUR/JPY For Bullish as pull-backwait for pull-back near by entry point and then go long
general trend is down trend
current phase is pull-back
have fun :)
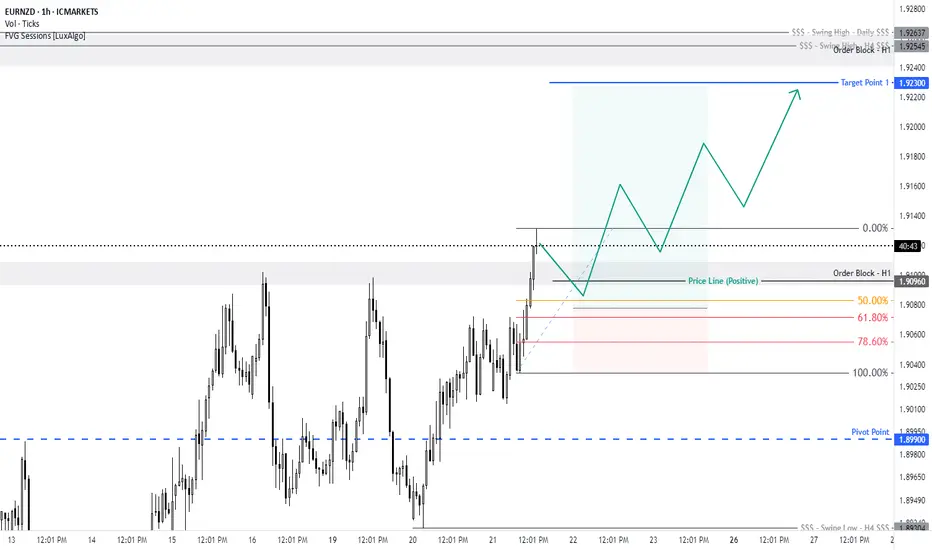
EUR/NZD For Bullishgo long now
or
wait for pull-back near by entry point and then go long
general trend is down trend
current phase is pull-back
have fun :)
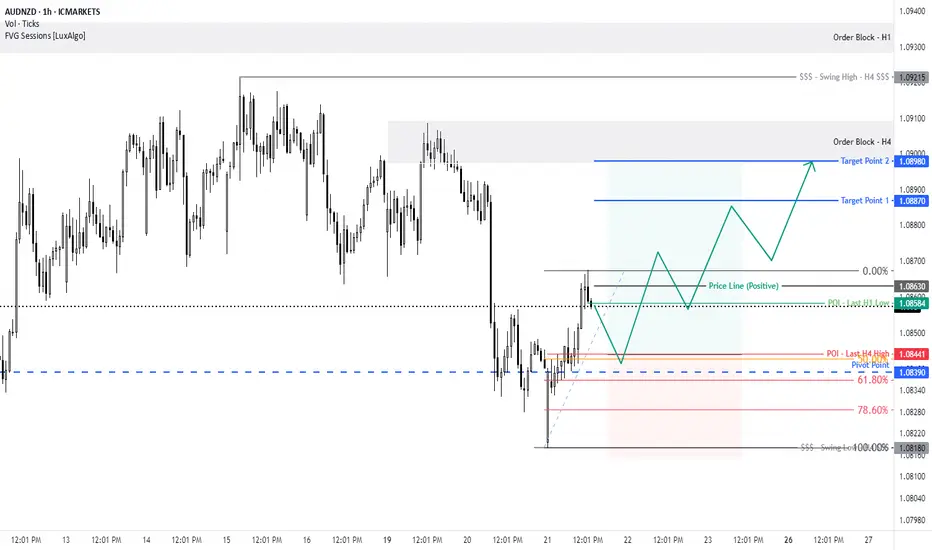
AUD/NZD For Bullishwait for pull-back near by entry point and then go long
general trend is up trend
have fun :)
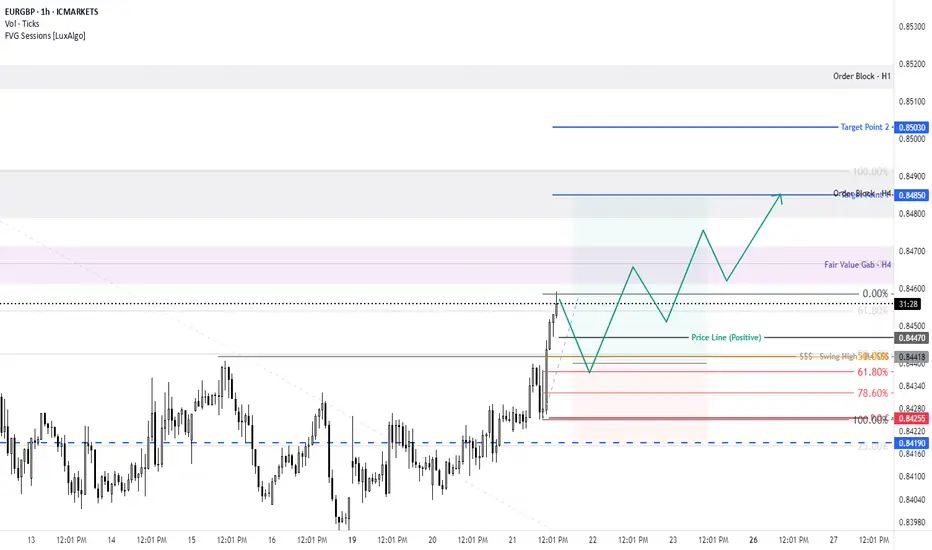
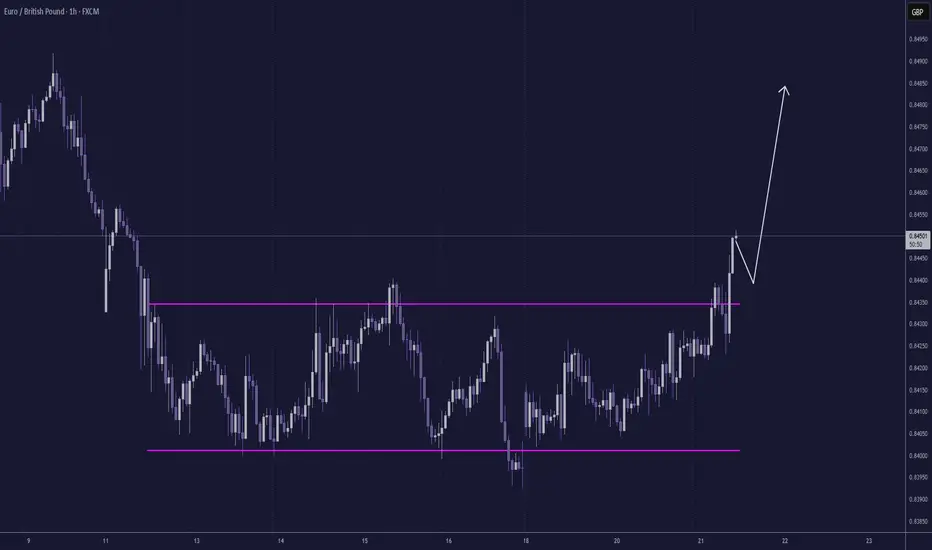
EURGBP directional bias: BuyFollowing today's Pound CPI news, we have broken out of a big range that began last week. Expecting a small pullback followed by a strong buy.
Looking to buy ESES is sustaining bullish structure on 1H and 4H. Currently in discount zone. ES swept liquidity below daily lows, filled 4H FVG and starting to reverse. 1:3 RR long trade potential.

BNBUSDT preparing for major upside RallyBNBUSDT has broken out of a major bullish structure and has since transitioned into a well defined ascending wedge, suggesting the development of an extended Wave 3 within an impulsive Elliott sequence.
Price is currently progressing toward the projected Wave 3 target around $935, a level that also coincides with a significant historical supply zone. Once reached, this area may trigger a sharp corrective pullback, likely forming Wave 4.
Should this correction hold above key structural support, the final impulsive leg toward the $1,613 region is expected to complete the ongoing trading cycle for BNB.
We invite you to share your perspective in the comments and revisit our earlier BNB analysis linked below for broader context on this setup.

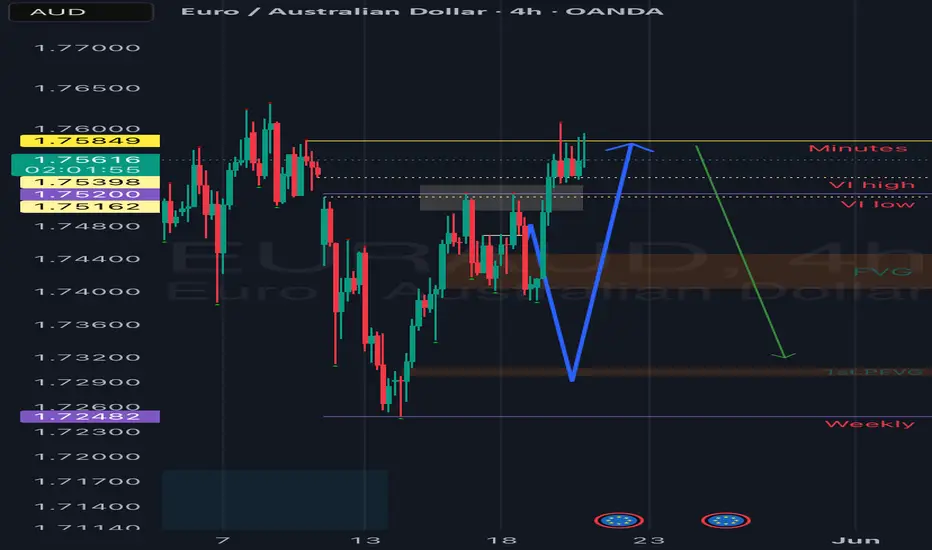
EurAud update.Good day traders, I’m back with yet another update on EurAud. In the description I will tag my previous setup on EurAud to show you where we are in price and I left the drawings as they were to help you understand price more.
On Monday price opened with that same bullish flow and pushed till the low of the volume imbalance as expected but as we can see that FVG was able to hold price above. From the original setup what price did yesterday was expected Thursday or Friday the latest, so since price did not go for that 1st.PFVG on Monday and Tuesday, we can now expect price to go for that level.
If we take a closer look at that leg higher from that FVG, we have a balanced price range that we can expect price not to respect.
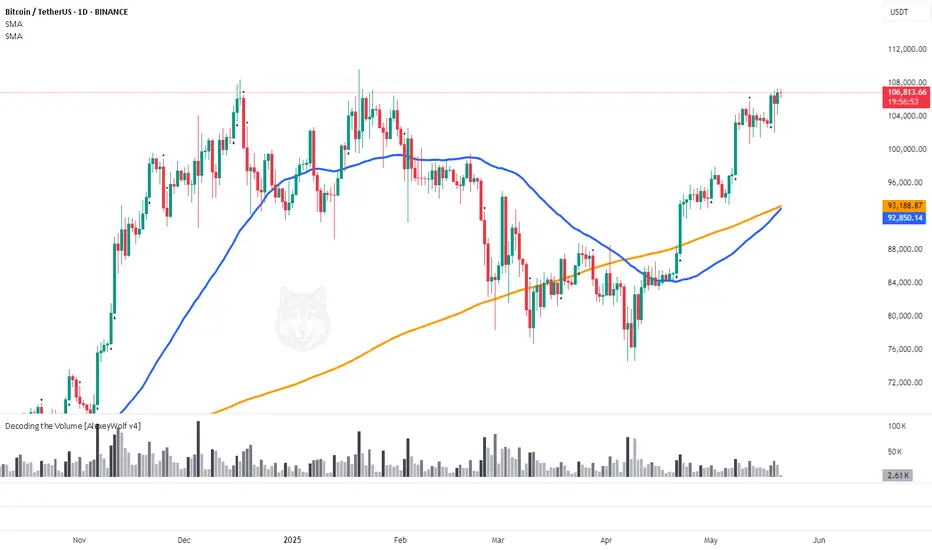
Bitcoin is approaching a “Golden Cross”🚀 Bitcoin is approaching a “Golden Cross”
(the 50-day moving average is about to cross above the 200-day)
What does that mean, and what might come next?
📍 What’s happening right now
BTC is squeezed in a $101 K – $107 K range.
The 50-day SMA is racing toward the 200-day SMA; the bullish crossover (the “Golden Cross”) is expected within the week.
On Deribit, more than 60 % of the 30 May option series are $110 K call options.
When traders buy these calls, market-makers hedge by buying spot BTC. The nearer the price gets to $110 K, the more spot BTC they have to buy.
📈 How the market behaved before
The 10-day chart shows the 50-day (blue) and 200-day (orange) SMAs.
In the last three cycles, a bullish Golden Cross appeared 50–90 days after a bearish “Death Cross.” Each time, the cross formed inside a buyer zone (marked with blue rectangles).
In the 2nd and 3rd cycles, price never came back to retest that buyer zone.
Right now, the buyer zone is already in place, the Golden Cross is only about $300 away, and 50 days have passed since the last Death Cross. Some traders seem to be buying early, betting on a break to a new all-time high (ATH).
Wishing you profitable trades!