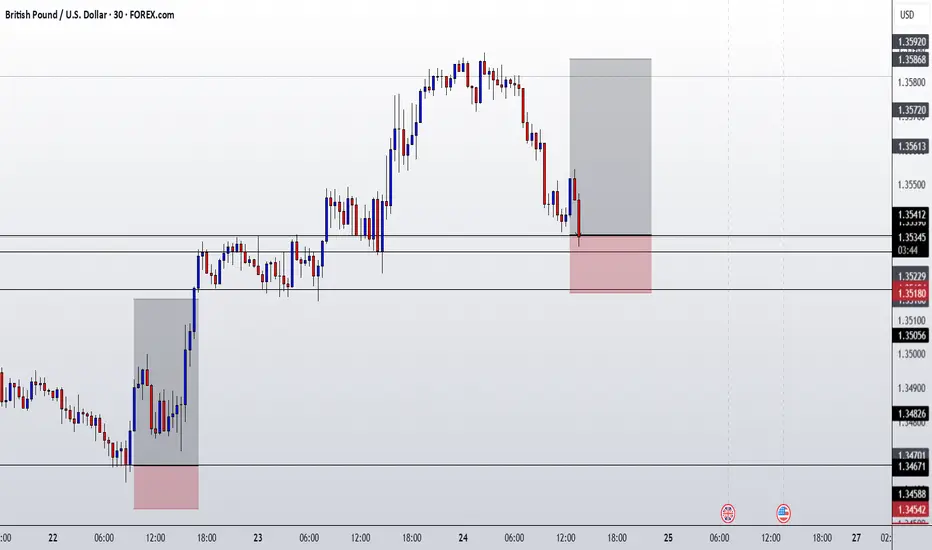
GBPUSD ENTRY CHARTOn this Pair, We are bullish, as the Dollar is still weak and the POUNDS DOLLAR is still in an UPTREND, on the HTF and the MID-TERM-TF, also on the Hourly, we got a Zone with additional confluences that are in align with the Trend, then on our Entry TF, We got a Sweep of LIQ, BOS and IND close to our POI, so we are IN, and if this matches with your TRADE IDEA, i advise you add a good risk management to manage your Trade, THANK YOU.
Multiple Time Frame Analysis
posting full SSThis post serves only to share the complete SS, which was not inadvertently included in the earlier post shared today.

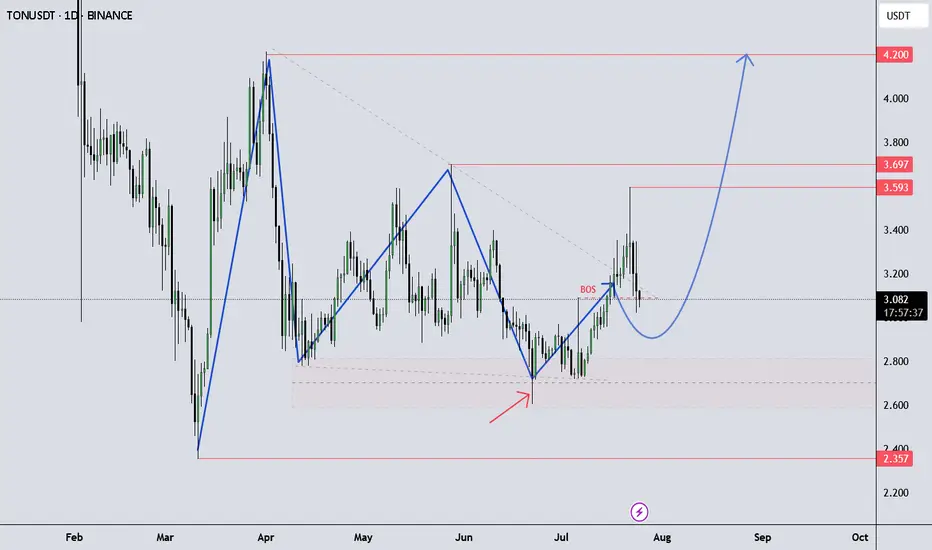
TONUSDT continue up!Looking for an Impulse Up – TONUSDT Outlook
TONUSDT is showing momentum to the upside as it continues its current structure, possibly developing another impulsive leg.
It’s important to follow your own trading plan and maintain proper risk-reward (RR) discipline.
This idea is shared for educational purposes only to support your learning.
Got questions? Feel free to drop them in the comments!
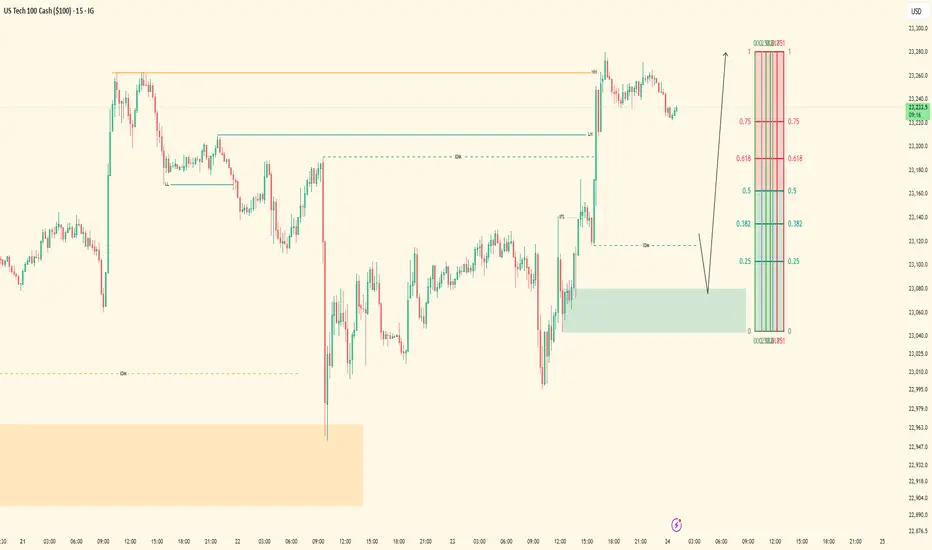
A correction ahead.If you know Elliott Wave, then you will understand this analysis. Now as you saw my last post a wave 'Y' on monthly T.F has started from 30 June. This was on a larger T.F but this analysis is on smaller T.F. Wave '1' has completed now on this T.F. and a correction ahead upto 0.618(25345) or 0.707(25420) of this enfire run as showed in screenshot.

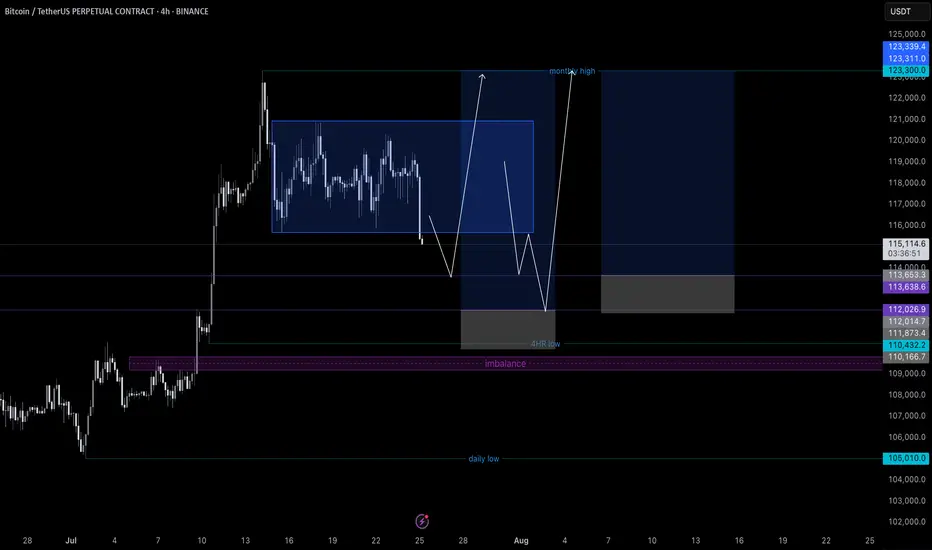
Bitcoin possible bounce setupsThis is the only ideal long setups for bitcoin right now to keep bullish momentums
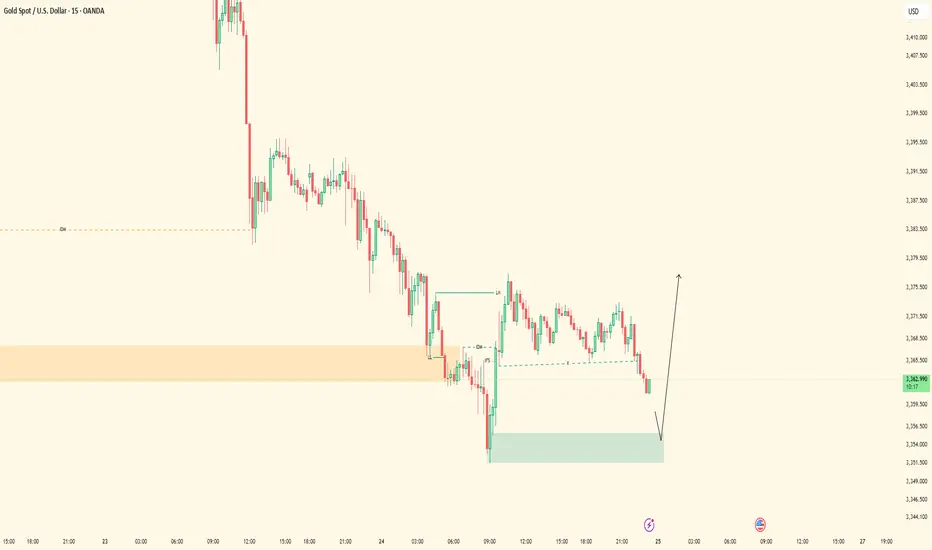
XAUUSD Locked In| Waiting for 5M OB SparkPair: XAUUSD (Gold)
Bias: Bullish
Timeframes: 30M / 5M
Gold has followed structure beautifully — top-down alignment from 30M into 5M is clear. Price respected the 30M OB and showed intent, but now we’re approaching the moment of truth.
I’m watching the 5M OB for entry — this is where execution mode activates. No rush. I’m in analysis mode right now, but the shift is coming.
Entry zone is mapped, structure’s in place, order flow is aligned — all I need now is price to do what it always does: respect the blueprint.
Entry Zone: 5M OB
Target: 5M highs
Mindset Note: Patience before the spark. I don’t force entries — I wait for the market to hand me the move it already hinted at. ⚡️
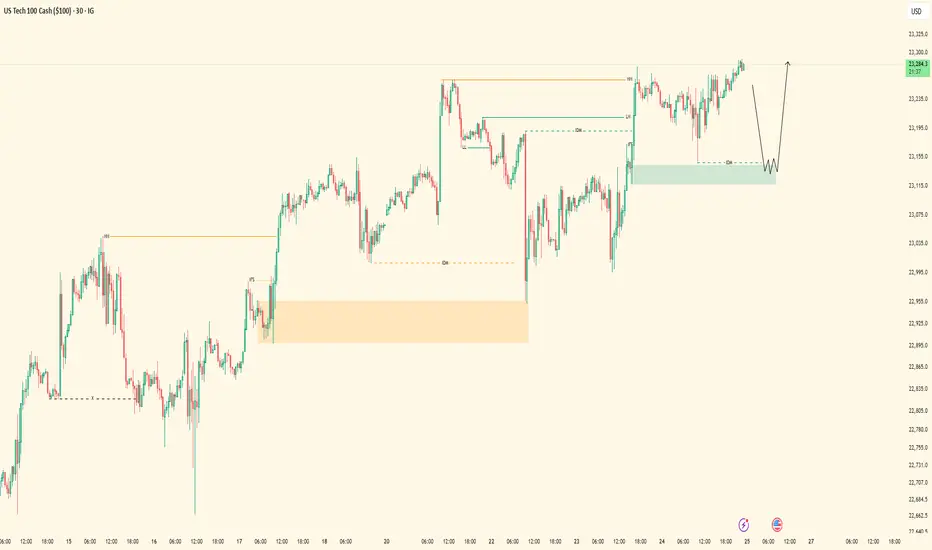
Nasdaq Bullish Flow | 5M OB Execution PendingPair: NAS100
Bias: Bullish
Timeframes: 30M / 5M
Price remains heavy bullish — structure aligning perfectly across the board. Ever since the 30M OB was mitigated, I’ve been following Nasdaq’s order flow step-by-step.
I was watching for full-bodied confirmations inside the 30M zone, but instead, price gave clarity through the lower timeframes. That 5M flip gave away smart money’s intent — showing me exactly where accumulation is happening.
Now waiting for price to tap into the 5M OB to shift into execution mode. This setup has been mapped with precision — no guessing. Once entry presents itself, I’ll follow through.
Entry Zone: 5M OB
Target: 5M highs
Mindset Note: Still in analysis mode — patience until price hits my zone. Smart money doesn’t rush, it accumulates. So do I. 💼
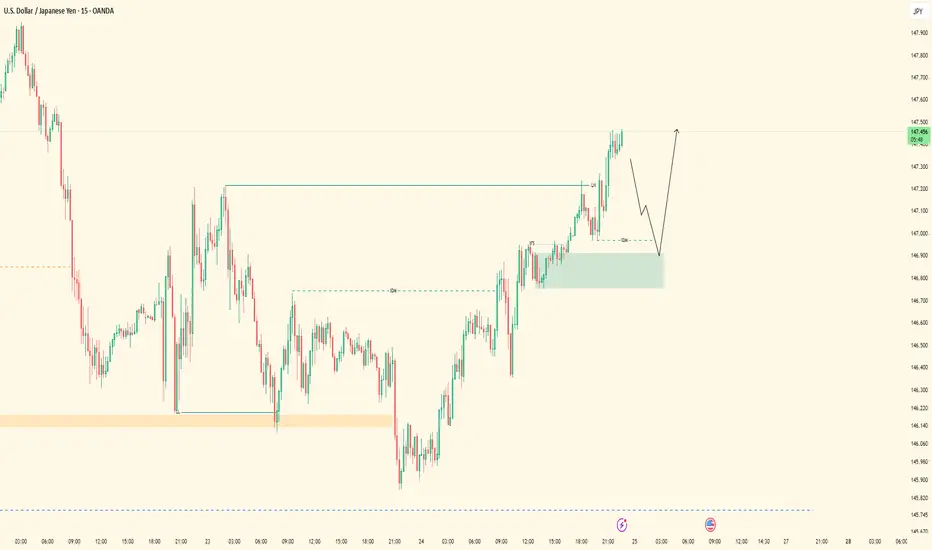
UJ Exexcution Flow| 5M OB Setup in MotionPair: USDJPY
Bias: Bullish
Timeframes: 30M / 5M
Top-down structure respected cleanly across the board — from HTF to LTF, price has been flowing exactly as forecasted. After confirming the bearish LH break and structure flip, we’re now in a bullish leg with intent clearly shown on the lower timeframes.
Currently waiting for price to mitigate the marked 5M order block for precise execution. Entry is valid and backed by structural logic — no guessing, just following what price has already confirmed.
Entry Zone: 5M OB (confirmed after LH break + LTF intent) Target: Clean 5M highs
Mindset Note: Analysis mode done. Execution mode engaged. I let price lead — I just follow structure.
Welcome Back! Gold Trading Strategy & Key Zones to WatchIn this week’s welcome back video, I’m breaking down my updated approach to XAU/USD and how I plan to tackle the Gold markets in the coming days. After taking a short break, I’m back with fresh eyes and refined focus.
We’ll review current market structure, identify key liquidity zones, and outline the scenarios I’m watching for potential entries. Whether you’re day trading or swing trading gold, this breakdown will help you frame your week with clarity and confidence.
📌 Covered in this video:
My refreshed trading mindset after a break
Key support/resistance and liquidity zones
Market structure insights and setup conditions
What I’ll personally avoid this week
The “trap zones” that might catch retail traders off guard
🧠 Let’s focus on process over profits — welcome back, and let’s get to work.

NovoCure Limited (NVCR) to rally 100% ??** short term forecast, days and weeks ahead **
On the above 10 day chart price action has crashed 95% since support failed. Today sellers are trying to push that correction to 100%, are they right?
Unlikely.
1) Price action (not visible on LOG) and RSI resistance breakouts.
2) Support on past resistance confirms.
3) Trend reversal. Higher lows print.
4) Bull flag confirmation forecasting a 100% move to mid 30’s.
Is it possible price action corrects further? Sure.
Is it probable? No.
Ww
Type: trade
Risk: you decide
Timeframe for long: Yesterday
Return: 100%
Stop loss: Will say elsewhere

USDCAD...potential further upside expectedHey Hey TradingView fam! Hope you guys are doing absolutely amazing today...hope your trading weeks are off to an amazing start and hopefully this post can be helpful for the remainder of this week for you! Let's dive in!
OK so for USDCAD this is a post to piggyback off of the previous swing position post I did for USDCAD longs a couple weeks ago...those positions played out well and now wanted to revisit this currency pair because it is giving another potential opportunity to mover to the upside and so wanted to break down what I see here. Let's make it simple
1. Weekly demand zone
2. Strong momentum from buyers on Daily timeframe
3. Higher low formed WITH STRENGTH (big clue of interest)
4. Fib extension lining up with daily supply zone
5. Higher low forming would then now expect a new higher high to form
OK hope that made sense! I want to make these posts as simple as possible so hopefully this added some value for you guys!
Please boost and follow my page for more highly accurate setups! Cheers!

SIMPLEST SELL SETUP YOU'VE EVER SEEN...POTENTIAL USDJPY SHORTSHey hey Tradingview community!!! Hope you are all doing amazing! Just wanted to do a very detailed and complex breakdown for potential swing short opportunities I see for USDJPY...let's dive in!!
OK so first....lol
I'm kidding. Very simple. Look at the chart. Mark those zones to look for shorts. Swing trading opportunity...Love you all!!
Cheers!
OH...if you need the RSI settings it is the 7 period deviation. Cheers pt. 2!
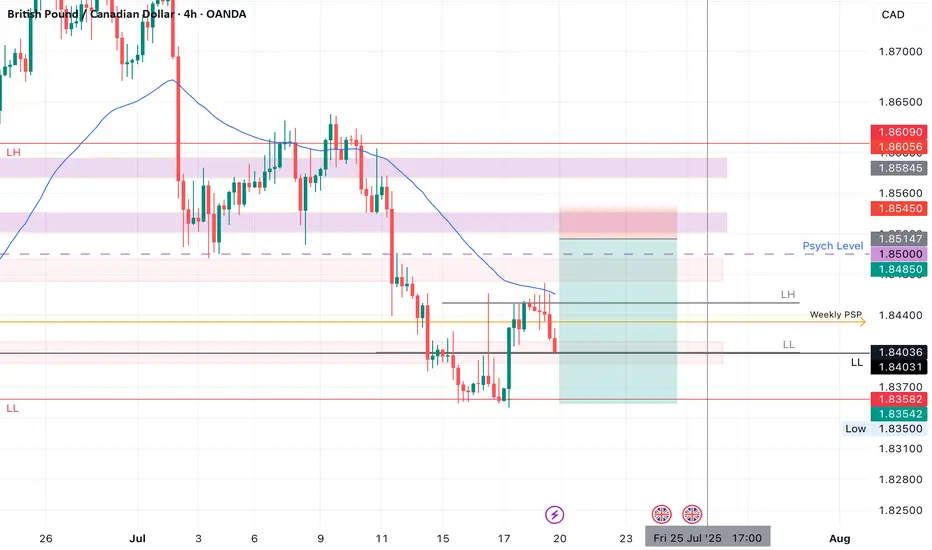
GBPCAD SHORTMarket structure bearish on HTFs DW
Entry at both Weekly and Daily AOi
Weekly Rejection at AOi
Previous Weekly Structure Point
Daily Rejection at AOi
Daily EMA retest
Around Psychological Level 1.85000
H4 Candlestick rejection
Levels 5.3
Entry 90%
REMEMBER : Trading is a Game Of Probability
: Manage Your Risk
: Be Patient
: Every Moment Is Unique
: Rinse, Wash, Repeat!
: Christ is King.
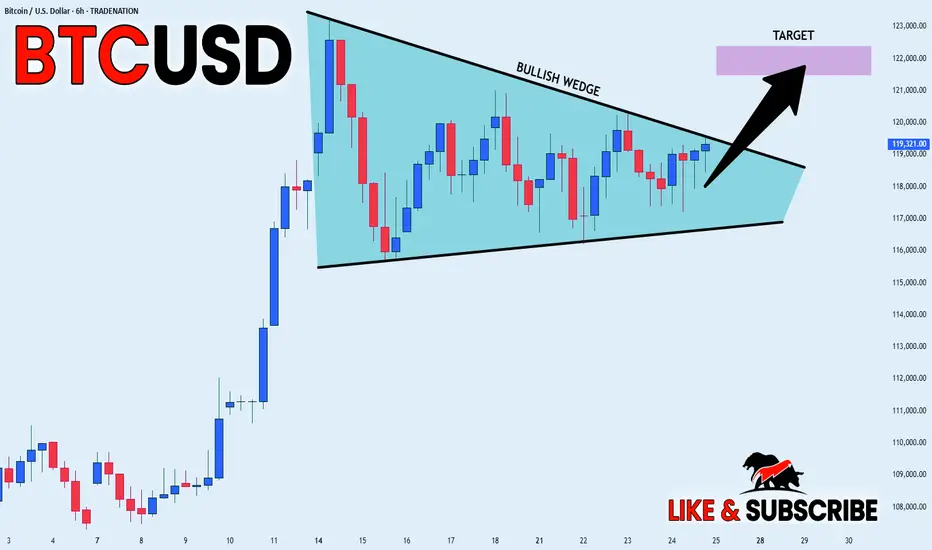
BITCOIN BULLISH WEDGE|LONG|
✅BITCOIN is trading in a
Strong uptrend and the coin
Has formed a massive bullish
Wedge pattern so we are
Bullish biased and IF we see
A bullish breakout we will
Be expecting a further
Bullish move up
LONG🚀
✅Like and subscribe to never miss a new idea!✅
Disclosure: I am part of Trade Nation's Influencer program and receive a monthly fee for using their TradingView charts in my analysis.
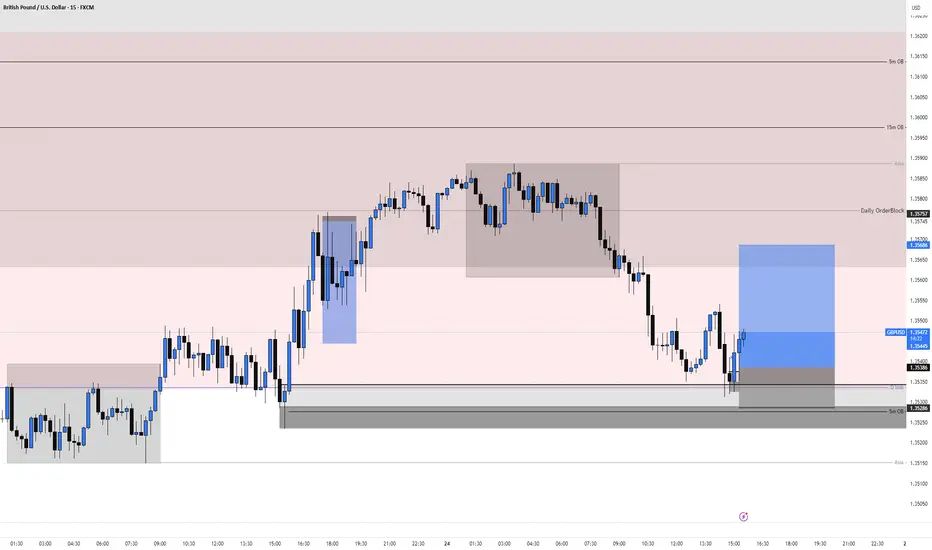
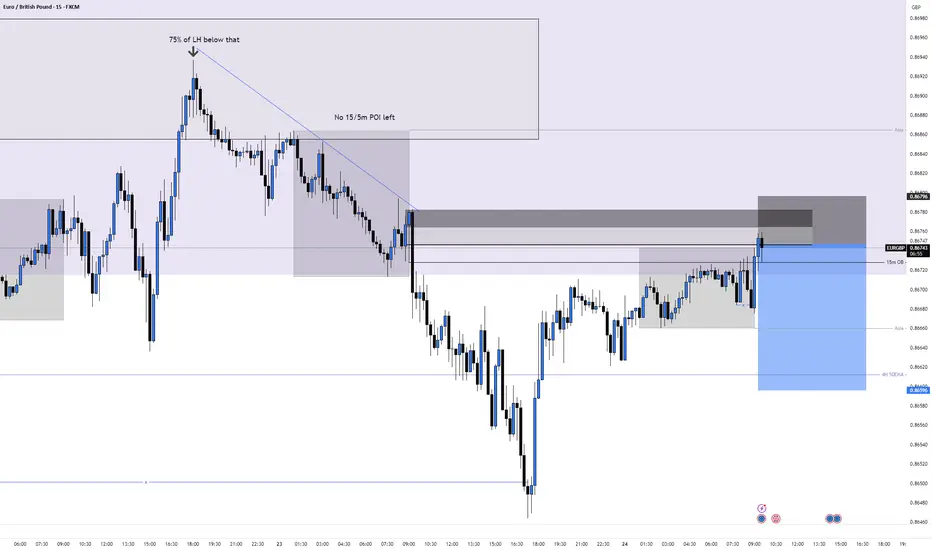
GBPUSD Long, 24 JulyBullish HL Setup from 15m POI + D Imbalance Reaction
Despite reacting from a Daily Bearish Orderblock, the higher timeframe remains overall bullish. Price tapped into a 15m POI aligned with a Daily Imbalance fill — signaling potential continuation of the macro trend.
📈 HTF Confluence:
✅ Daily Imbalance filled at a 15m POI
🔄 Overall trend remains bullish despite local D OB
❌ No clear HTF OB support in this exact zone, but reaction is valid
📉 LTF Confluence:
✅ Asia low in place — potential for HL formation
✅ Strong 15m uptrend, no bearish break of structure yet → 75% chance this is a HL
✅ DXY reacting from 5m OB + Asia gap to fill
❌ No strong rejections or gaps on EURUSD itself
🎯 Entry Setup:
✅ 1m BOS from 15m POI – confirmation buyers are stepping in
✅ Entry taken from 3m OB (5m and 1m OB were already mitigated)
✅ 15m Decisional OB backing the zone
❌ Not a clean 1m or 5m tap – more of a reactive entry post-structure shift
🛡 SL: Placed below the 3m OB – enough to protect structure with minimal risk
📌 TP: Targeting Asia high for continuation – 1:3 RR minimum
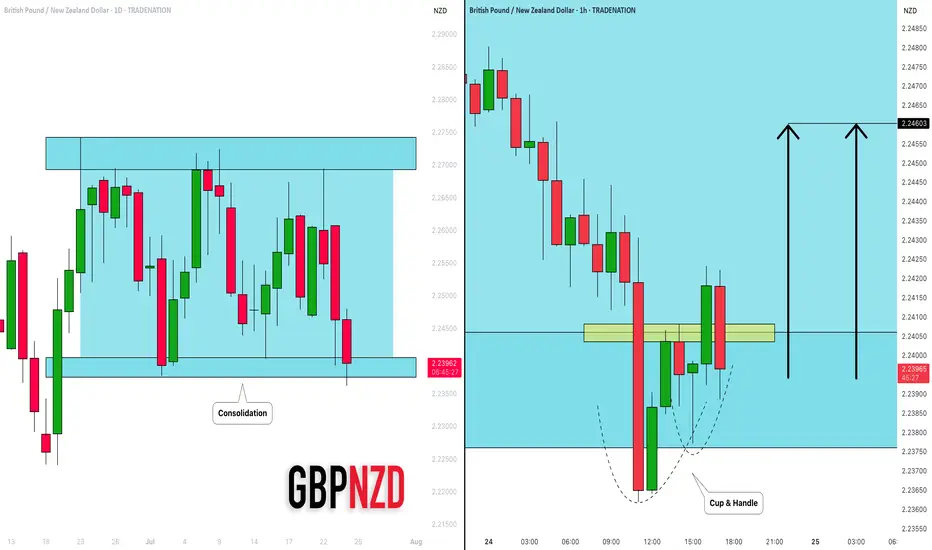
GBPNZD: Bullish Move in a Channel 🇬🇧🇳🇿
I see a horizontal parallel channel on GBPNZD on a daily.
The price is currently testing its support.
On an hourly time frame, a cup & handle pattern was formed on that.
Its neckline was violated with the today's high impact news.
I think that the price may bounce at least to 2.246 level.
❤️Please, support my work with like, thank you!❤️
I am part of Trade Nation's Influencer program and receive a monthly fee for using their TradingView charts in my analysis.
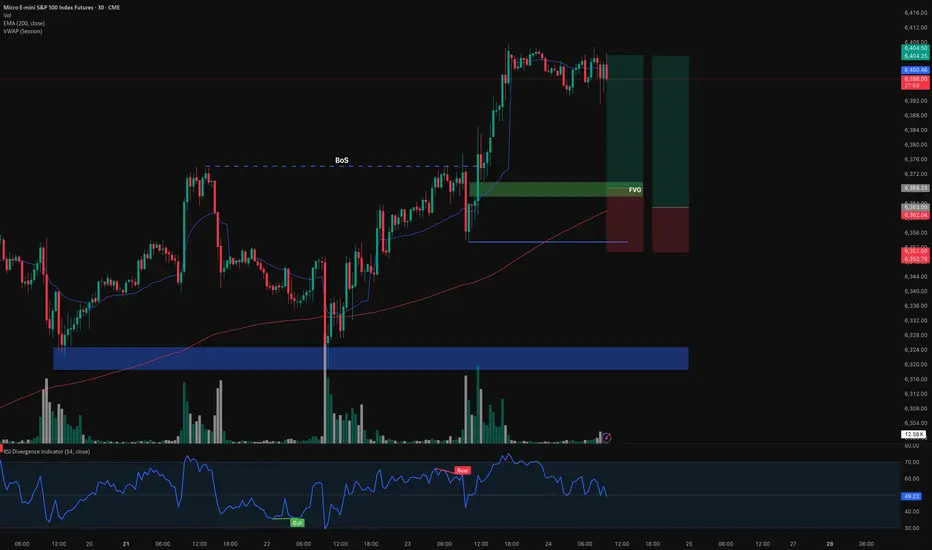
Long MESentry 6338
stop loss 6351
TP 6404.50
1. currently in a uptrend
2. FVG at 6368
3. above 200ema
Before I enter my trade at Id like to look for some market structure to form.
if it breaks below 6353.5 and makes a ChoCh im no longer bullish
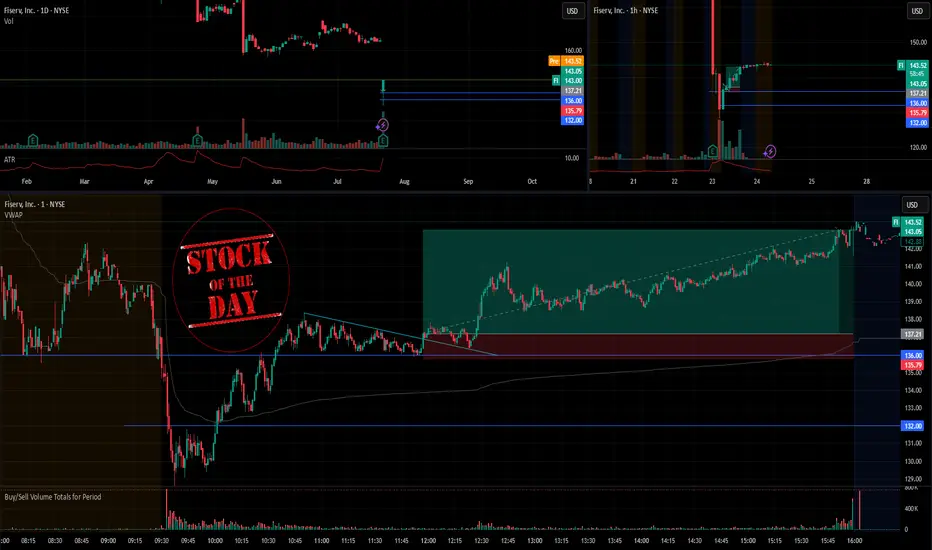
Stock Of The Day / 07.23.25 / FI07.23.2025 / NYSE:FI
Fundamentals. The earnings report exceeded expectations.
Technical analysis.
Daily chart: Downtrend
Premarket: Gap Down on increased volume. We mark the premarket low of 136.0
Trading session: The price did not continue the downward movement and formed an uptrend after the initial impulse down. The key moment is the reaction to the level of 136.0: if the downward trend will continue or the trend change to an uptrend will be confirmed. We observe the price tightening to the level of 136.0 against the uptrend with a clear hold of the level, after breakout the level. We consider a long trade to continue the upward movement in case tightening structure is broken upward.
Trading scenario: pullback along the trend (false_tightening) to level 136.0
Entry: 137.21 when the tightening structure is broken with exit upwards.
Stop: 135.79 we hide it behind the tail of the last pullback.
Exit: You can hold the position until the end of the session with due patience.
Risk Rewards: 1/4
P.S. In order to understand the idea of the Stock Of The Day analysis, please read the following information .
XAU/USD 24 July 2025 Intraday AnalysisH4 Analysis:
-> Swing: Bullish.
-> Internal: Bullish.
You will note that price has targeted weak internal high on three separate occasions which has now formed a triple top, this is a bearish reversal pattern and proving this zone is a strong supply level. This is in-line with HTF bearish pullback phase.
Remainder of analysis and bias remains the same as analysis dated 23 April 2025.
Price has now printed a bearish CHoCH according to my analysis yesterday.
Price is now trading within an established internal range.
Intraday Expectation:
Price to trade down to either discount of internal 50% EQ, or H4 demand zone before targeting weak internal high priced at 3,500.200.
Note:
The Federal Reserve’s sustained dovish stance, coupled with ongoing geopolitical uncertainties, is likely to prolong heightened volatility in the gold market. Given this elevated risk environment, traders should exercise caution and recalibrate risk management strategies to navigate potential price fluctuations effectively.
Additionally, gold pricing remains sensitive to broader macroeconomic developments, including policy decisions under President Trump. Shifts in geopolitical strategy and economic directives could further amplify uncertainty, contributing to market repricing dynamics.
H4 Chart:
M15 Analysis:
-> Swing: Bullish.
-> Internal: Bullish.
H4 Timeframe - Price has failed to target weak internal high, therefore, it would not be unrealistic if price printed a bearish iBOS.
The remainder of my analysis shall remain the same as analysis dated 13 June 2025, apart from target price.
As per my analysis dated 22 May 2025 whereby I mentioned price can be seen to be reacting at discount of 50% EQ on H4 timeframe, therefore, it is a viable alternative that price could potentially print a bullish iBOS on M15 timeframe despite internal structure being bearish.
Price has printed a bullish iBOS followed by a bearish CHoCH, which indicates, but does not confirm, bearish pullback phase initiation. I will however continue to monitor, with respect to depth of pullback.
Intraday Expectation:
Price to continue bearish, react at either M15 supply zone, or discount of 50% internal EQ before targeting weak internal high priced at 3,451.375.
Note:
Gold remains highly volatile amid the Federal Reserve's continued dovish stance, persistent and escalating geopolitical uncertainties. Traders should implement robust risk management strategies and remain vigilant, as price swings may become more pronounced in this elevated volatility environment.
Additionally, President Trump’s recent tariff announcements are expected to further amplify market turbulence, potentially triggering sharp price fluctuations and whipsaws.
M15 Chart:

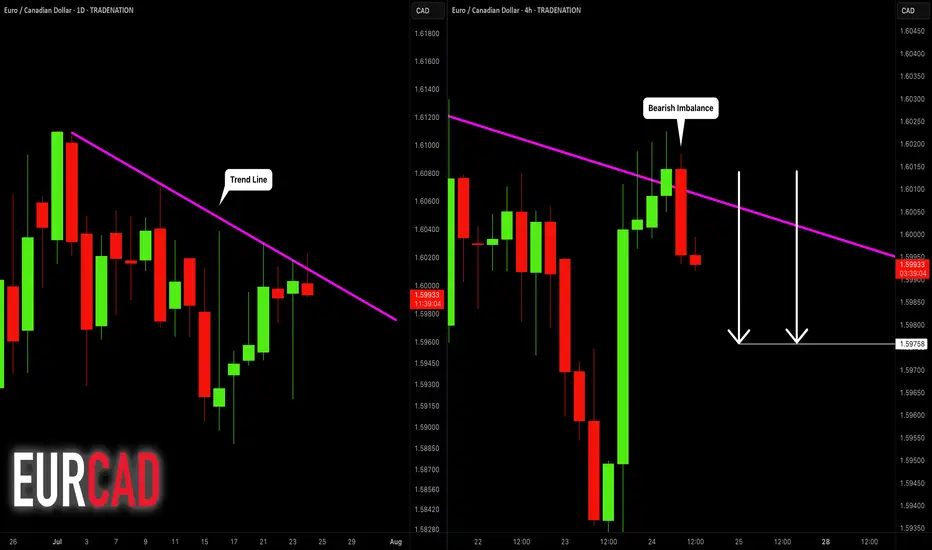
EURCAD: Bearish After the News 🇪🇺🇨🇦
EURCAD may drop from a solid daily resistance.
As a confirmation signal, I spotted a bearish engulfing candle
on a 4H time frame after its test.
The formation of this candle is accompanied by multiple negative
German fundamentals.
Goal - 1.5976
❤️Please, support my work with like, thank you!❤️
I am part of Trade Nation's Influencer program and receive a monthly fee for using their TradingView charts in my analysis.
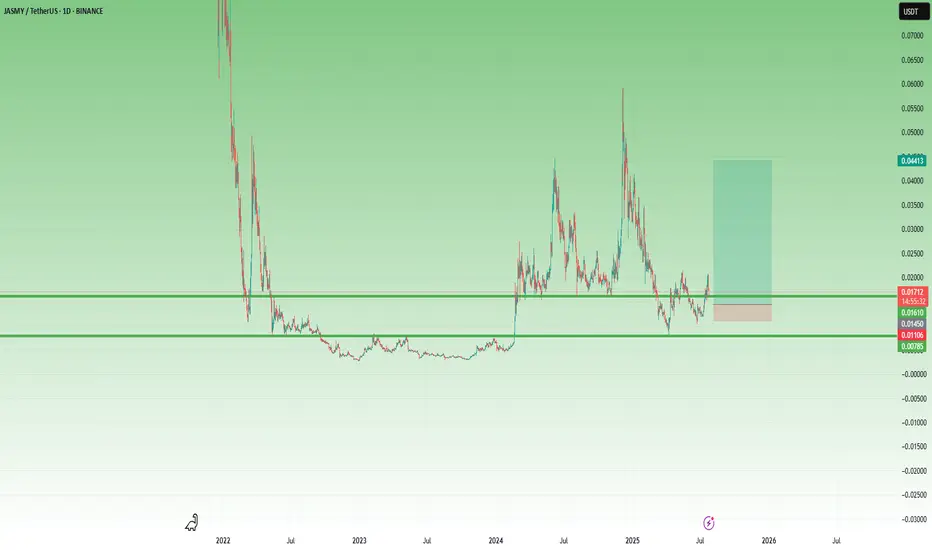
JASMY – A Volatile Setup with x3 Potential 🔸 After bottoming out at 0.003 and spending over a year in accumulation, JASMY finally broke above the key 0.008 resistance zone in February 2024. That breakout triggered a series of explosive moves – but just as violent were the drops that followed.
🔸 What stands out:
• The first post-breakout spike found a new support at 0.015.
• Then came a second vertical move toward 0.06, followed (of course) by a brutal drop.
• But… 0.008 held, and by late June, the chart printed a higher low, showing that buyers became interested.
📍 Right now, the price has reclaimed the 0.015 zone and is trying to stabilize above it. If this level holds, it could become the new base for the next wave.
💡 My plan?
This is very speculative, but I like the setup.
I’m looking to buy around 0.015–0.016, with clear negation below 0.010.
Target? Around 0.045, for a potential x3 move and a tasty 1:8 risk/reward.
⚠️ I’m not the guy who repeats the cliché “ only trade what you can afford to lose, ”
but seriously – this one is for clubbing money, not summer vacation money.
Let the volatility work in our favor. 🚀
EURGBP Short, 24 July Playing Off 15m POI After HTF Wick Rejection
HTF shows strong rejection from Weekly Highs with clear wick activity, and price tapped into a 4H Orderblock 📉
Structure shifted bearish on LTF with a clean 15m BOS — the last OB from the full move is now in play.
Asia high sits above and can’t be covered with a 10 pip stop, so I used a tighter 5 pip SL to cover just the OB (high probability since no key zones sit above) ✅
📉 Confluences:
– Weekly High wick rejection
– 4H OB tapped
– 15m BOS
– 1m BOS from 15m POI
– Entry from cleaner 5m OB inside 15m OB
🎯 TP: Targeting Asia Low
💰 RR: 5 pip SL improves RR since GU moves slow
🛡️ SL: Tight stop covering only the OB — if invalidated, setup likely fails anyway
NASDAQ100| - Bullish Bias RemainsPrice didn’t give me the deep candle retrace into my 30M OB — just a wick tap — but that was enough. That wick shows me smart money touched in.
Dropped to the LTF and got my shift in structure confirming bullish intent.
Now I’m locked in, watching for price to sweep a 5M sell-side liquidity pocket into a clean LTF order block for the next entry.
🎯 Target: Short-term 5M highs
🚀 Bias: Still bullish unless structure breaks
This is a patience game now — execution only after confirmation.