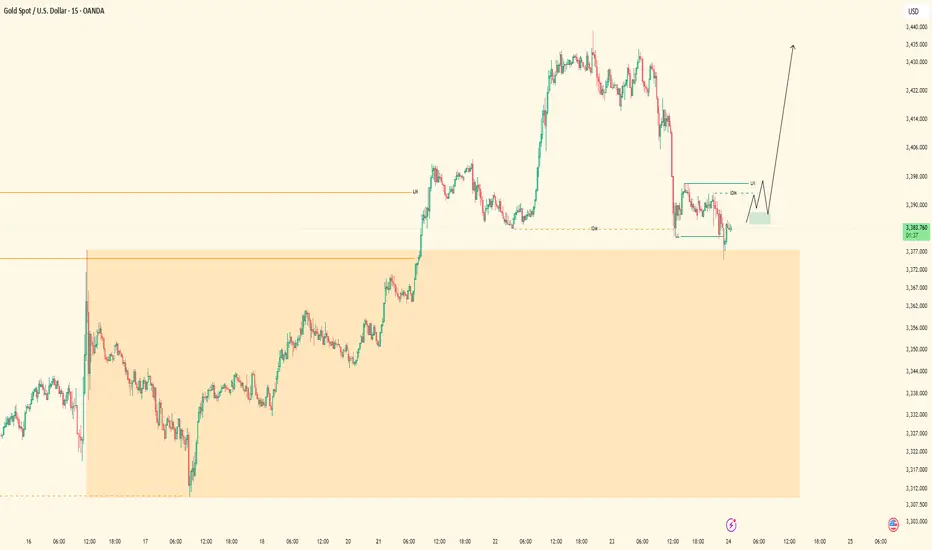
XAUUSD| Smart Money Confirmations LoadingBias: Bullish
HTF Overview: Price has just tapped into the 30-minute order flow zone after clearing out sell-side liquidity. This area aligns cleanly with bullish intent and prior structure.
LTF Focus: Currently waiting for lower timeframe confirmation — ideally a clear CHoCH or internal flip. Once smart money confirms this zone with a shift, I’ll look to enter and ride the momentum.
Target: Initial focus is on the 5-minute highs as a short-term objective. While price could continue toward 30-minute highs, structure suggests the recent 5M high is a more immediate and realistic target, making it a smarter move to secure profit around that level.
Mindset Note: Not in a rush — letting price speak first. The confirmation is what separates a guess from a smart move.
Multiple Time Frame Analysis
Pending Orders Are Not Set in Stone – Context Still MattersIn a previous educational article, I explained why I almost never trade breakouts on Gold.
Too many fakeouts. Too many emotional traps.
Instead, I stick to what works:
• ✅ Buying dips
• ✅ Selling rallies
But even these entries — placed with pending orders — are not automatic.
Because in real trading, price is not just a number — it’s a narrative.
And if the story changes, so should the trade.
________________________________________
🎯 The Setup – Buy the Dip Around 3400
Let’s take a real example from yesterday.
In my analysis, I mentioned I would look to buy dips near 3400, a former resistance now acting as support.
Price dropped to 3405, just a few points above my pending buy at 3402.
We saw a clean initial bounce — confirming that short-term support was real.
But I missed the entry by 30 pips.
So far, so good.
But here’s the important part — what happened next changed everything.
________________________________________
🧠 The Rejection Shifted the Entire Story
The bounce from 3405 was immediately sold into at 3420, a newly formed short-term resistance (clearly visible on the 15-minute posted chart).
After that, price started falling again — heading back toward my pending order.
📌 At that point, I cancelled the order. Why?
Because the context had changed:
• Bulls had tried once — and failed at 3420
• Sellers were clearly active and waiting above
• A second drop into my level wouldn’t be a clean dip — it would be retest under pressure.
The market was no longer giving me a “buy the dip” setup.
It was showing me a failed recovery. That’s a very different trade.
________________________________________
💡 What If It Had Triggered?
Let’s imagine that price had hit 3402 first, triggering my order.
Then rebounded, failed at 3420, and started dropping again.
Even then, I wouldn’t hold blindly.
Once I saw the rejection at 3420, I would have understood:
The structure had shifted.
The bullish case is weakening.
Exit early — breakeven or small controlled loss.
________________________________________
🔁 Sequence > Level
This is the most important principle:
• ✅ First down, then up = healthy dip → shows buyers are still in control
• ❌ First up, then down = failed breakout → shows selling pressure is stronger
Two scenarios. Same price. Opposite meaning.
That’s why you should look for:
Not just where price goes — but how it gets there.
________________________________________
🔒 Pending Orders Are Conditional
Many traders treat pending orders like traps:
“Just let price come to my level, and I’m in.”, but you should refine a little
✅ Pending orders should be based on a conditional expectation
❌ Not a fixed belief that the zone must hold
If the market tells a different story, remove the order.
No ego. No drama. Just process.
________________________________________
📌 Final Thought
Trading isn’t just about catching a price.
It’s about understanding price behavior.
First down, then up = strength.
First up, then down = weakness.
Let the market show its hand — then decide if you want to play.
Disclosure: I am part of TradeNation's Influencer program and receive a monthly fee for using their TradingView charts in my analyses and educational articles.
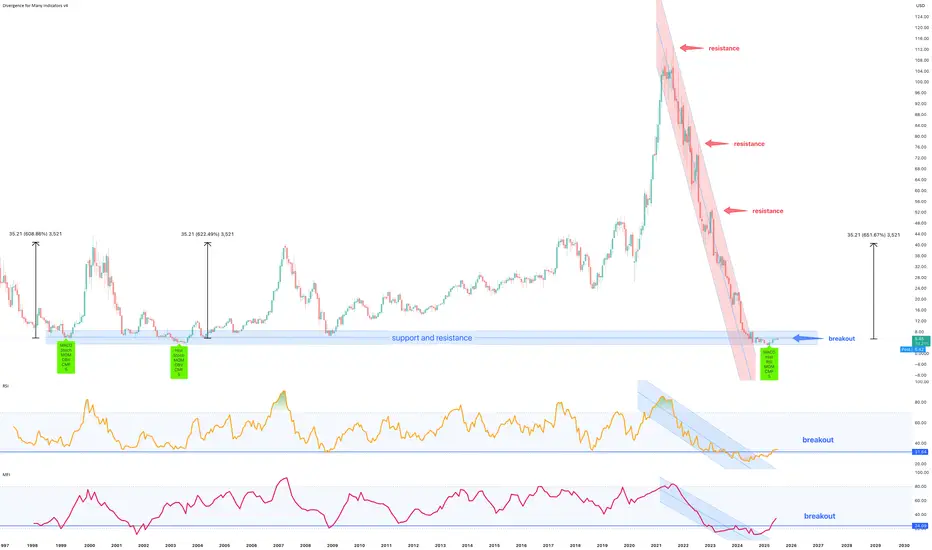
TTEC Holdings Inc, 500% return for the shrewd** long term forecast, the months ahead **
A 97% correction is shown on the above 16 day chart. As of 2021 price action has collapsed from $112 to circa $5 today. A number of reasons now exist for a bullish outlook.
Support and resistance
Price action, Relative Strength Index (RSI), and Money Flow Index both print resistance breakouts.
Look left. Price action is now on legacy support from 1999, 2003, and 2009 market bottoms. This is not the place to be a seller.
The trend
Something interesting in the RSI and MFI (orange and pink lines below chart). They are showing signs of a trend reversal, with higher highs and lower low prints after the breakouts. Exactly what happened in 1999, 2003, and 2009. A deja vu moment.
Positive divergence
Multiple oscillators print positive divergence with price action. Ready to be dazzled? Not only multiple oscillators as in previous years but the same oscillators!
The Stock
Two notes of interest,
1. No share splits.
2. Short interest 18%
Fundamentals
If you’re not chasing businesses who seek to implement AI into their operations, then you’re going to be miss out on some of the best returns in the years ahead. Crypto currency was yesterday, now in decline and dying. Today the narrative is AI, follow the money.
Is it possible price action continues to correct? Sure.
Is it probable? No
Ww
GBPUSD - Next buy from demandLooking here for potential further buying momentum to the upside.
Will see how this plays out tomorrow
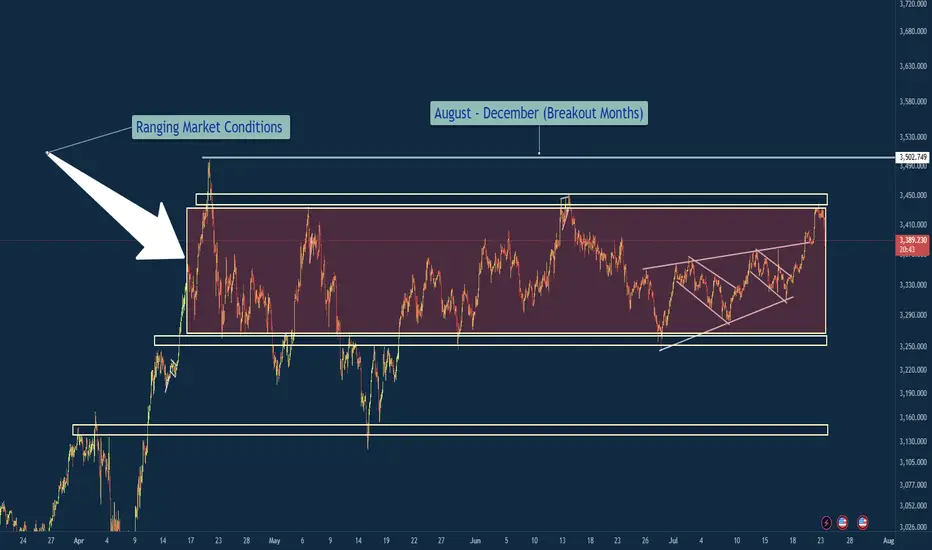
XAU/USD – Ranging Market Prepping for Breakout?Gold has been ranging for the next couple months and usually I am out of the market during the months of April Through July because historically these are not my best months trading XAU/USD. However you will see me posting a lot more in the coming months because my best months historically are August - December where the market really cranks up with some bigger moves.
So in a summarized version below you will find what it is that i am looking at with gold.
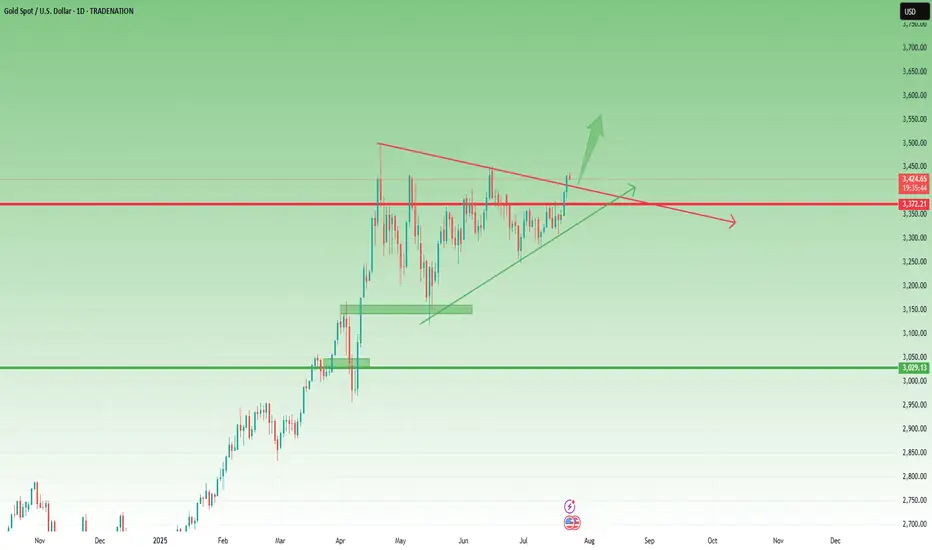
Gold (XAU/USD) has remained locked in a defined consolidation range between 3,250 (support) and 3,450–3,502 (resistance) since early April. Price has printed multiple internal falling wedge formations within this zone, indicating compression before potential expansion.
🔍 Technical Overview
Range Duration: ~3.5 months
Key Range:
Support: 3,250
Resistance: 3,450–3,502
Compression Patterns: Multiple falling wedges breaking upwards inside the range, hinting at bullish pressure.
Touch Confirmations: Both range boundaries have been tested multiple times, reinforcing validity (per Multi-Touch Confirmation).
Contextual Bias: Seasonally, August–December tends to be a high-volatility trending period for Gold.
🎯 Trade Plan
Inside Range:
Maintain neutral bias.
Execute range-to-range scalps/swing setups with clear invalidation zones.
Avoid trading mid-range.
Breakout Scenario (Bullish):
A clean close above 3,502 triggers breakout watch.
Ideal setup: Retest + 15-min flag → long continuation.
Potential upside target: ~3,700 (range height extension).
Breakdown Scenario (Bearish):
Loss of 3,250 opens door to bearish continuation.
Look for clean liquidity sweep or structure flip before committing.
Initial downside target: 3,100 zone.
🛡️ Risk Notes
Avoid third-touch entries in aggressive momentum unless followed by flag formation.
Remain disciplined with the 80/20 confluence rule — don't let perfectionism delay entries.
Always execute with pre-trade checklist and defined R:R profile.
✅ Summary
Gold is at a pivotal point. The confluence of a tight multi-month range, internal compression patterns, historical breakout timing, and validated levels builds a compelling case for an imminent expansion move. Remain patient, avoid anticipation, and react to confirmed structure and price behavior.
Nasdaq in future Everything's clear on chart
I wanna see a bullish move on NQ first to create a up run leg and come back to the lower 50 percent of that leg then ...

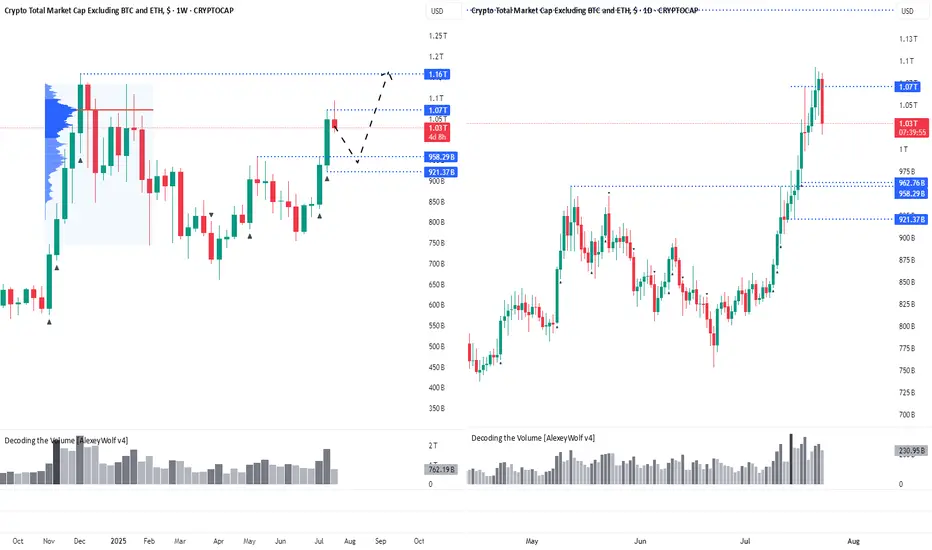
Altcoin Correction Scenario: Where to Look for EntriesHi traders and investors!
The market capitalization of Total3 has reached $1.07 trillion, marking the first major target for the altcoin market.
This level corresponds to the Point of Control (POC) from the previous bullish rally and the subsequent correction — a key area of traded volume and market interest.
Several factors now suggest the potential for a continued move higher. On the fundamental side, the recent signing of a pro-crypto bill by Donald Trump has boosted overall sentiment in the digital asset space, especially among altcoins. From a technical perspective, many leading altcoins are showing bullish continuation patterns.
Ideally, if the altcoin market corrects its capitalization (Total3) into the 963B–921B range, it would be a good zone to look for buying opportunities with the target of renewing the capitalization ATH.
Wishing you profitable trades!
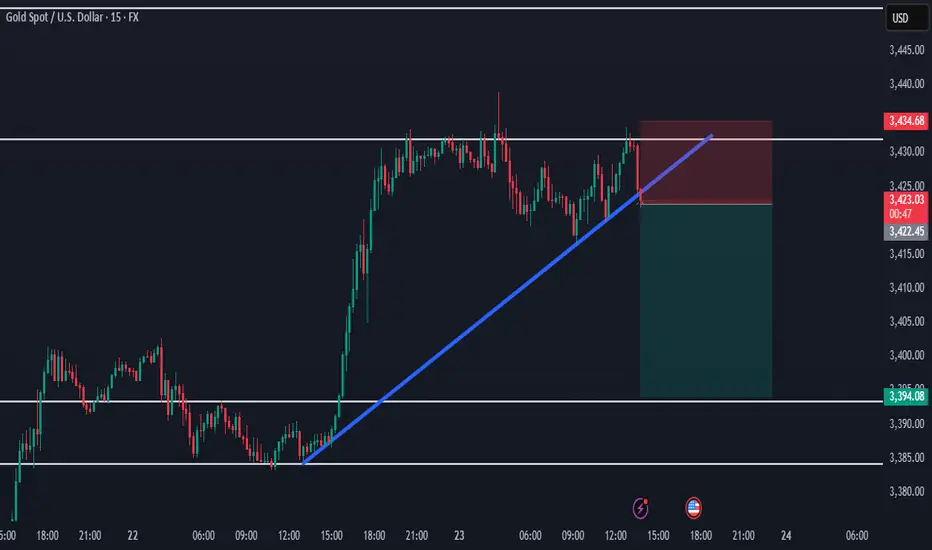
Gold Hits Supply Zone — Short-Term Sell OpportunityHello traders!
Gold has reached a supply zone and is starting to bounce back from it.
With the overall trend still bullish, we can look for a short-term sell position here.
The target is around 3394.
Manage your risk and trade safe!
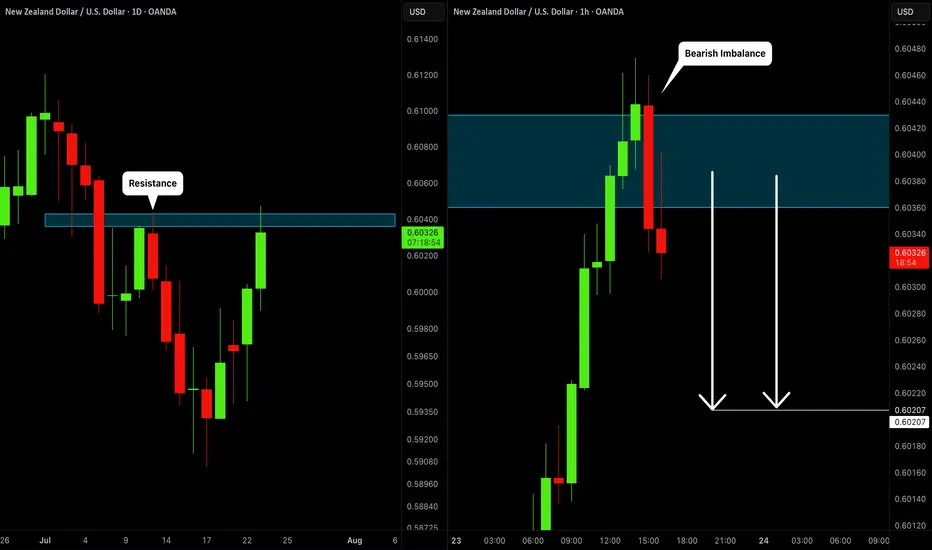
NZDUSD: Time For Pullback 🇳🇿🇺🇸
I think that NZDUSD will retrace from the underlined resistance.
As a confirmation, I spotted a bearish imbalance candle on an hourly time frame
after its test.
There is a high chance to see a retracement.
Goal - 0.602
❤️Please, support my work with like, thank you!❤️
LONG ON GBP/CADGBP/CAD is now at a major key area/demand zone after completing its pullback phase.
I expect price to now rise to the next level of supply or previous high.
looking to catch 200-400 pips throughout the week.

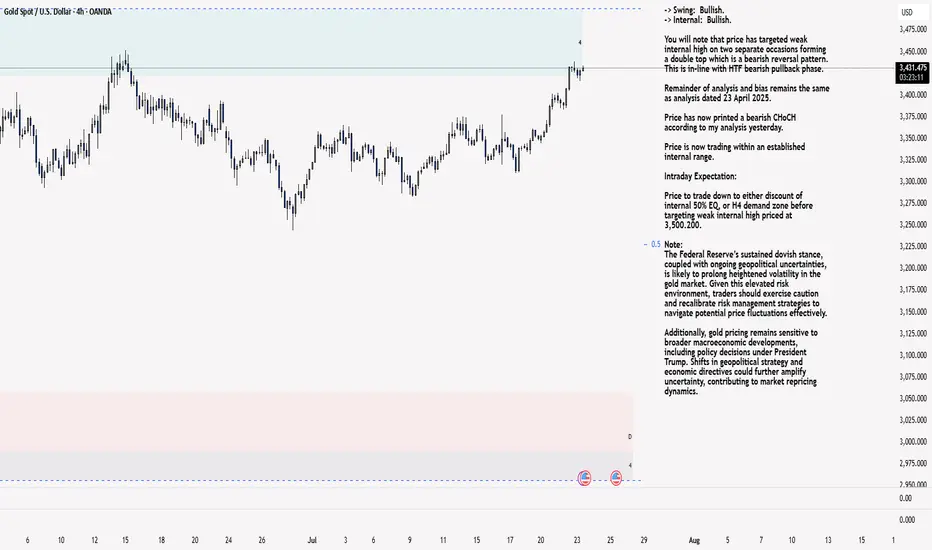
XAU/USD 23 July 2025 Intraday AnalysisH4 Analysis:
-> Swing: Bullish.
-> Internal: Bullish.
You will note that price has targeted weak internal high on two separate occasions forming a double top which is a bearish reversal pattern. This is in-line with HTF bearish pullback phase.
Remainder of analysis and bias remains the same as analysis dated 23 April 2025.
Price has now printed a bearish CHoCH according to my analysis yesterday.
Price is now trading within an established internal range.
Intraday Expectation:
Price to trade down to either discount of internal 50% EQ, or H4 demand zone before targeting weak internal high priced at 3,500.200.
Note:
The Federal Reserve’s sustained dovish stance, coupled with ongoing geopolitical uncertainties, is likely to prolong heightened volatility in the gold market. Given this elevated risk environment, traders should exercise caution and recalibrate risk management strategies to navigate potential price fluctuations effectively.
Additionally, gold pricing remains sensitive to broader macroeconomic developments, including policy decisions under President Trump. Shifts in geopolitical strategy and economic directives could further amplify uncertainty, contributing to market repricing dynamics.
H4 Chart:
M15 Analysis:
-> Swing: Bullish.
-> Internal: Bullish.
H4 Timeframe - Price has failed to target weak internal high, therefore, it would not be unrealistic if price printed a bearish iBOS.
The remainder of my analysis shall remain the same as analysis dated 13 June 2025, apart from target price.
As per my analysis dated 22 May 2025 whereby I mentioned price can be seen to be reacting at discount of 50% EQ on H4 timeframe, therefore, it is a viable alternative that price could potentially print a bullish iBOS on M15 timeframe despite internal structure being bearish.
Price has printed a bullish iBOS followed by a bearish CHoCH, which indicates, but does not confirm, bearish pullback phase initiation. I will however continue to monitor, with respect to depth of pullback.
Intraday Expectation:
Price to continue bearish, react at either M15 supply zone, or discount of 50% internal EQ before targeting weak internal high priced at 3,451.375.
Note:
Gold remains highly volatile amid the Federal Reserve's continued dovish stance, persistent and escalating geopolitical uncertainties. Traders should implement robust risk management strategies and remain vigilant, as price swings may become more pronounced in this elevated volatility environment.
Additionally, President Trump’s recent tariff announcements are expected to further amplify market turbulence, potentially triggering sharp price fluctuations and whipsaws.
M15 Chart:
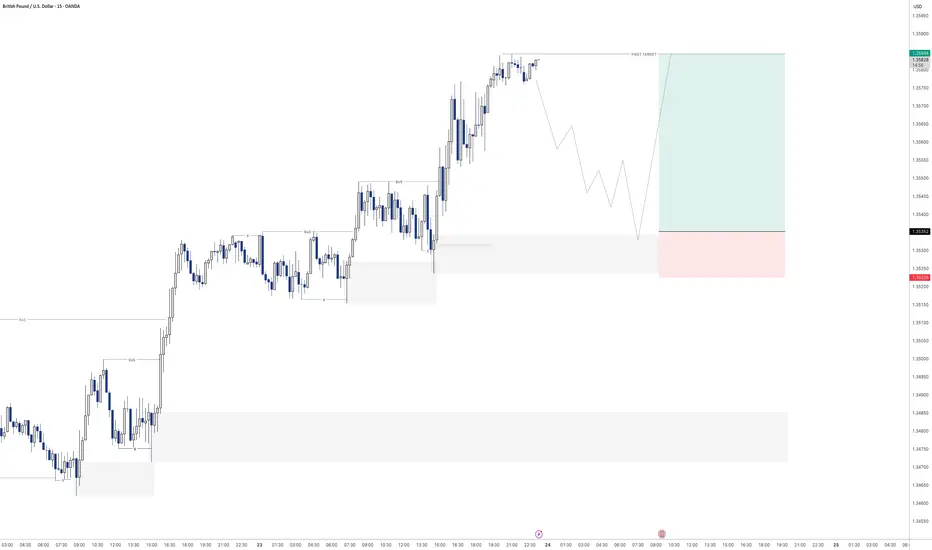
GBPUSD - Buying continuationLooking to keep buying the bullish orderflow on the 15min.
Had a nice sweep of liquidity before creating a new high. Will see how this one plays out over the day
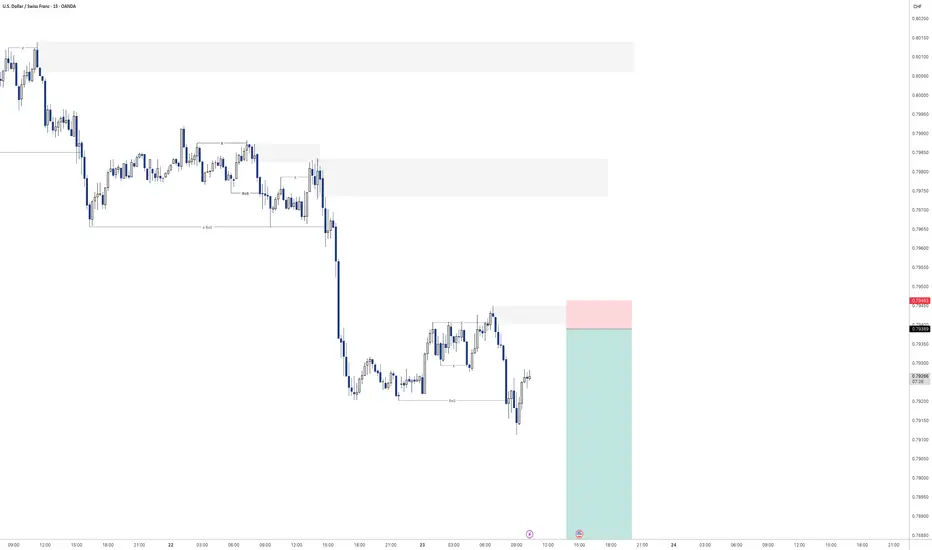
USDCHF - Sell off continuation?Looking for continuation of the selling pressure here on USDCHF
Will see how we play out for the rest of the day
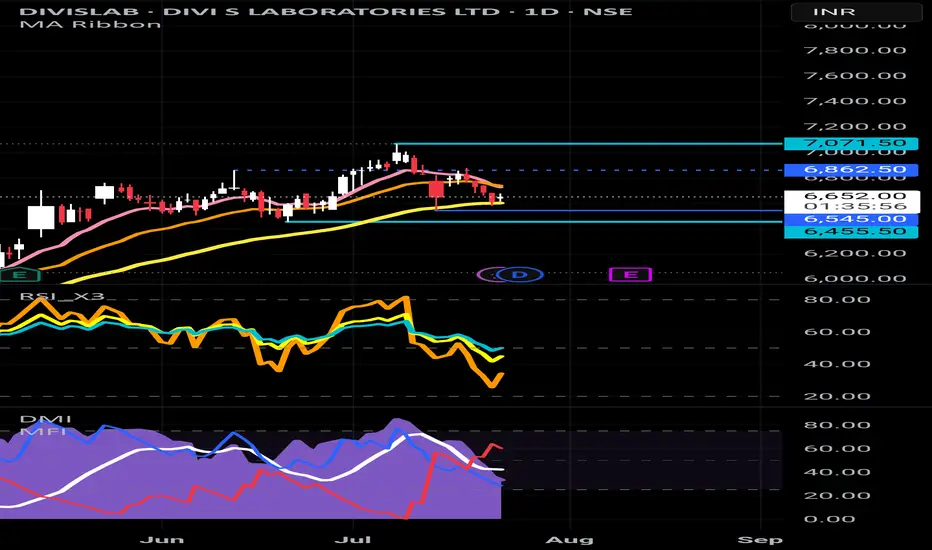
DIVISLAB Swing Trading For Swing Traders
Entry Zone: ₹6,550–6,600 (if retested)
SL: Below ₹6,460 (structure + demand)
Target: ₹6,950–7,100
Risk: Moderate, as RSI and DMI are realigning upward.
For Investors / Position Traders
Hold with trailing SL below ₹6,100
Can add on dips around ₹6,200–6,300 (volume-backed demand zone)
Long-term uptrend intact on all timeframes.
DIVISLAB remains structurally bullish across all timeframes, with the recent dip forming a higher low near a well-established demand zone. Indicators suggest bullish strength returning, especially on the weekly and monthly scales. Current setup offers a good reward-to-risk swing opportunity, with positional investors best advised to hold or add on any dip towards ₹6,300–6,500.
CHFJPY Looks Toppy… Is a 500 Pip Crash Coming?CHFJPY Has Exploded Past 180 — But Is the Top Already In?
After blowing clean through the key 180 resistance level, CHFJPY has continued surging into July — a month historically known for thin liquidity as traders hit holiday mode. These low-volume environments often lead to exaggerated price moves, much like we see in late December.
From a structural standpoint, this pair looks seriously overextended and ripe for a sharp pullback — with potential downside targets around 180 and 178 over the coming weeks.
If I were a bull, I’d want to see a clear break and weekly/monthly close above 186 before considering further upside.
As it stands, I’m gradually building into a short position, eyeing that 180 handle as my first key level.
Let me know your thoughts in the comments — agree, disagree, or seeing something I’m not?
*This is my personal analysis shared for educational purposes only. Always do your own research — never blindly follow anyone’s trades.*

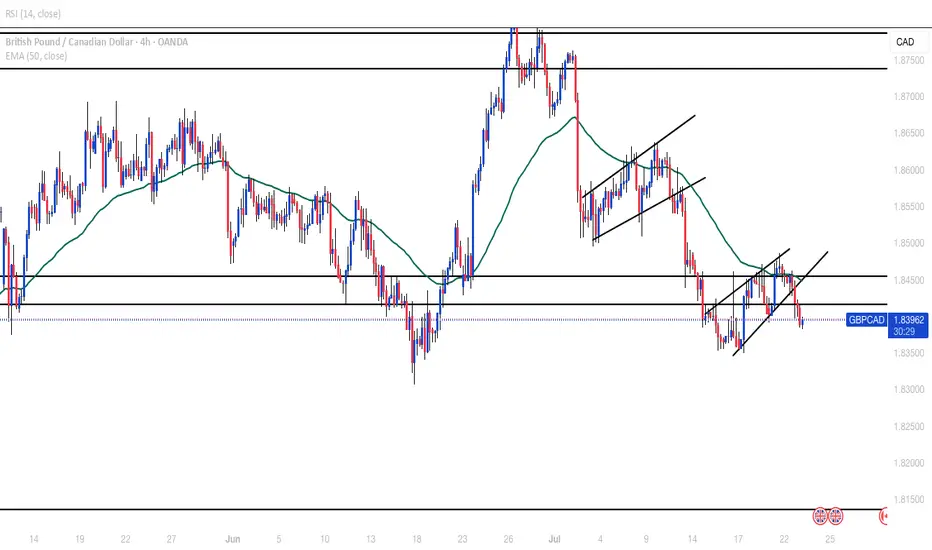
GBPCAD SELLSH4 double top with broken neckline at a strong daily zone, bearish flag was also formed. Looking at next daily support around 1.81500
AUDUSD Long - A BreakdownAfter a thorough breakdown, I decided to enter longs on AUD/USD. I expect for price to reach highs of around .65898 Which is the daily structure high Currently in profit On a long position and We entered on the 5 minute using a one hour stop loss Hopefully this trade continues to play out, and we'll see you on the other side of profit.

Gold Update – Strong Breaks, Strong BullsYesterday, after the break of the key 3370 resistance, Gold corrected slightly toward 3383, then consolidated briefly in that area. From there, it launched into a strong new leg up, closing the day once more near the highs, around 3430.
📌 What’s important here is that the price did not even come back to retest the broken resistance — now turned support. Combined with the strong daily close near the high of the range, this gives us a clear message:
➡️ Bulls are in full control.
________________________________________
🔍 This Week – Three Key Breaks
So far this week, Gold has delivered three major breakouts:
• ✅ A clean breakout from the box consolidation that kept price stuck and indecisive last week
• ✅ A decisive break above the 3400 psychological figure
• ✅ A breakout above the symmetrical triangle resistance, which had been forming since late April
Each of these is significant on its own. Together, they suggest a shift toward a more aggressive bullish scenario.
________________________________________
🔮 What’s Next?
All these breakouts point to the potential for more gains ahead.
In fact, the next logical step could be an attempt to mark a new All-Time High.
My view remains the same:
Buying dips remains the strategy of choice, with a focus on the 3400 zone as a key support area, and a swing target around 3500.
Disclosure: I am part of TradeNation's Influencer program and receive a monthly fee for using their TradingView charts in my analyses and educational articles.
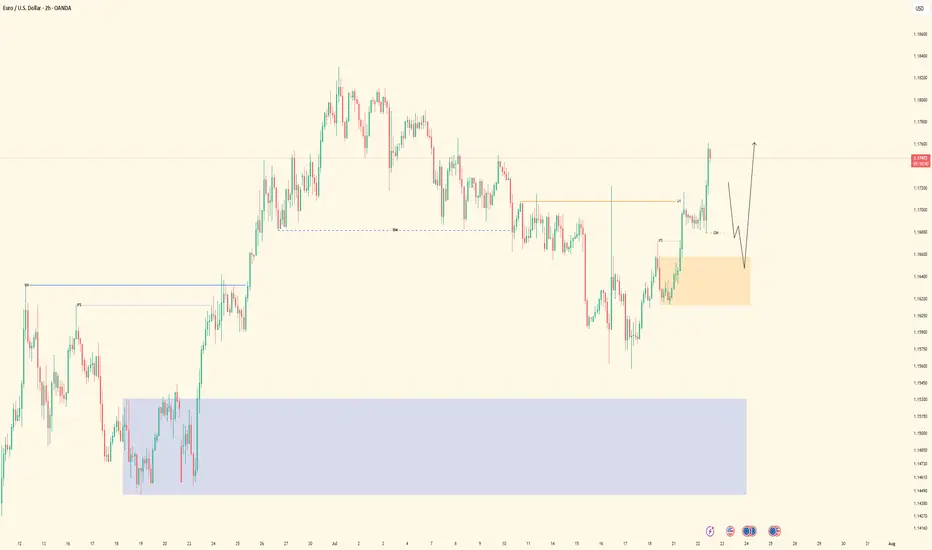
EURUSD| Back Aligned Bullish - Still in Analysis ModePair: EURUSD
Bias: Bullish
Following price closely and adapting to the market’s rhythm.
Recent structure showed that price is still respecting last week’s key zones — so I’ve realigned with the bullish bias accordingly.
No entries yet — still in analysis mode, which honestly is the best part 😉
Watching for clean LTF confirmations before engaging. No guessing. No forcing.
Price always tells the truth — you just gotta stay patient enough to listen.
#EURUSD #SMC #bullishbias #marketstructure #inducementking #smartmoneyflow
Bless Trading!
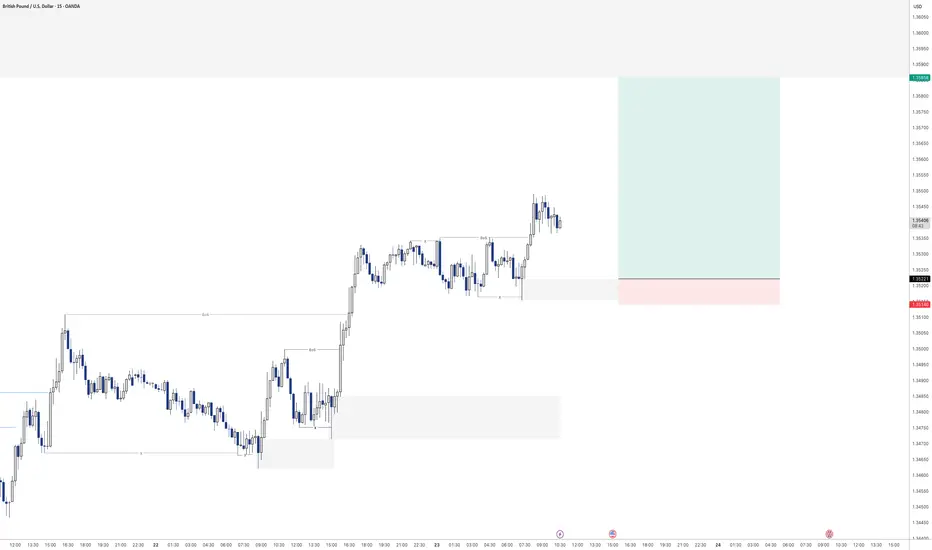
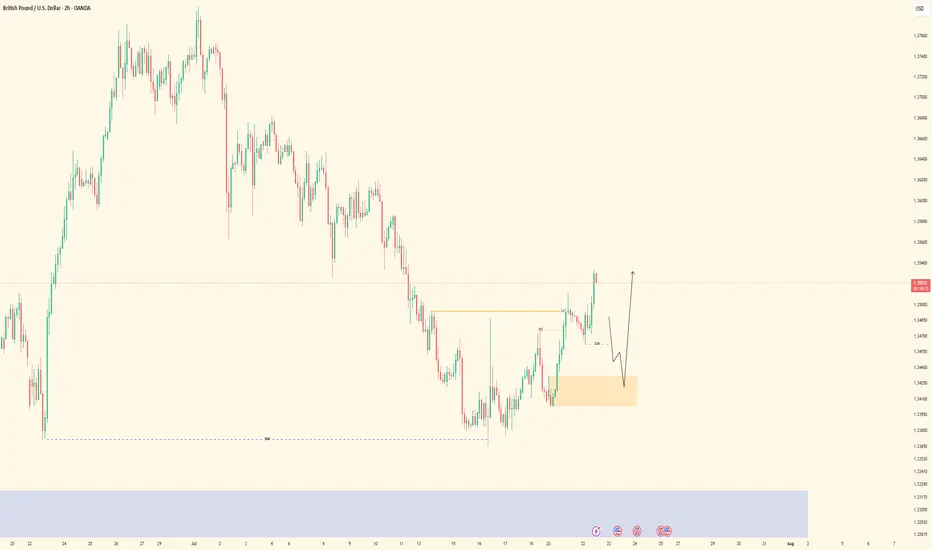
GBPUSD| Bullish Structure Intact - Waiting on BSL SweepPair: GBPUSD
Bias: Bullish
Been following price closely while staying in analysis mode — no rush.
Recent structure remains intact and aligned to the upside. Now waiting for a clean BSL sweep to clear liquidity before looking for LTF confirmations to engage in buys.
Momentum is there, structure is clean — I just need price to do its part.
Staying patient. Still in sync.
#GBPUSD #SMC #bullishstructure #orderflow #inducementking #smartmoneytrader
Bless Trading!
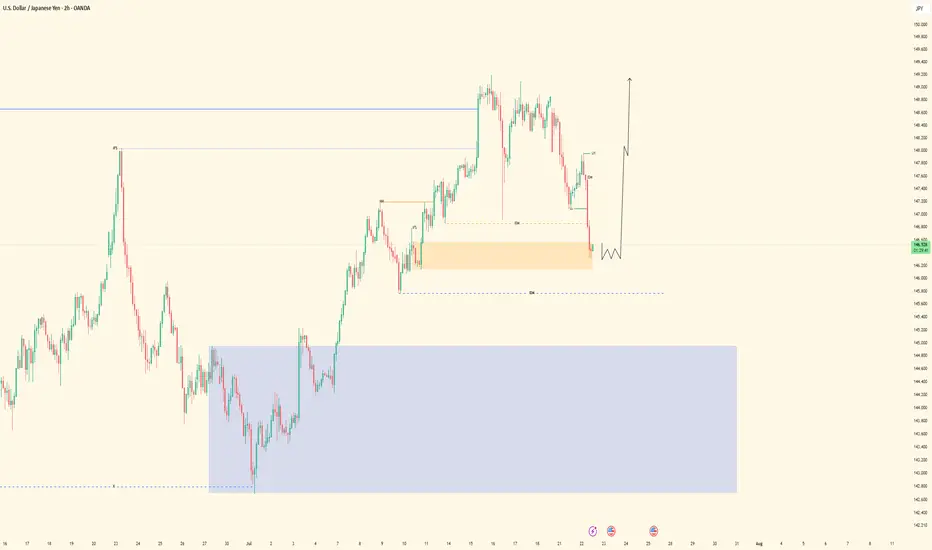
USDJPY| Bullish Bias - Mitigated OB, Waiting for LTF ConfirmsPair: USDJPY
Bias: Bullish
Price swept deeper liquidity and has now mitigated a key 30M bullish order block.
From the 2H bird’s eye view, structure is still aligned to the upside — but I remain in analysis mode until LTF confirms the shift.
No need to force anything — price is doing its job, and I’m waiting for it to speak clearly through confirmation.
Bullish structure still in play, but we wait for the perfect moment.
#USDJPY #SMC #bullishbias #orderblock #structuretrader #inducementking
Bless Trading!
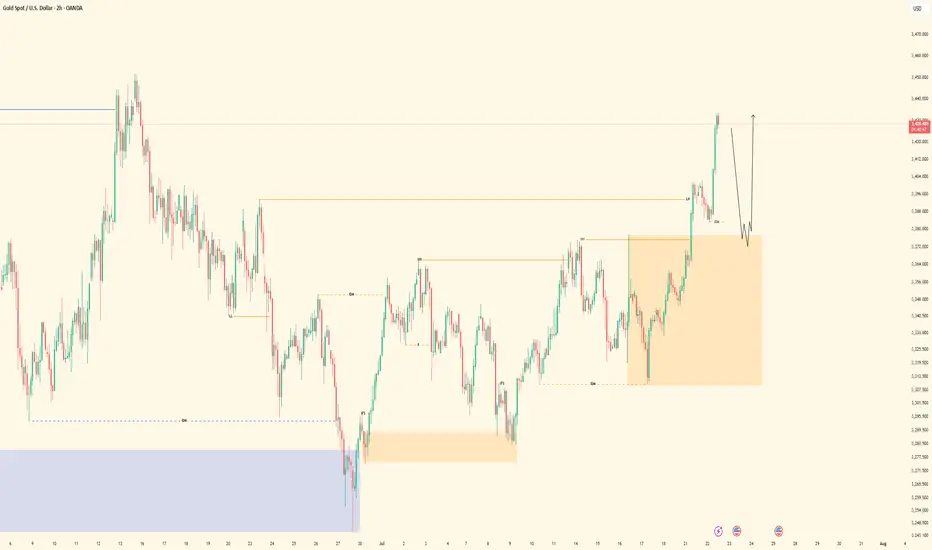
XAUUSD| Still Bullish - Waiting on BSL Sweep for EntryPair: XAUUSD
Bias: Bullish
Price remains bullish and structurally intact. This morning’s updated view confirms the bullish alignment — no change in directional bias.
Currently watching for a clean BSL sweep to clear out early liquidity, followed by LTF confirmations before engaging.
Higher time frame perspective from the 2H chart offers a solid bird’s eye view — staying patient and letting price come to me.
No rush — structure is king.
#XAUUSD #gold #smartmoney #SMC #orderblocks #inducementking #structurefirst
Bless Trading!
2 Possible Scalps for BITCOINThere are 2 Demand areas which have specified on the chart,
Both could be good for some scalps.
As long as price keeps 116.400 area UpTrend is on the card.
