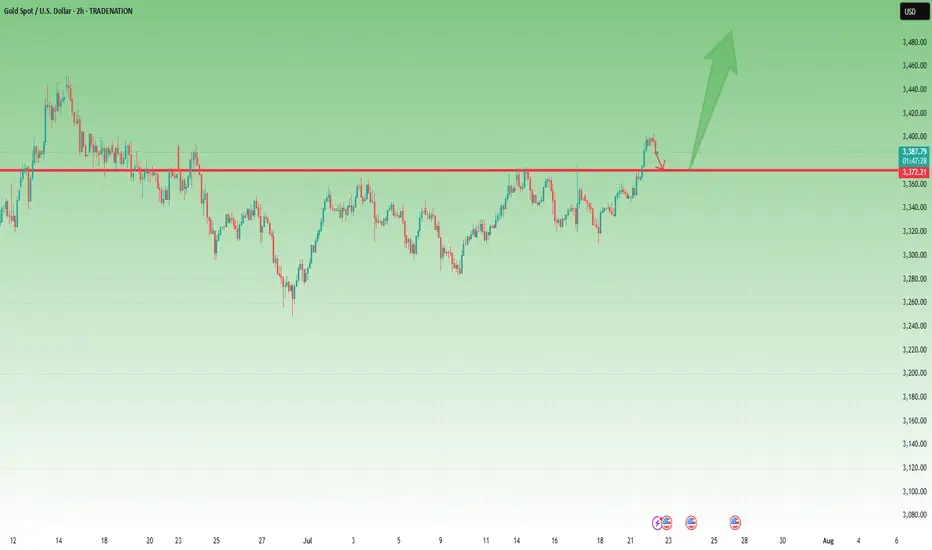
Gold - Above 3370 Is Bullish Territory – But 3360 Must Hold📆 What happened yesterday?
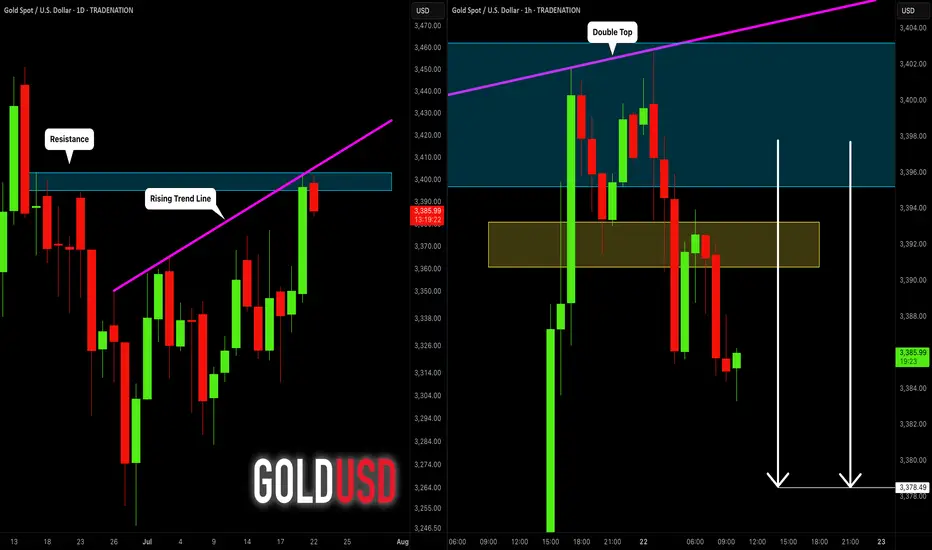
After more than a week of frustrating, sideways price action, Gold finally broke out above the key 3370 resistance zone.
The breakout was clean and impulsive, with TRADENATION:XAUUSD pushing to an intraday high around 3400.
Following that move, price printed a small double top near the high and began a modest correction — perfectly normal after such a breakout. At the time of writing, Gold trades at 3385, still holding above former resistance.
📈 Why this breakout matters:
The daily close at 3396 came in strong and near the top, leaving behind a clear Marubozu candle
This kind of price action signals conviction and momentum
The breakout confirms what I’ve been anticipating for days — the range is resolved, and the market is choosing the bullish path
🎯 What to expect next:
If price stabilizes above 3400, the road to 3450 opens — which is the target mentioned in my previous analyses
That area represents the next major resistance and likely magnet for price if bulls stay in control
🧭 Trading Plan:
For me, the plan is now simple:
✅ Buy the dips — especially on a potential retest of the 3370–3375 broken resistance, which now turns into support
❌ Negation comes only with a daily close below 3360, which would invalidate this breakout and raise questions
📌 Conclusion:
The breakout has finally come. After days of coiling, Gold chose the upside.
Momentum is building, structure is clean, and bulls are back in control — unless 3360 fails.
Until then, I remain bullish, looking to buy dips into strength. 🚀
Disclosure: I am part of TradeNation's Influencer program and receive a monthly fee for using their TradingView charts in my analyses and educational articles.
Multiple Time Frame Analysis
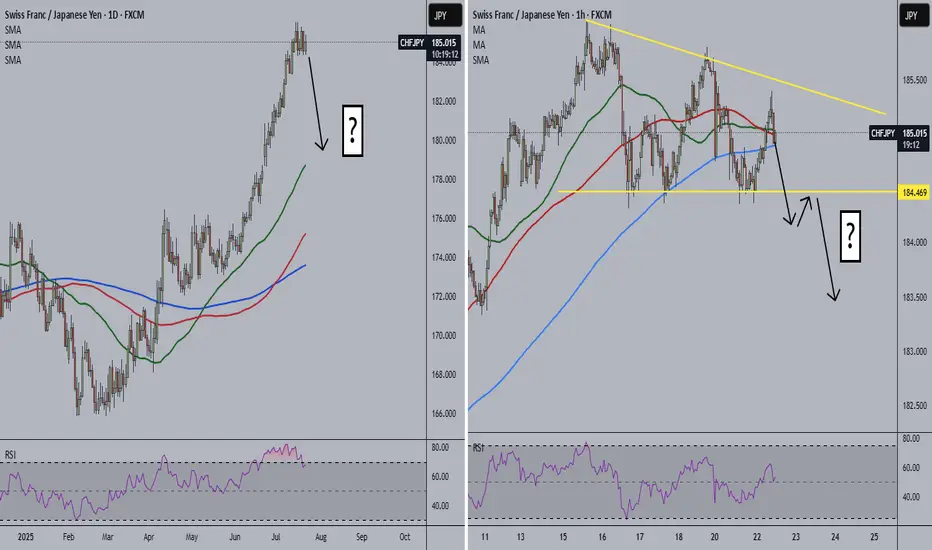
CHFJPY Alert!
🚨 CHFJPY Alert 🚨
Don't catch a falling knife... 🔪 However, price always returns to moving averages, and CHFJPY could be starting its descent.
Personally, I think price may form one last bullish move up and then come crashing down. However, the 1-hour is forming a descending triangle. A break below the triangle could be the start of the daily retracement.
Thoughts?
CMCMARKETS:CHFJPY
LONG ON USOIL OIL has just completed a sweep of sell side liquidity, leaving behind lots of BUY side liquidity.
DXY is falling on top of economic news stating trump will possibly fire Jerome Powell.
All this with OPEC increase oil production.
I expect oil to make a $5-$10 move throughout the rest of the week.
That's 500-1000 pips!

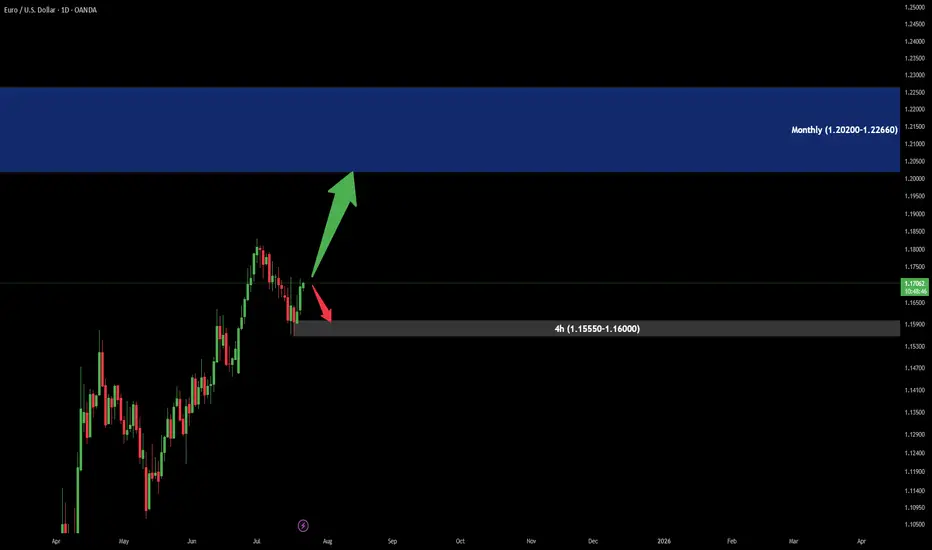
EuroUsd Analysis in MidtermTrend is UP!
As we can see there is a Supply area in monthly Time Frame around (1.20200-1.22660).
Price should have a good reaction there.
In lower Time Frame there is Demand area (in 4hour), which could be a good Buy position.
GOLD (XAUUSD): Bearish Move From Resistance Confirmed
Gold tested a significant confluence cluster on a daily time frame
that is based on a rising trend line and a horizontal resistance.
A double top formation on that on an hourly time frame indicates
a highly probable retracement from that.
Goal - 3378.5
❤️Please, support my work with like, thank you!❤️
I am part of Trade Nation's Influencer program and receive a monthly fee for using their TradingView charts in my analysis.

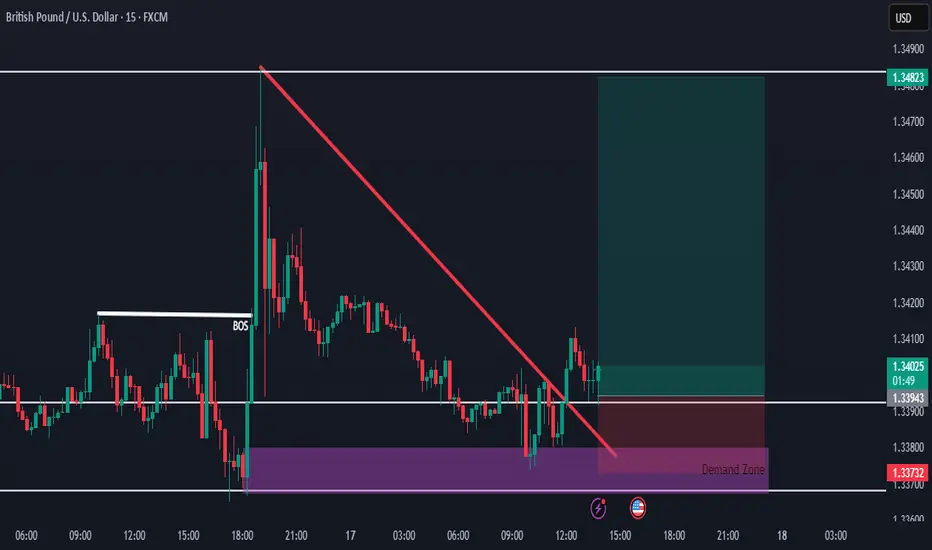
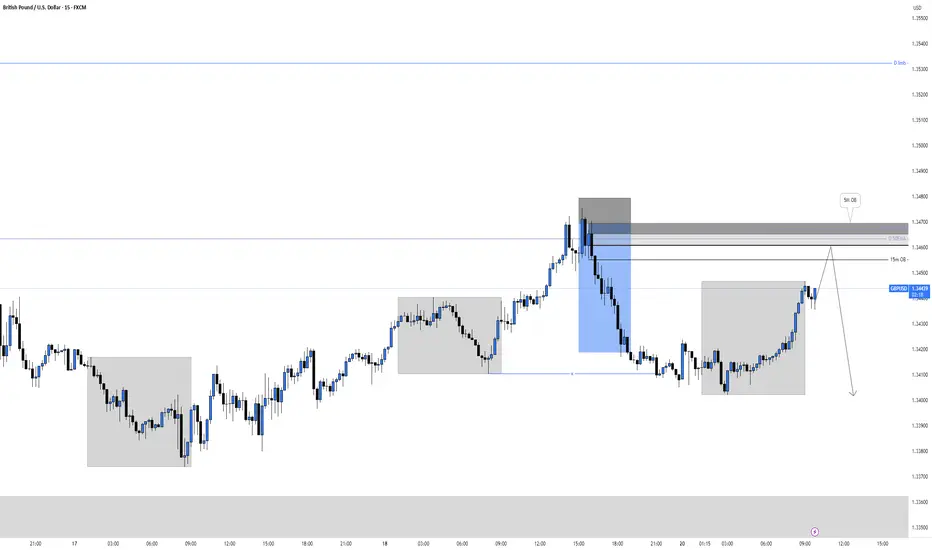
GBPUSD Short, 21 JulyShort-Term Bearish Bias Despite HTF OB
Even though we sit at a Daily Orderblock (Buy), LTF structure remains bearish, and price respects both D/4H EMA.
📉 Confluence:
Multiple Asia lows unfilled
Clear snap of recent lows
Gap on DXY still open
DXY lacks perfect structure but aligns with 4H EMA and gaps = possible short-term drop
On GU 15m Extreme OB in play
🎯 Entry: Waiting for 1m BOS to confirm sellers stepping in
🛡️ SL: Slight risk, can’t fully cover highs with a 10 pip stop
📌 TP: Focused on completing Asia lows with 1:3 RR target minimum
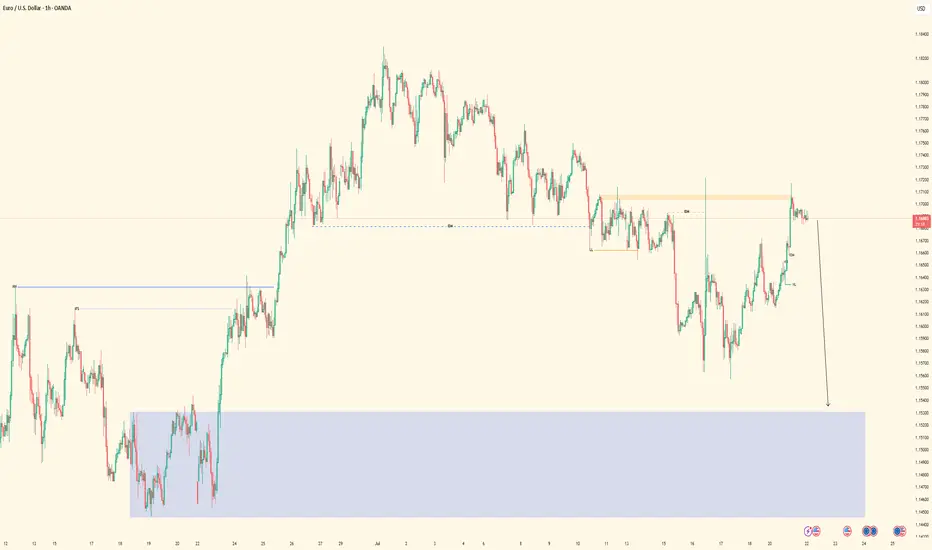
EURUSD - Sell Setup in ProgressPair: EURUSD
Bias: Bearish
HTF Overview: Structure leaning bearish — price respecting recent lower highs with room to fall into deeper 4H demand.
Current Zone: Price just mitigated the 30M sell-side OB, showing early signs of reaction.
LTF Confirmation: Still in observation mode — waiting for 5M or 1M confirmation to trigger short entries with confidence.
Entry Zone: Focused on refined LTF shift beneath the 30M OB — ideal setup includes inducement or liquidity run before executing.
Targets: First target is intraday low — ultimate target is the strong 4H demand zone below.
Mindset Note: Let the market bring the entry to you — don’t jump ahead of confirmation. Smart patience wins.
Bless Trading!
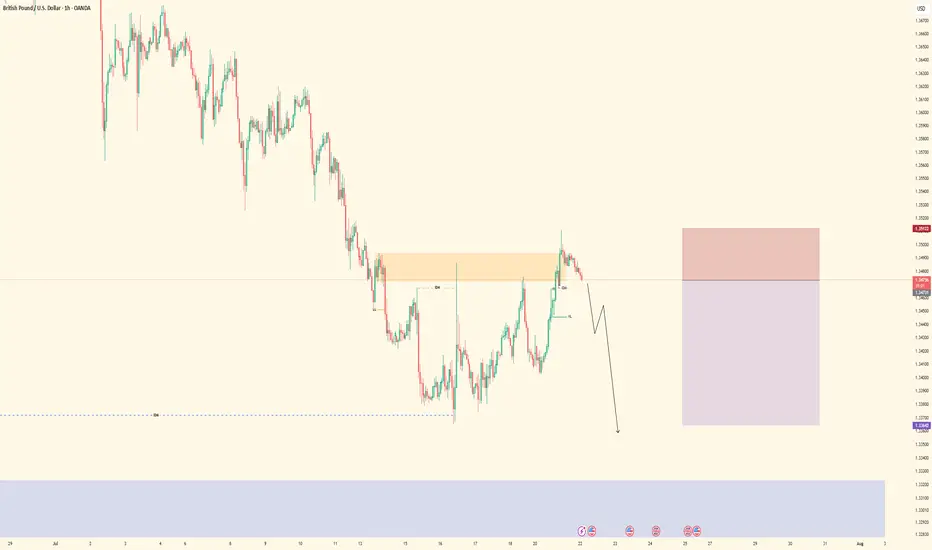
GBPUSD| - Bearish Play Setting UpPair: GBPUSD (GU)
Bias: Bearish
HTF Overview: Bearish structure intact — market has been respecting lower highs and pushing into downside pressure.
Current Zone: Price just mitigated the 30M OB, reacting as expected within the supply zone.
LTF Confirmation: Now waiting for clean confirmations on 5M or 1M — not in trader mode yet, analysis still in control.
Entry Zone: Watching for internal liquidity sweep or inducement followed by structure shift to confirm the sell.
Targets: First target is the next 30M low — extended target based on 1H continuation.
Mindset Note: No chasing — let the LTF tell the story before pulling the trigger. Control the urge, trust the system.
Bless Trading!
AAVE IDEA JUL/18/25Let’s try another one over the weekend.
We’re aiming for that LQ on the HTF, but we’ll catch some partials along the way

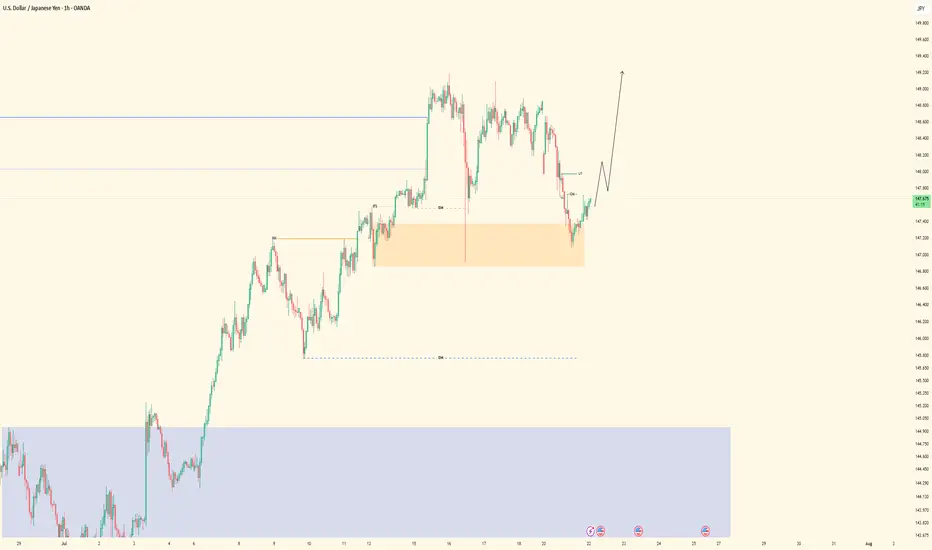
USDJPY - Bullish Bias, In OB ZonePair: USDJPY (UJ)
Bias: Bullish
HTF Overview: Bullish structure remains intact — price currently pushing upward, respecting higher timeframe flow.
Current Zone: Price is now sitting within the 30M OB, showing potential strength but no LTF confirmation yet.
LTF Confirmation: Still in analysis mode — sitting on hands, waiting for clean reaction on 5M or 1M before considering entries.
Entry Zone: 30M OB being monitored closely — ideal setup would include inducement and clear shift before entry.
Targets: Next 1H high remains the first target — extended targets to be trailed if momentum builds.
Mindset Note: Analysis first, execution second. Discipline is the edge — no rush until LTF gives the green light.
Bless Trading!
XAUUSD - Bullish Bias Holding StrongPair: XAUUSD (Gold)
Bias: Bullish
HTF Overview: Multi-timeframe structure aligned bullish. Market is in a clear uptrend across 4H and 1H, currently retracing toward key OB levels.
LTF Confirmation: Waiting on price to mitigate the 1H OB — once tapped, will drop to 15M and 5M for confirmation before any entries.
Entry Zone: 1H OB marked — setup strengthens if inducement or liquidity sweep occurs just before mitigation.
Targets: Short-term target is the previous high — extended target based on 4H continuation range.
Mindset Note: Alignment is there — now it’s about patience and waiting for execution clarity. Let price deliver the opportunity.
Bless Trading!

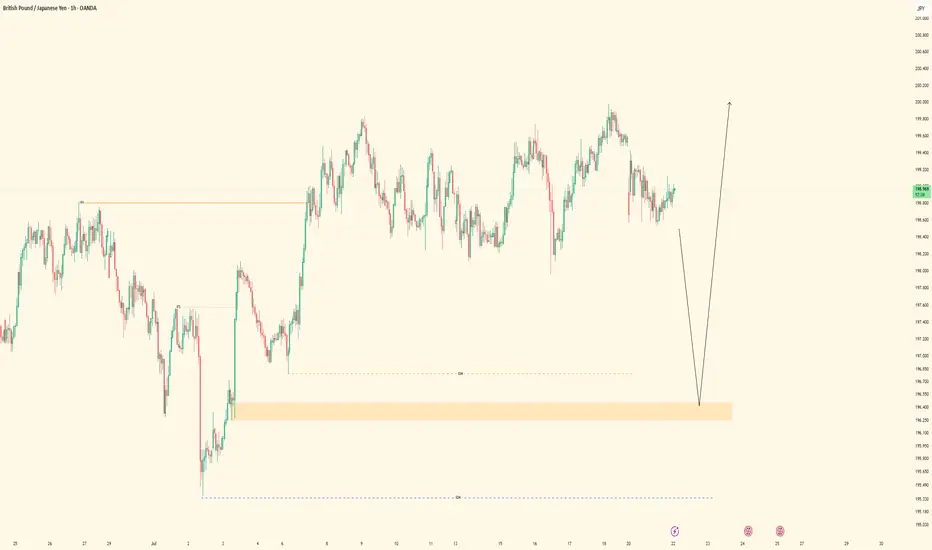
GBPJPY| - Bullish Opportunity DevelopingPair: GBPJPY (GJ)
Bias: Bullish
HTF Overview: 1H structure remains bullish with clear higher highs. Market currently pulling back toward a visible 1H Order Block.
LTF Confirmation: Waiting for price to mitigate the 1H OB, then will drop to 15M and 5M for bullish confirmation before entering.
Entry Zone: OB zone marked and active — ideal setup includes liquidity grab or inducement before confirming entry shift.
Targets: First target is recent 1H high — extended targets based on continuation structure above.
Mindset Note: No need to force the trade — the edge comes after the zone is respected and price confirms. Let the setup come to you.
Bless Trading!
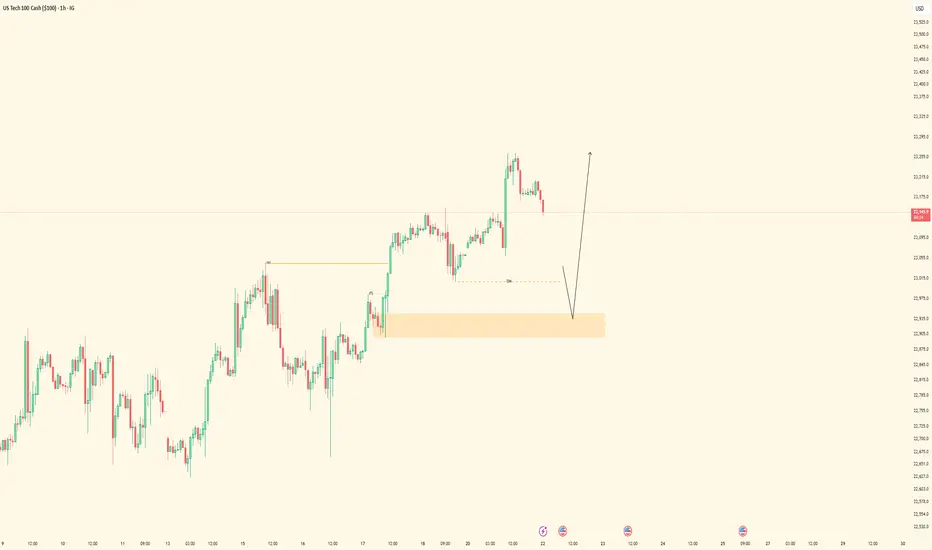
NAS100 - Bullish Setup BuildingPair: NASDAQ (NAS100)
Bias: Bullish
HTF Overview: 1H structure holding bullish after recent break of internal highs. Price pulling back toward a key demand zone.
LTF Confirmation: Waiting for price to mitigate the 1H Order Block, then drop to lower timeframes (15M → 5M) for confirmation entries.
Entry Zone: Watching for bullish reaction within OB, ideally paired with inducement or liquidity sweep before shift.
Targets: Short-term target is the next 1H high — extended targets align with overall bullish momentum continuation.
Mindset Note: Patience over prediction. Let price tap into the zone and confirm — don’t chase, just position smart.
Bless Trading!
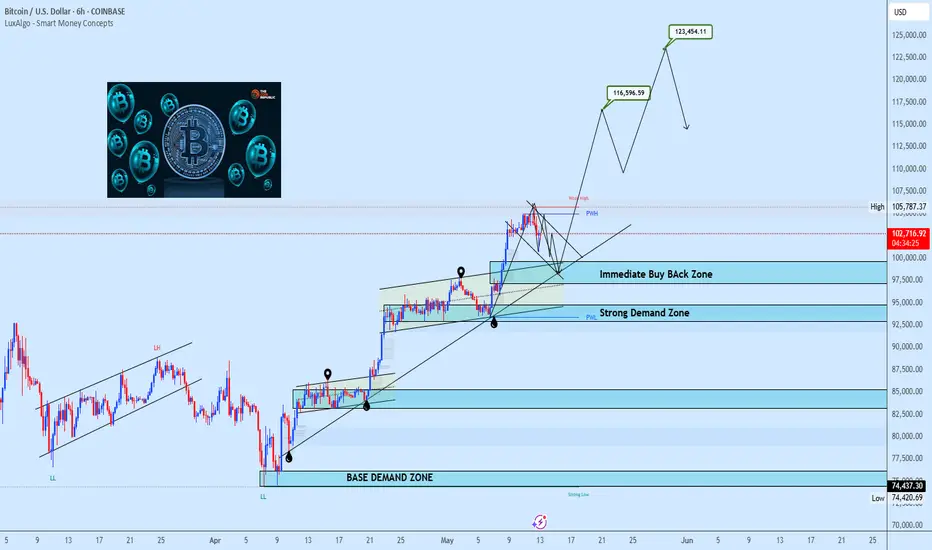
BTC Bulls Defend Key Zone Eyes on $123K Breakout ExtensionBitcoin has successfully completed a breakout above the prior weekly high structure, followed by a healthy pullback which is currently unfolding into a bullish pennant formation. The key highlight is how price is retesting the neckline zone with precision, which now doubles as a strong immediate buyback zone.
The reaction from this level is already showing strong bullish momentum, with price gearing up to challenge the previous ATH. A breakout above that resistance should unlock the path toward the projected $116.5k and $123.4k targets as shown on the chart. Failure to hold the Immediate Buyback Zone opens the door toward the Strong Demand Zone, which remains a valid re-accumulation point within this bullish cycle.
Stay sharp. The structure remains intact unless the neckline fails decisively.
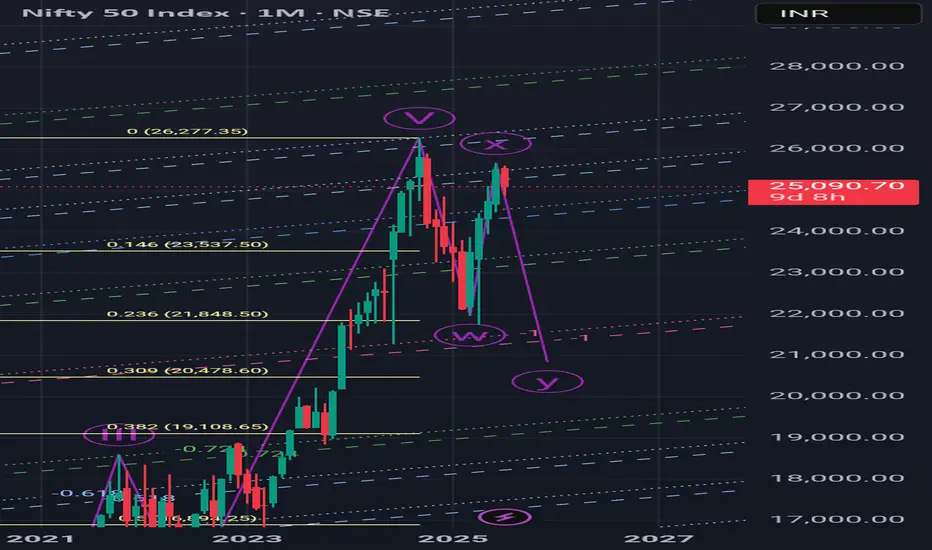
Nifty 20500 or 19200?Last time, I was correct when I foresaw and gave an update on the Nifty's latest peak of 25650 the day before it happened, along with the beginning of a potential downward trend. Now, if the Nifty can break below 24500, there's a good chance we'll drop below the previous low of 21700 and reach at least 20500 or even lower, at 19200, by February 2026.
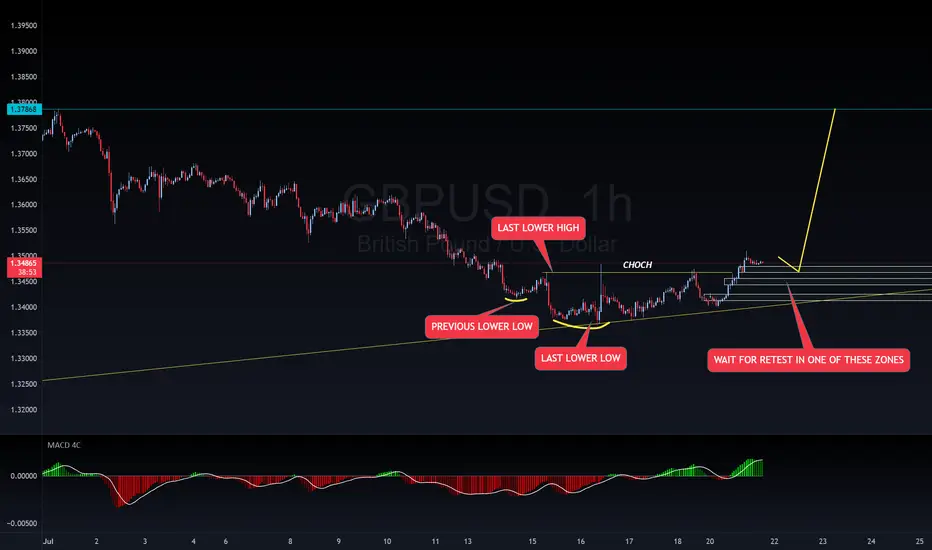
BUY SETUP FOR GBPUSDGU is on an overall uptrend with a daily retest. When I went down to a lower timeframe from the daily retest, I found the sequenced that caused a CHOCH. Wait for retest in one of those zones before buying to my blue line. If price breaks and closes below the last lower low, that will potentially cause a continuation to the downside.
Properly navigating this ATH run in NASDAQ - No supply yetEverything is explained quickly in the video.
Main points:
1) Lows and bullish imbalances respected
2) It's very difficult to short without supply
3) May get cyclical take profit like previous years
Be sure to let me know what you think!

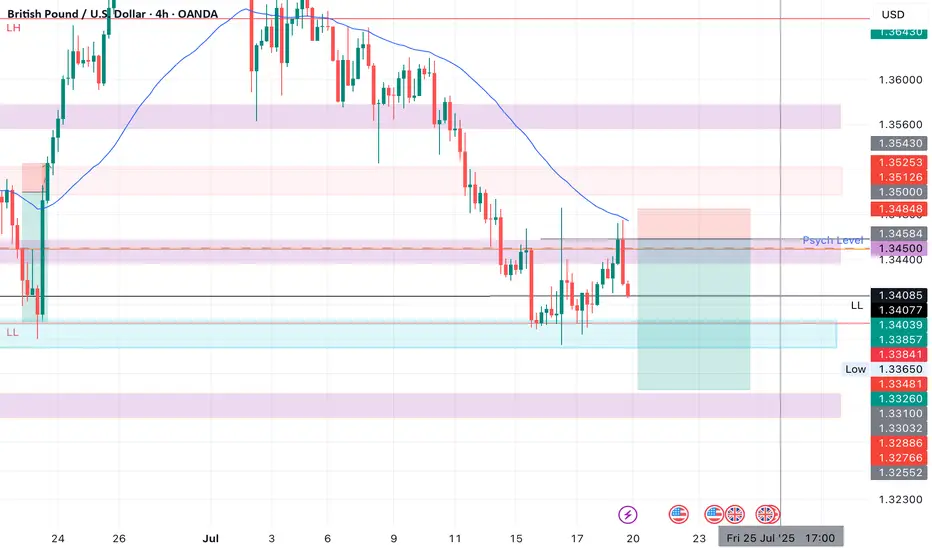
GBPUSD SHORTMarket structure bearishh on HTFs 3
Entry at both Weekly and Daily AOi
Weekly Rejection at AOi
Previous Weekly Structure Point
Daily Rejection at AOi
Daily EMA retest
Around Psychological Level 1.34500
H4 EMA retest
H4 Candlestick rejection
Rejection from Previous structure
Levels 5.02
Entry 115%
REMEMBER : Trading is a Game Of Probability
: Manage Your Risk
: Be Patient
: Every Moment Is Unique
: Rinse, Wash, Repeat!
: Christ is King.
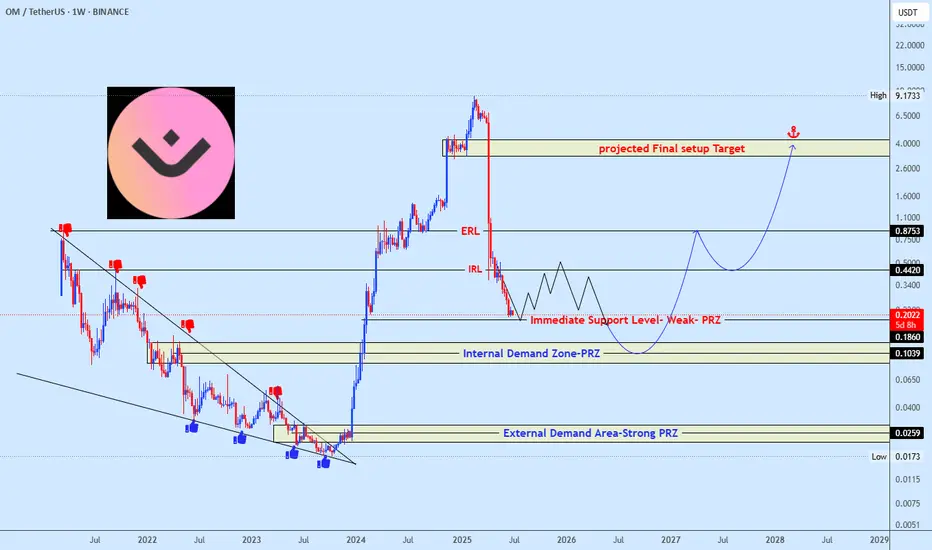
OMUSDT Approaching Demand ZonesOMUSDT has seen a sharp decline from its peak and is now approaching key demand zones. Price is reacting around a weak support level, with further downside likely toward the Internal PRZ (around $0.1039) and at this zone major reversal should happen unless if unexpected happen then the next area to keep an eye on is the External Strong PRZ (near $0.0259) which is mostly unlikely.
A strong bullish structure could form from these zones, targeting a long-term recovery toward $0.44, $0.87, and ultimately the $4.00 which serves as projected final setup target zone.
Watch price behavior closely at these levels for early signs of reversal.
We spotted the previous falling wedge setup accurately and this time will not be difference, make sure not to miss the opportunity when the price reaches the projected zone.
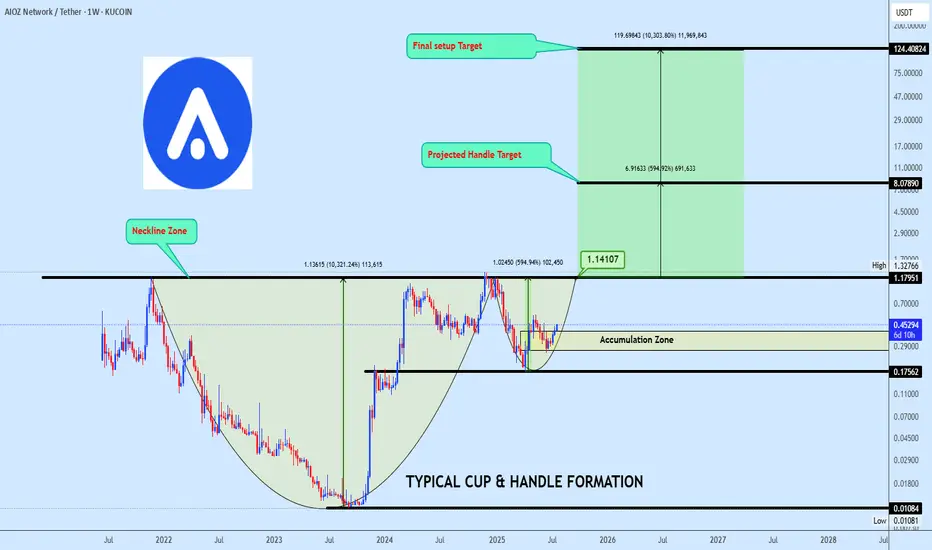
Aiozusdt trade opportunityAIOZUSDT is shaping a potential cup and handle pattern, with price nearing the neckline. A confirmed breakout above this level will validate the bullish setup and trigger momentum towards the projected targets.
EURNZD ENTRY CHARTOn this Pair, we are BEARISH, the Trend is still BEARISH, the NEW ZEALAND DOLLAR is beginning to gain STRENGTH, the DAILY open gave us a Confluence with the H4 tf giving us a SELL FORMATION, on the H1, we got our Structure area, with a LTF entry confirmation + Inducement, So if this matches with your Trade Idea, you can look to join US, and Apply a Good risk Management.We will give Update in the UPDATE SECTION THANK YOU.

GBPUSD Buy Setup from Strong Demand ZoneHello everybody!
Price is in a higher timeframe demand zone, which is very strong and a good place to buy.
We were waiting patiently for confirmation, and now we have two key signals:
1- After a break of structure in the market, a small demand zone has formed.
2- The break of the downward trendline is where we entered the buy position.