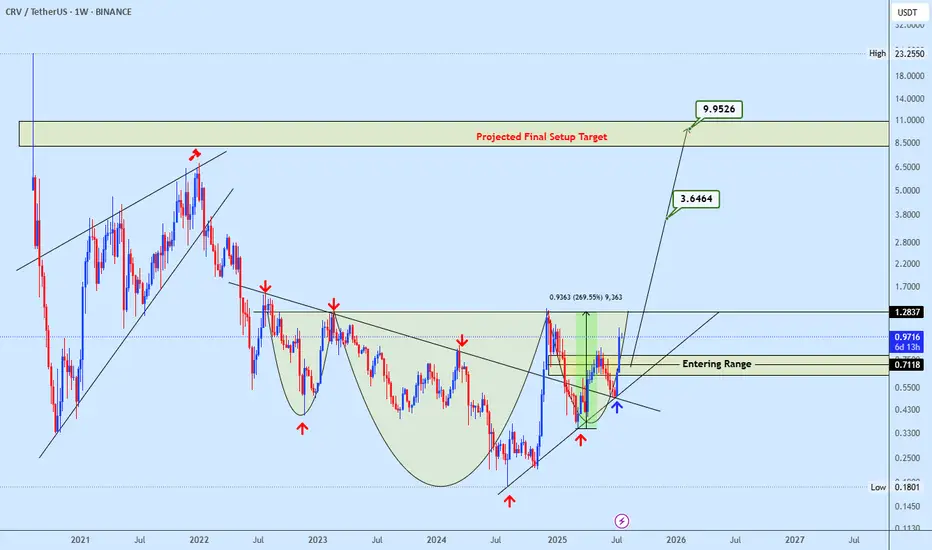
Crvusdt buy opportunityCRVUSDT is forming a potential inverse head and shoulders pattern, with price approaching the neckline zone. The marked entry range offers a strategic buy opportunity for early positioning. A confirmed breakout above the neckline would signal strong bullish continuation, with the final target outlined on the chart. Let us know your thoughts on CRV.
Multiple Time Frame Analysis
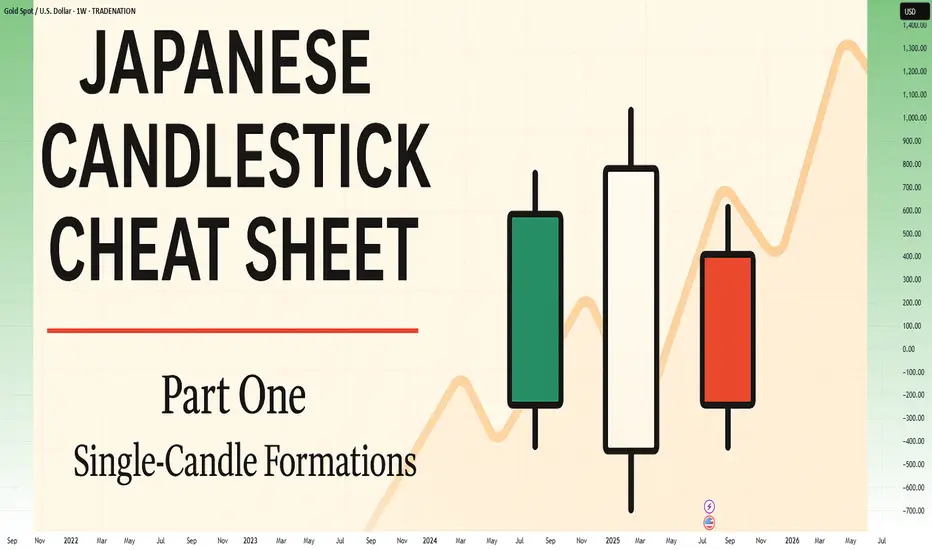
Japanese Candlestick Cheat Sheet – Part OneSingle-Candle Formations That Speak
Before you dream of profits, learn the one language that never lies: price.
Indicators are just subtitles — price is the voice.
Japanese candlesticks are more than just red and green bars — they reflect emotion, pressure, and intention within the market.
This series will walk you through the real psychology behind candlestick patterns — starting here, with the most essential:
🕯️ Single-candle formations — the quiet signals that often appear before big moves happen.
If you can’t read a doji, you’re not ready to understand the market’s hesitation.
If you ignore a hammer, you’ll miss the moment sentiment shifts.
Let’s start simple. Let’s start strong.
This is Part One of a five-part series designed to build your candlestick fluency from the ground up.
1. DOJI
Bias: Neutral
What is the Doji pattern?
The Doji candlestick pattern forms when a candle’s open and close prices are nearly identical, resulting in a small or nonexistent body with wicks on both sides. This pattern reflects market equilibrium, where neither buyers nor sellers dominate. Dojis often appear at trend ends, signaling potential reversals or pauses.
As a fundamental tool in technical analysis, Dojis help traders gauge the psychological battle between buyers and sellers. Proper interpretation requires context and experience, especially for spotting trend shifts.
Meaning:
Indicates market indecision or balance. Found during trends and may signal a reversal or continuation based on context.
LONG-LEGGED DOJI
Bias: Neutral
What is the Long-Legged Doji pattern?
The Long-Legged Doji captures a moment of intense uncertainty and volatility in the market. Its long wicks represent significant movement on both sides, suggesting that neither buyers nor sellers have control. This back-and-forth reflects the psychology of market participants wrestling for control, which often foreshadows a shift in sentiment. When traders see a Long-Legged Doji, it highlights the need to monitor for potential changes in direction.
They can appear within trends, at potential reversal points, or at consolidation zones. When they form at the end of an uptrend or downtrend, they often signal that the current trend may be losing momentum.
Meaning:
The prominent wicks indicate volatility. Buyers and sellers pushed prices in opposite directions throughout the session, ultimately reaching an indecisive close.
SPINNING TOP
Bias: Neutral
What is the Spinning Top pattern?
A Spinning Top is a candlestick with a small body and long upper and lower wicks, indicating that the market has fluctuated significantly but ultimately closed near its opening price. This pattern often points to a moment of indecision, where both buyers and sellers are active but neither dominates. Spinning Tops are commonly found within both uptrends and downtrends and can suggest that a trend is losing momentum.
For traders, a Spinning Top provides a valuable insight into market psychology, as it hints that the prevailing sentiment may be weakening. While Spinning Tops alone aren’t always definitive, they can serve as a precursor to larger moves if the following candles confirm a shift in sentiment.
Meaning:
Shows indecision between buyers and sellers. Common in both up and downtrends; signals potential reversal or pause.
HAMMER
Bias: Bullish
What is the Hammer pattern?
A Hammer candlestick appears at the end of a downtrend, with a small body and a long lower wick. This shape reflects a moment when sellers pushed prices lower, but buyers managed to absorb the selling pressure and drive prices back up before the close. This pattern is particularly important for spotting potential reversals, as it indicates that buyers are beginning to reassert control.
Hammers reveal the underlying psychology of a market where buying confidence is emerging, even if sellers have dominated for a while. To successfully trade this pattern, it’s essential to confirm the reversal with subsequent candles.
Meaning:
Showing rejection of lower prices. Signals potential bullish reversal, especially if followed by strong buying candles.
INVERTED HAMMER
Bias: Bullish
What is the Inverted Hammer pattern?
The Inverted Hammer forms at the bottom of a downtrend, with a small body and long upper wick. This pattern shows that buyers attempted to push prices higher, but sellers ultimately brought them back down by the close. The Inverted Hammer is an early sign of buyer interest, hinting that a trend reversal may be underway if subsequent candles confirm the shift.
Interpreting the Inverted Hammer helps traders understand where sentiment may be shifting from bearish to bullish, often marking the beginning of a recovery. Recognizing these patterns takes practice and familiarity with market conditions.
Meaning:
Showing rejection of higher prices. Can signal bullish reversal if confirmed by subsequent buying pressure.
DRAGONFLY DOJI
Bias: Bullish
What is the Dragonfly Doji pattern?
The Dragonfly Doji has a long lower wick and no upper wick, forming in downtrends to signal potential bullish reversal. This pattern reveals that sellers were initially in control, pushing prices lower, but buyers stepped in to push prices back up to the opening level. The Dragonfly Doji’s unique shape signifies that strong buying support exists at the lower price level, hinting at an impending reversal.
Recognizing the psychology behind a Dragonfly Doji can enhance a trader’s ability to anticipate trend changes, especially in markets where support levels are being tested.
Meaning:
Found in downtrends; suggests possible bullish reversal if confirmed by a strong upward move.
BULLISH MARUBOZU
Bias: Bullish
What is the Bullish Marubozu pattern?
The Bullish Marubozu is a large, solid candle with no wicks, indicating that buyers were in complete control throughout the session. This pattern appears in uptrends, where it signals strong buying momentum and often foreshadows continued upward movement. The absence of wicks reveals that prices consistently moved higher, with little resistance from sellers.
For traders, the Bullish Marubozu offers a glimpse into market psychology, highlighting moments when buyer sentiment is particularly strong. Learning to identify these periods of intense momentum is crucial for trading success.
Meaning:
Showing complete buying control. Found in uptrends or at reversal points; indicates strong buying pressure and likely continuation of the trend.
SHOOTING STAR
Bias: Bearish
What is the Shooting Star pattern?
The Shooting Star appears at the top of an uptrend, characterized by a small body and a long upper wick, indicating a potential bearish reversal. Buyers initially drove prices higher, but sellers took over, bringing prices back down near the open. This shift suggests that buyers may be losing control, and a reversal could be imminent.
Interpreting the Shooting Star gives traders valuable insights into moments when optimism begins to fade, providing clues about a potential trend shift.
Meaning:
Indicating rejection of higher prices. Signals a potential bearish reversal if followed by selling pressure.
HANGING MAN
Bias: Bearish
W hat is the Hanging Man pattern?
The Hanging Man candle forms at the top of an uptrend, with a small body and long lower wick. This pattern suggests that sellers attempted to drive prices down, but buyers regained control. However, the presence of a long lower shadow hints that sellers may be gaining strength, potentially signaling a bearish reversal.
The Hanging Man pattern reflects market psychology where buyers might be overextended, making it a valuable tool for identifying potential tops in trends.
Meaning:
Signals potential bearish reversal if confirmed by selling candles afterward.
GRAVESTONE DOJI
Bias: Bearish
What is the Gravestone Doji pattern?
With a long upper wick and no lower wick, the Gravestone Doji reveals that buyers pushed prices up, but sellers eventually regained control. Found in uptrends, it suggests that a bearish reversal could be near, as the upper shadow indicates buyer exhaustion. The Gravestone Doji often appears at market tops, making it a valuable indicator for those looking to anticipate shifts.
Understanding the psychology behind this pattern helps traders make informed decisions, especially in markets prone to overbought conditions.
Meaning:
Showing rejection of higher prices. Found in uptrends; signals potential bearish reversal if followed by selling activity.
BEARISH MARUBOZU
Bias: Bearish
What is the Bearish Marubozu pattern?
The Bearish Marubozu is a large, solid bearish candle without wicks, showing that sellers held control throughout the session. Found in downtrends, it signals strong bearish sentiment and suggests that the trend is likely to continue. The lack of wicks reflects consistent downward momentum without significant buyer support.
This pattern speaks about market psychology, offering traders insights into moments of intense selling pressure. Recognizing the Bearish Marubozu can help you align with prevailing trends and avoid buying into weakening markets
Meaning:
Showing strong selling pressure. Found in downtrends; signals continuation of the bearish trend or an intensifying sell-off.
👉 Up next: Double-candle formations – where price meets reaction.
DAX / GER40: Double Long tradeGood morning traders,
I just received an alert from my LuBot Ultimate indicator of a Long signal on a good uptrend structure.
From the weekly chart I see that we are surfing on the wave of the second swing after the last bearish retracement, however on the daily the first swing has just begun after a slight minimum made in the last few days.
On the 4H this opportunity presents itself which I take advantage of in a doubly way, that is:
-I insert a trade on correction with stop at the level suggested by the indicator and TP to be defined based on the trend.
-I insert a second trade, again on correction, but with stop below the latest lows and take profit on the latest highs, the invested capital is much lower in this case in order to contain the loss but optimize any profit.
👍 If you want to see other similar posts, like/boost
🙋♂️ Remember to follow me so you don't miss my future analyses
⚠️ Disclaimer: This post is for informational purposes only and does not constitute financial advice. Always do your research before making investment decisions.
AMEX:EWG BMFBOVESPA:DAX1! FPMARKETS:GER40 PEPPERSTONE:GER40 ACTIVTRADES:GER40 XETR:DAX

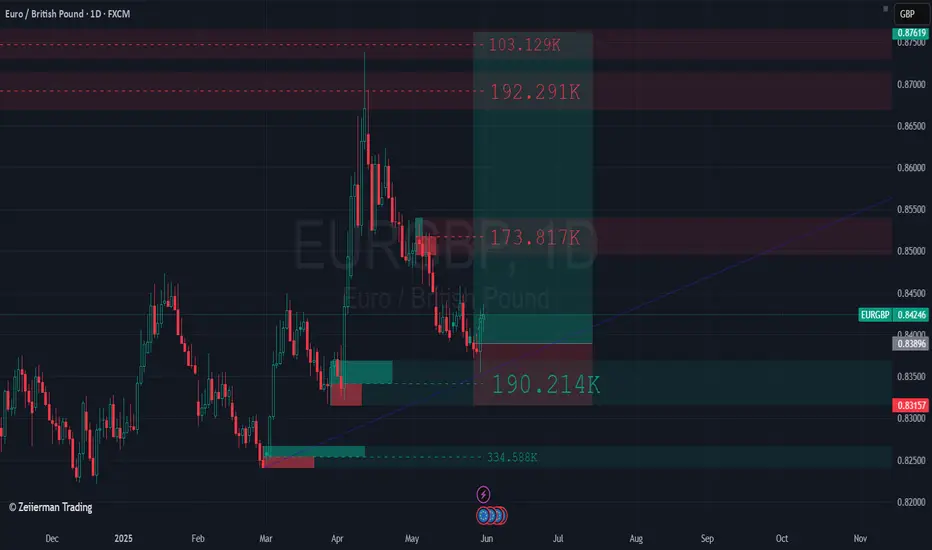
I'm currently long on EUR/GBPPrice is currently reacting to a retest of an order block located within the discount zone, following a Shift in Market Structure (SMS).
Additionally, on the weekly timeframe, price is also positioned in the discount zone, aligning with a weekly order block at the same level.
Disclaimer: This is not financial advice—just my personal analysis.
Bitcoin - Will Bitcoin reach its previous ATH?!Bitcoin is above the EMA50 and EMA200 on the four-hour timeframe and is in its ascending channel. Bitcoin’s current upward momentum has the potential to reach its previous ATH. If it corrects, we can look for Bitcoin buying positions from the specified support area, which is also at the intersection of the bottom of the ascending channel.
If this support is lost, the decline will continue to around $113,000, where we can again buy Bitcoin with a better risk-reward ratio.
It should be noted that there is a possibility of heavy fluctuations and shadows due to the movement of whales in the market, and capital management in the cryptocurrency market will be more important. If the downward trend continues, we can buy within the demand area.
Last week, the U.S. House of Representatives passed the CLARITY Act (Crypto-Asset National Regulatory Transparency for Investors and Consumers Act) with 294 votes in favor and 134 against, including support from 78 Democrats. The bill represents the first comprehensive legislative effort to regulate the cryptocurrency industry and is considered a major regulatory win for digital asset proponents.
Key features of the legislation include:
• Clearly defining the regulatory roles of agencies like the SEC and CFTC
• Establishing a new category for registered digital assets
• Facilitating broader integration of cryptocurrencies into traditional financial systems
Status in the Senate: Despite bipartisan approval in the House, the bill’s future in the Senate remains uncertain. Senators are still in the early stages of drafting their own version, and significant revisions are expected. Some Senate Democrats insist that the bill must explicitly address President Trump’s and his family’s cryptocurrency holdings.
The CLARITY Act is part of a broader Republican-led legislative initiative dubbed “Crypto Week,” which includes two additional major digital asset bills aimed at modernizing blockchain regulation and the broader digital finance ecosystem.
Meanwhile, Donald Trump is preparing to issue an executive order that would open up U.S. retirement markets to cryptocurrencies, gold, and private equity. This order would allow 401(k) fund managers to incorporate alternative assets into retirement portfolios.
The move follows the rollback of Biden-era restrictions and the recent passage of three crypto-related bills in the House. While major investment firms have welcomed the proposal, critics warn that alternative assets may expose retail investors to greater financial risks.
Also last week, Bitcoin reached a new all-time high, pushing its market capitalization to $2.43 trillion. It has now surpassed Amazon, Google, and even silver, becoming the fifth-largest asset globally by market value.
Looking ahead, one of the key events on the economic calendar is Federal Reserve Chair Jerome Powell’s upcoming speech at an official central bank-hosted conference on Tuesday. This event comes just before the release of the preliminary S&P Global Purchasing Managers’ Indexes (PMIs) on Thursday. Given Trump’s escalating verbal attacks on Powell, a central question is whether this political pressure has influenced the Fed Chair’s stance.
Trump has repeatedly urged Powell to lower interest rates. This week, reports emerged suggesting that the President had discussed with some Republicans the possibility of removing Powell from his position. However, Trump was quick to downplay the reports, stating that the likelihood of Powell being dismissed was “very low.”
In this context, if Powell uses his speech to reassert the Fed’s independence and calls for patience to assess the impact of tariffs more thoroughly, the U.S. dollar may continue its recent upward trend. Still, it’s too early to confirm a definitive bullish reversal for the dollar. While the global reserve currency has responded positively to headlines fueling tariff concerns, markets could mirror April’s behavior—when fears of recession led investors to sell the dollar instead of buying it—should those concerns intensify again.

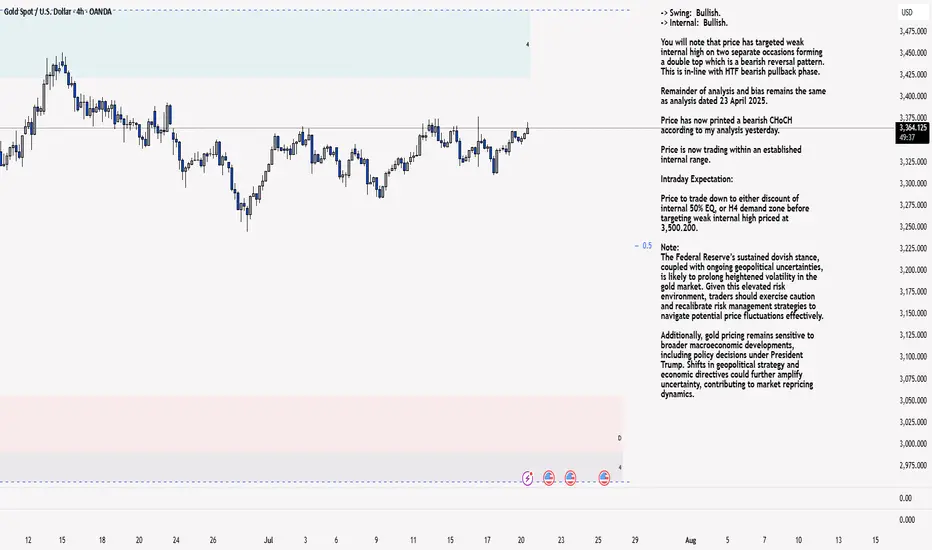
XAU/USD 21 July 2025 Intraday AnalysisH4 Analysis:
-> Swing: Bullish.
-> Internal: Bullish.
You will note that price has targeted weak internal high on two separate occasions forming a double top which is a bearish reversal pattern. This is in-line with HTF bearish pullback phase.
Remainder of analysis and bias remains the same as analysis dated 23 April 2025.
Price has now printed a bearish CHoCH according to my analysis yesterday.
Price is now trading within an established internal range.
Intraday Expectation:
Price to trade down to either discount of internal 50% EQ, or H4 demand zone before targeting weak internal high priced at 3,500.200.
Note:
The Federal Reserve’s sustained dovish stance, coupled with ongoing geopolitical uncertainties, is likely to prolong heightened volatility in the gold market. Given this elevated risk environment, traders should exercise caution and recalibrate risk management strategies to navigate potential price fluctuations effectively.
Additionally, gold pricing remains sensitive to broader macroeconomic developments, including policy decisions under President Trump. Shifts in geopolitical strategy and economic directives could further amplify uncertainty, contributing to market repricing dynamics.
H4 Chart:
M15 Analysis:
-> Swing: Bullish.
-> Internal: Bullish.
H4 Timeframe - Price has failed to target weak internal high, therefore, it would not be unrealistic if price printed a bearish iBOS.
The remainder of my analysis shall remain the same as analysis dated 13 June 2025, apart from target price.
As per my analysis dated 22 May 2025 whereby I mentioned price can be seen to be reacting at discount of 50% EQ on H4 timeframe, therefore, it is a viable alternative that price could potentially print a bullish iBOS on M15 timeframe despite internal structure being bearish.
Price has printed a bullish iBOS followed by a bearish CHoCH, which indicates, but does not confirm, bearish pullback phase initiation. I will however continue to monitor, with respect to depth of pullback.
Intraday Expectation:
Price to continue bearish, react at either M15 supply zone, or discount of 50% internal EQ before targeting weak internal high priced at 3,451.375.
Note:
Gold remains highly volatile amid the Federal Reserve's continued dovish stance, persistent and escalating geopolitical uncertainties. Traders should implement robust risk management strategies and remain vigilant, as price swings may become more pronounced in this elevated volatility environment.
Additionally, President Trump’s recent tariff announcements are expected to further amplify market turbulence, potentially triggering sharp price fluctuations and whipsaws.
M15 Chart:
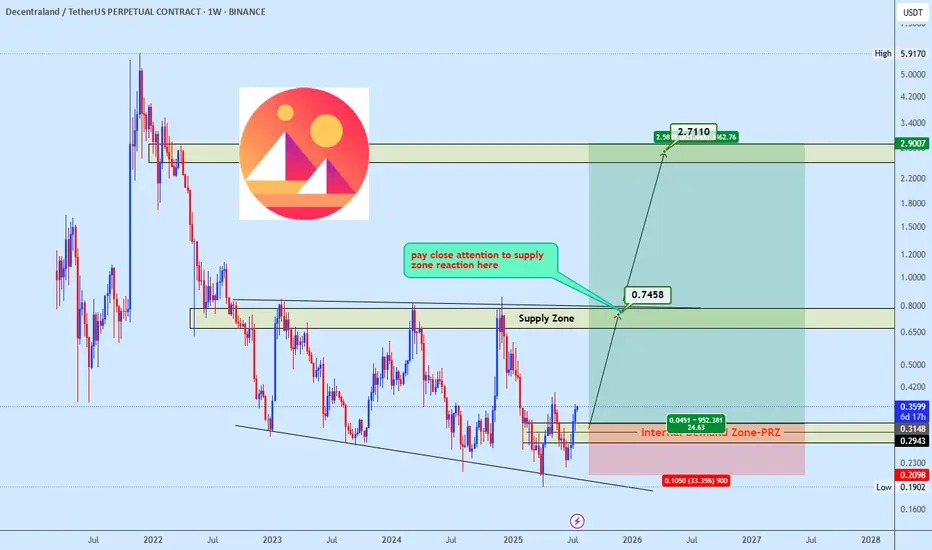
Manausdt buy opportunityMANAUSDT is gaining strength with price rebounding toward the bottom trendline and pushing upward. Momentum favors a continued rise toward the $0.65–$0.80 supply zone, a key level that previously triggered strong sell-offs. A successful breakout above this zone could unlock significant bullish momentum, with eyes set on the $2.70 region as the final setup target. Let price action lead, this could unfold swiftly.
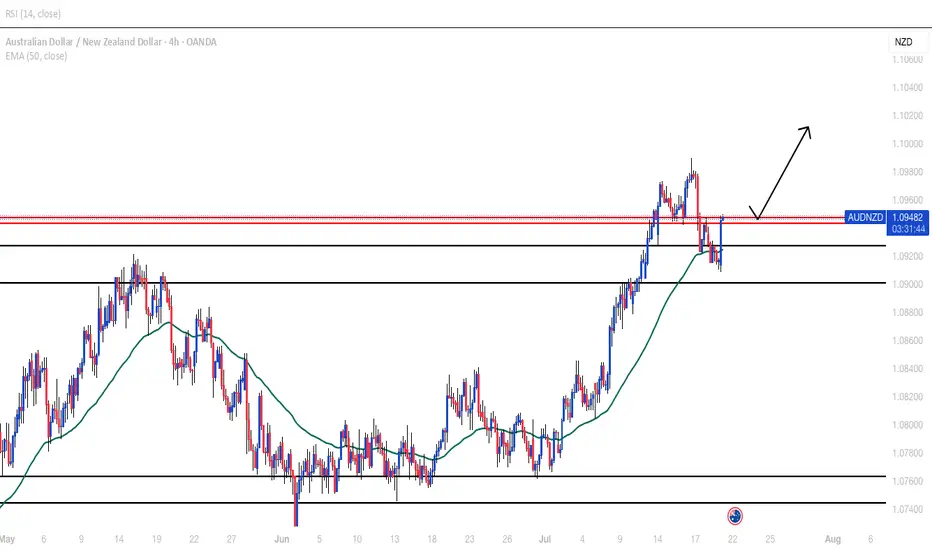
AUDNZD BULLISH CONTINUATIONBroke out of daily resistance, made the retracement now waiting for the H4/H1 resistance to be broken then look for buys. 1st target at next H4 resistance around 1.10100
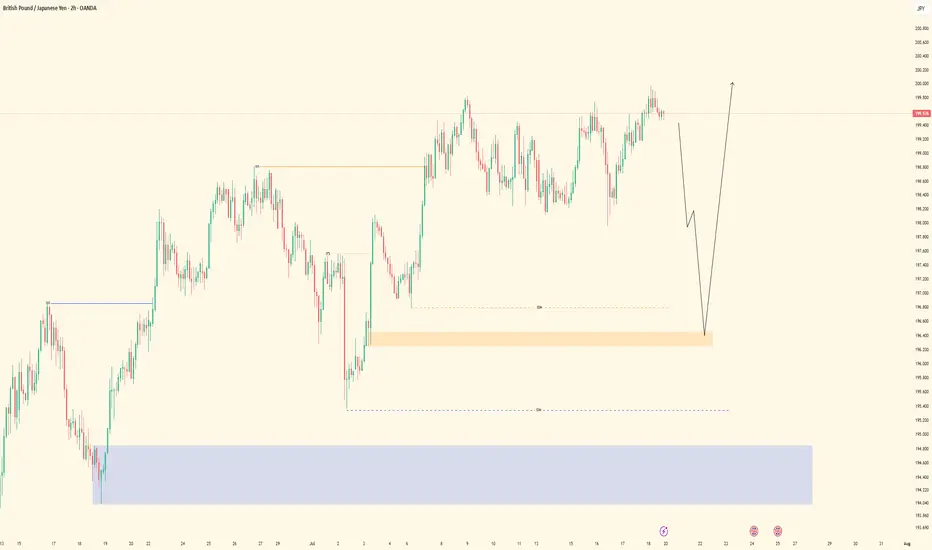
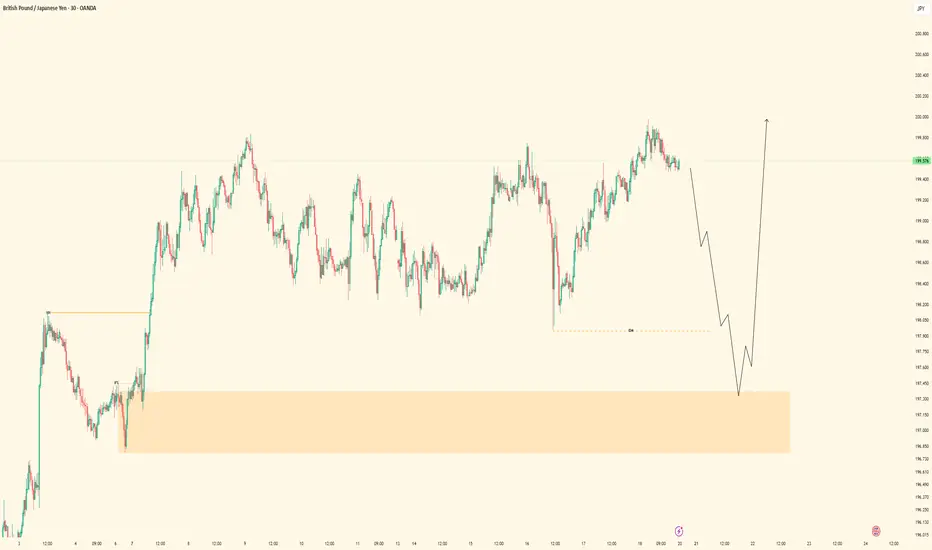
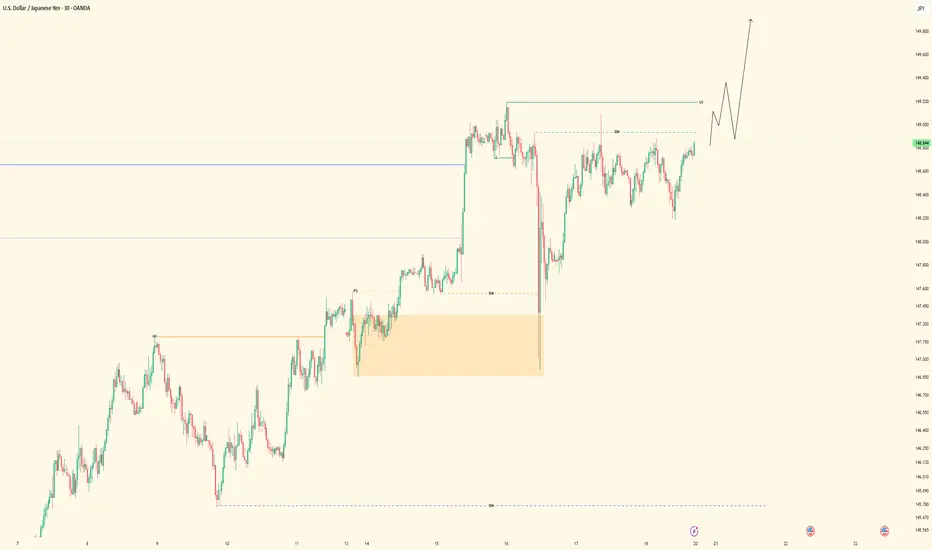
GBPJPY- UPDATED ANALYSIS GBPJPY Bias: Bullish HTF Overview (4H): Price remains in strong bullish structure, with higher highs continuing to break. No signs of deep pullbacks toward major SSLs, confirming strength in the current leg. LTF Confirmation (30M): Clean refined structure now visible. Market gave a textbook pullback into a fresh demand zone (30M OB) after sweeping minor liquidity. No need to expect a deeper move unless invalidated. Entry Zone: Watching for price reaction from the refined 30M OB. If price respects this level, I’ll drop to 5M for LH break → 1M for entry precision. Targets: Eyes on recent high as first TP, followed by extended targets if momentum continues. Mindset Note: Sometimes the best move is simply refining levels and letting the setup come to you. No rush, just alignment.
GBPJPY - Bullish Continuation Setup• Pair: GBPJPY
• Bias: Bullish (Buy)
• HTF Overview (4H):
• Strong bullish momentum with clear breaks to the upside.
• No signs of price reaching deeper 4H SSL — continuation more likely.
• MTF Refinement (30M):
• Watching for price to mitigate lower 30M OB zone.
• Expecting bullish continuation from that area.
• Entry Zone:
• Wait for LTF confirmation inside 30M OB.
• Switch to trader mode after valid CHoCH / intent confirmation.
• Targets:
• Structure highs / clean extension into the next liquidity pool.
• Mindset Note:
• Be patient, trust bullish structure. Let price come to you.
Bless Trading!
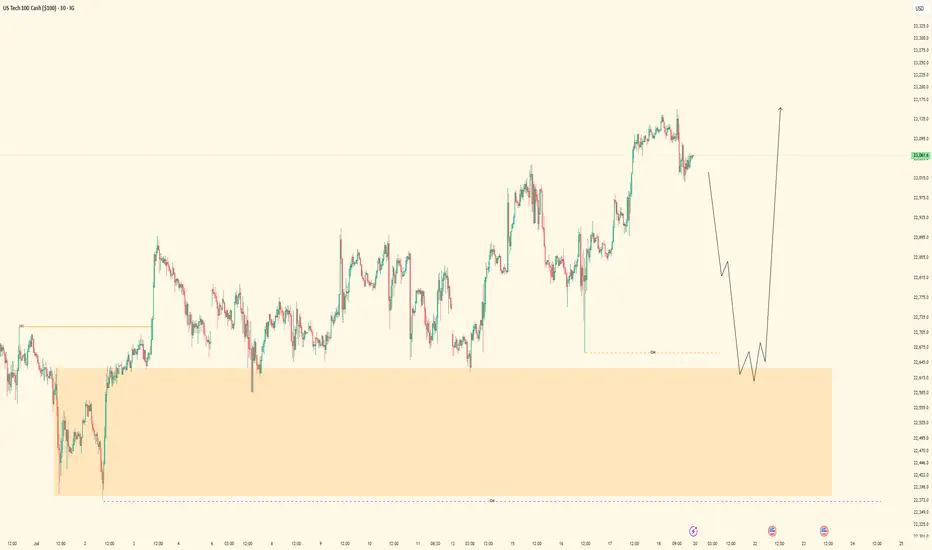
NAS100 - Bullish Trend Continuation Setup• Pair: NAS100 (Nasdaq)
• Bias: Bullish
• HTF Overview (4H):
• Strong bullish structure and momentum from last week.
• Price consistently printing higher highs with no signs of reversal.
• MTF Refinement (30M):
• Waiting for a clean sweep of SSL (sell-side liquidity).
• Looking for price to dip into 30M OB for continuation opportunity.
• Entry Zone:
• Watch 30M OB — once price sweeps liquidity and confirms, execute long.
• Targets:
• Structure highs / previous weekly highs.
• Mindset Note:
• Simple execution plan — ride the trend, trust the structure.
• Wait for confirmation before switching from analyst to trader mode.
Bless Trading!
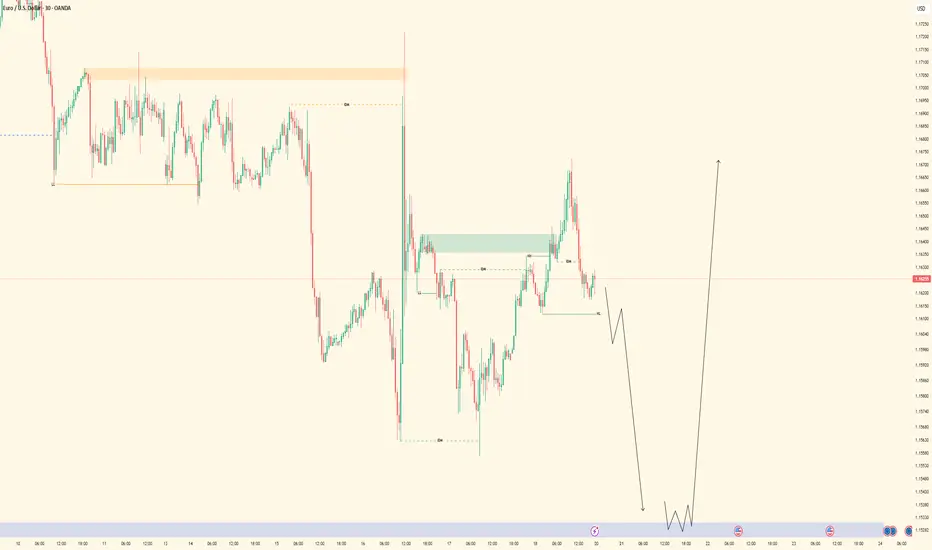
EURUSD - Bullish Bias with Tactical Short Setup• Pair: EURUSD
• Bias: Bullish overall | Tactical short into demand
• HTF Overview (4H):
• Bullish structure confirmed.
• Price took out SSL liquidity — likely draw is internal structure OB below.
• Expecting deeper pullback before continuation.
• MTF Refinement (30M):
• Looking for price to sell off into 4H OB.
• Price already mitigated 30M OB and rejected — watching for follow-through.
• LTF Confirmation (5M):
• Still in analysis mode — waiting on a CHoCH from 5M OB.
• Green lines on chart reflect 5M internal structure.
• Entry Zone:
• Enter short only after 5M shift confirms.
• Ride short into 4H OB demand zone.
• Targets:
• Short-term: 30M lows.
• Major: 4H OB for bullish reaction.
• Mindset Note:
• No rush to enter — analysis leads, execution follows.
• Let price deliver confirmation before switching to trader mode.
Bless Trading!
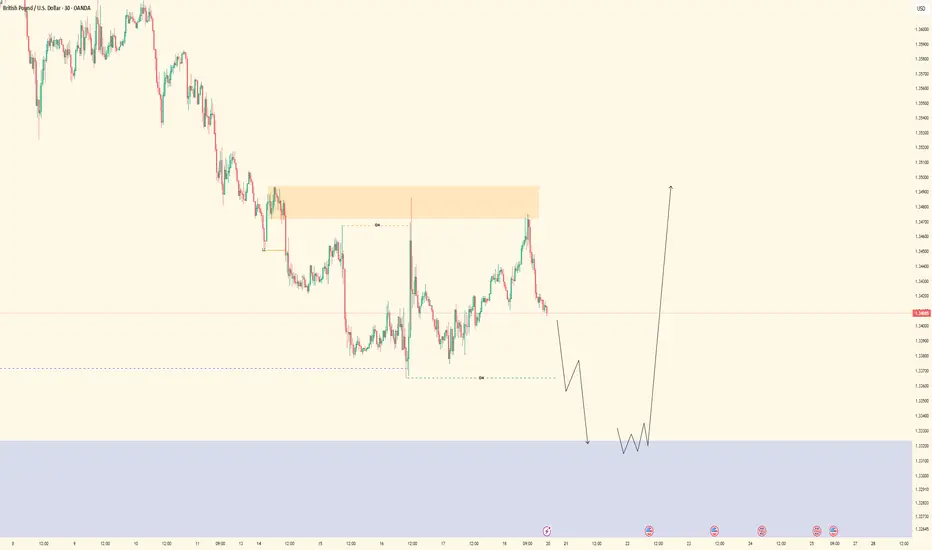
GBPUSD - Bullish Bias with Tactical Short Setup• Pair: GBPUSD (GU)
• Bias: Bullish overall | Tactical short for OB mitigation
• HTF Overview (4H):
• Price broke major highs — clear bullish intent.
• Pullback last week suggests price is targeting 4H SSL for liquidity + OB mitigation before further upside.
• MTF Refinement (30M):
• Price structure currently presents a temporary sell bias.
• BSL has been taken — confirming liquidity sweep.
• Eyeing price to run lower into 4H OB zone.
• LTF Confirmation (5M/1M):
• Waiting on LTF confirmation to ride the move down into the 4H OB.
•Only entering after analysis is complete and CHoCH shows cleanly.
• Entry Zone:
• Tactical short after LTF confirms.
• Final long setup expected from 4H OB after mitigation.
• Targets:
• 30M lows as short-term target.
• 4H OB as the major zone for potential bullish reversal.
• Mindset Note:
• It’s analysis before execution.
• Staying in sync with HTF logic while sniping intraday plays for precision entries.
Bless Trading!
USDJPY - Bullish Structure in Play• Pair: USDJPY (UJ) • Bias: Bullish • HTF Overview (4H): • Clean external break to the upside confirms bull control heading into the new week. • Structure shift is undeniable — market bias is now favoring continued strength.
• MTF Refinement (30M): • Zoomed in to the 30M and identified internal liquidity (SSL) taken out. • Strong mitigation of internal OB followed. • Still in analysis mode — no trades taken yet.
• LTF Confirmation (5M): • Waiting on a refined CHoCH (marked by green lines at highs). • Once that prints and rules align, I’ll shift into trader mode for the execution.
• Entry Zone: • 30M OB mitigation + LTF (5M) CHoCH confirmation.
• Mindset Note: • Patience is the play. No guessing, no hesitation — just clean reads and precision strikes. • Analysis first, execution second. That’s the system.
Bless Trading!
XAUUSD - Bullish OutlookPair: XAUUSD (Gold) Bias: Bullish HTF Overview (4H): Price has taken major liquidity and mitigated a strong order block. We’re now seeing internal breaks of structure forming to the upside, indicating momentum toward the next high around 3440.000.
MTF Refinement (30M – 45M): Refined bullish structure is forming on the 30M chart, with clear signs of continuation. I’m watching for a deeper mitigation into the 30M OB where LTF confirmations (5M and below) will validate entry. The 45M helps provide a broader structure perspective and context.
Entry Zone: Pending — awaiting mitigation into the 30M OB + lower timeframe confirmation (i.e., 5M LH break or refined CHoCH).
Mindset Note: Currently in analyst mode — preparing for execution only after structure respects the top-down narrative. No rushing. Let price come to me.
Bless Trading!
Bearish or bullish? Analysis:
Daily outlook:
- if market moves to to the daily key level, and make a short term bounce or sweep
will take longs setups
- if market moves sharply through the Daily key level, will look for short setups

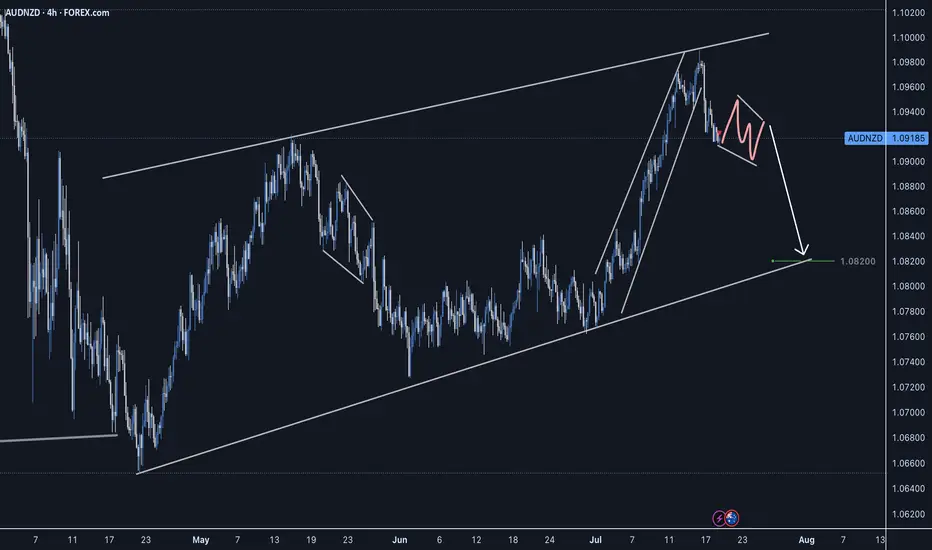
AUDNZD Short Setup - CAB EntrySellers stepping in, strong reversal impulse. Waiting for a slight correction before taking a short entry on the LTF.
Good Luck
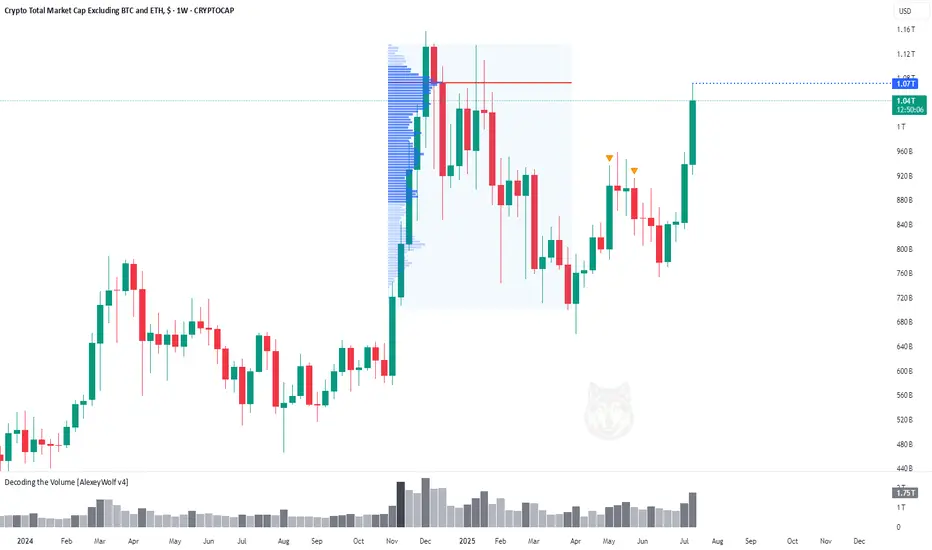
Altcoin Market Hits First Target at $1.07THi traders and investors!
The market capitalization of Total3 has reached $1.07 trillion, marking the first major target for the altcoin market.
This level corresponds to the Point of Control (POC) from the previous bullish rally and the subsequent correction — a key area of traded volume and market interest.
Several factors now suggest the potential for a continued move higher. On the fundamental side, the recent signing of a pro-crypto bill by Donald Trump has boosted overall sentiment in the digital asset space, especially among altcoins. From a technical perspective, many leading altcoins are showing bullish continuation patterns.
Wishing you profitable trades!
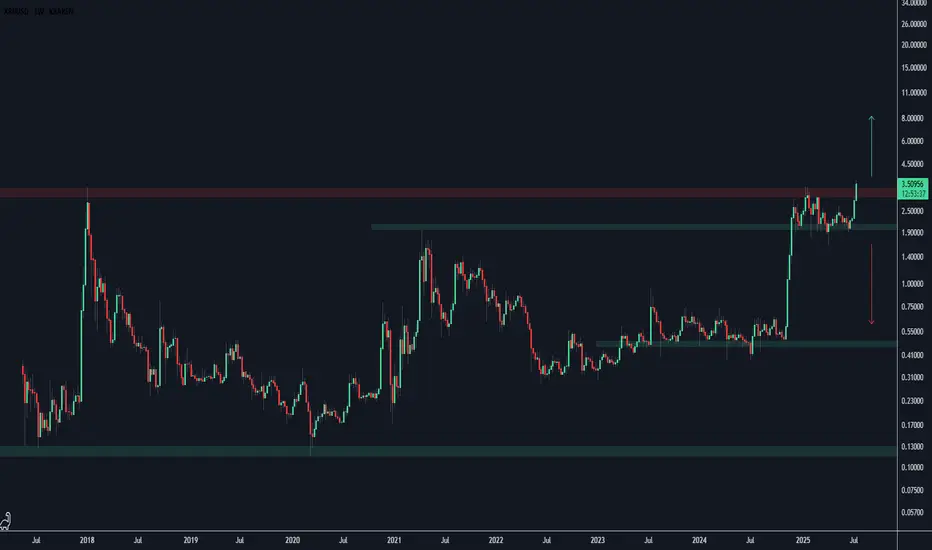
XRP Weekly ChartPrice made new ATHs on Friday went as high as $3.66, taking out the previous high at $3.39.
See if this week closes above, the monthly candle would give a stronger confirmation.
Anything could take price to $5+ or back down to $1.
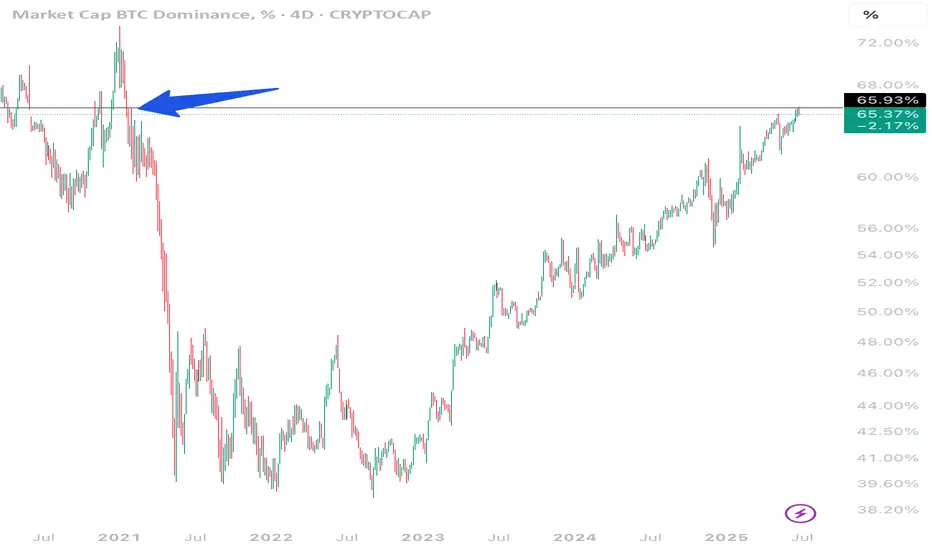
It's over for BTC Dominance, benjamin cowen is wrong hereAlt rally time :) . it will be incredibly hard to overcome this resistance on the chart. Don't listen to benjamin cowen at this point, he is too bullish on btc still. Cya in a few weeks when he changes his mind.
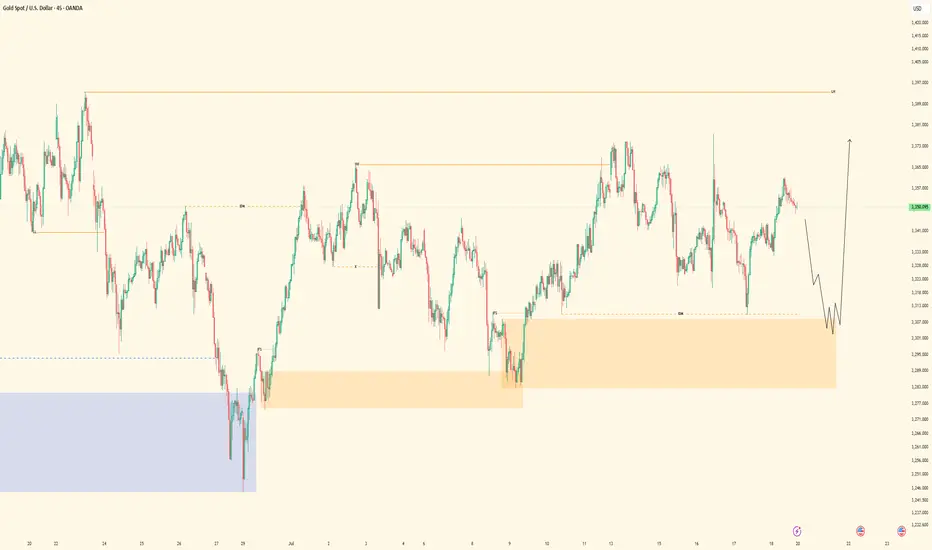
Gold. 3310 reaction & will Buyers reach their remaining targets?Hi traders and investors!
The 3310 level worked out perfectly. We can see a familiar buy pattern forming.
If the buyer fails to push the price higher and the seller returns to the 3310 level, it's likely that the price will continue to decline on the daily timeframe toward the next nearest targets — 3244, or more likely, 3154.
For now, however, we still expect the buyer to pursue the remaining unmet targets at 3393 and 3403.
This analysis is based on the Initiative Analysis concept (IA).
Wishing you profitable trades!

Boeing to $300 - Falling wedge** The year ahead **
On the above 6 day chart price action has corrected over 50% since December 2023. A number of reasons now favour a long position, they include:
1. Price action and RSI resistance breakouts.
2. Support on past resistance.
3. Double bottom on price action (yellow arrows)
4. Falling wedge breakout confirmation with forecast to $300 area
5. The Majority of other traders are bearish. Remember, trading has a high fail rate.
tradingview.sweetlogin.com
Is it possible price continues to correct as others suggest? For sure.
Is it probable? No.
Ww
Type: Trade
Risk: <= 6% of Aerospace & Defence
Return: 60% from current levels
Stop loss: Will say elsewhere

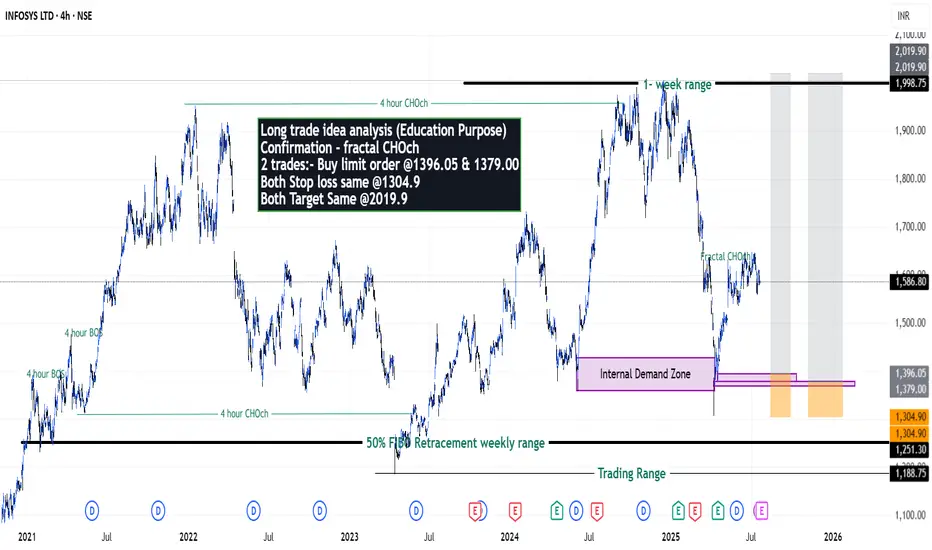
Infosys on getting ready for new high? - {20/07/2025}Educational Analysis says that Infosys (Indian Stock) may give trend Trading opportunities from this range, according to my technical analysis.
Broker - NA
So, my analysis is based on a top-down approach from weekly to trend range to internal trend range.
So my analysis comprises of two structures: 1) Break of structure on weekly range and 2) Trading Range to fill the remaining fair value gap
Let's see what this Stock brings to the table for us in the future.
DISCLAIMER:-
This is not an entry signal. THIS IS FOR EDUCATIONAL PURPOSES ONLY.
I HAVE NO CONCERNS WITH YOUR PROFITS OR LOSS on trades you take from my setup educated analysis.
My Analysis is:-
Short term trend may be go to the Internal demand zone.
Long term trend breaks the creates all time new high.
Long trade idea analysis (Education Purpose)
Confirmation - fractal CHOch
2 trades:- Buy limit order @1396.05 & 1379.00
Both Stop loss same @1304.9
Both Target Same @2019.9
Happy Trading,
Stocks & Commodities TradeAnalysis.