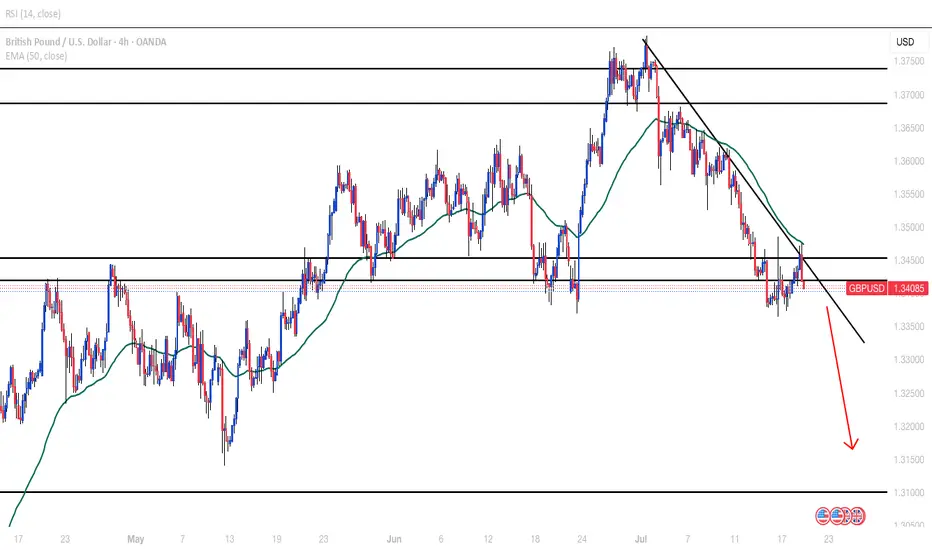
GBPUSD POSSIBLE TREND CHANGE?Reached a strong weekly resistance and pushed down. Broke daily/H4 support. Retesting zone with 50EMA rejection. Looking at 1.32500 as 1st target
Multiple Time Frame Analysis
USDJPY BUY CONTINUATIONBroke out of daily resistance zone, made retest of both zone and 50EMA. H1 has a minor resistance that needs a clear breakout before looking for buying signals.

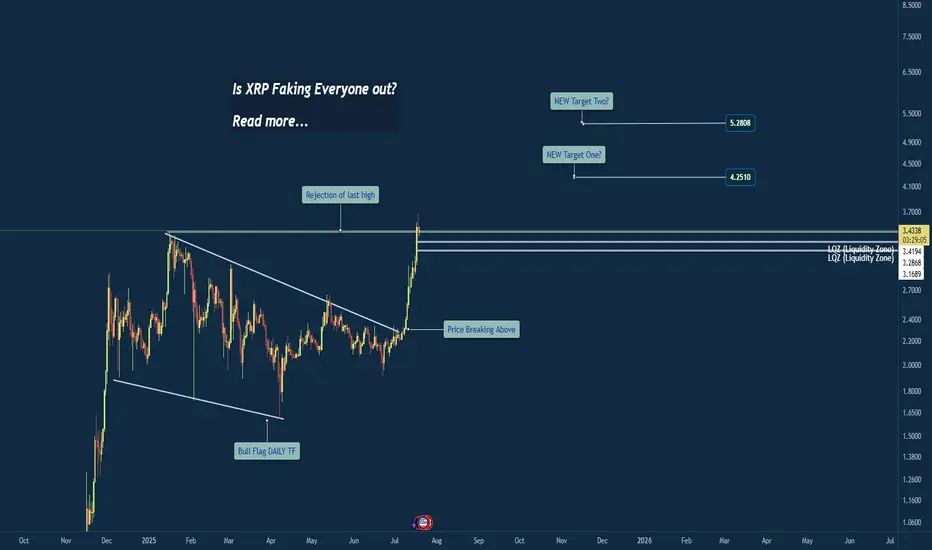
Breakout or Bull Trap? XRP at Critical Weekly LevelWeekly Chart Insight: XRP Closing Above Previous High
XRP has just closed above its previous weekly high—a significant development that could signal a shift in market sentiment. Historically, when price closes above such a critical level on the weekly timeframe, it often leads to continuation, unless a sharp rejection quickly follows.
At this stage, the focus shifts to the 4-hour timeframe for confirmation. An impulsive move above the current consolidation zone could indicate that this breakout is legitimate, potentially leading to another bullish weekly candle.
However, caution is warranted. If the next two daily candles close weakly or fail to maintain structure above the breakout level, it could hint at a fakeout or liquidity grab before a deeper correction.
My Current Bias:
I remain neutral-to-bullish, contingent on:
An impulsive continuation on the 4HR
Strong daily closes above the key range
Price not falling back and closing below the weekly breakout level
If price begins to consolidate and hold this level, that would reinforce the bullish case. But if we see immediate selling pressure and a re-entrance below the breakout, I’ll reconsider the bias based on developing structure.
Stock Index Weekly Analysis: ES, NQ, YMWeekly Targets (Gun to my head!)
- ES: Neutral
- NQ: Neutral
- YM: $44,186

FX Matrix: DXY, EUR/USD, GBP/USD Weekly AnalysisWeekly Targets: (Gun to my head)
DXY: 99.957, 100.424, 100.689
GBPUSD: 1.31643, 1.31453,

US10Y & T-BONDS Weekly AnalysisWeekly Targets:
- US10Y: 4.412%, 4.395%, 4.375%
- T-BONDS: 113.10, 113.16, 113.23


Gold LongsFollowing last weeks bias. Looking for REQH target.
Want to pair longs with a weekly profile. Ideally Monday or Tuesday creates the low of week. Will look to get onside with longs once theres a clear intraweek reversal. Trade the continuation higher. A close below 3320 is invalidation. Expecting previous week low to be protected and expansion to the upside
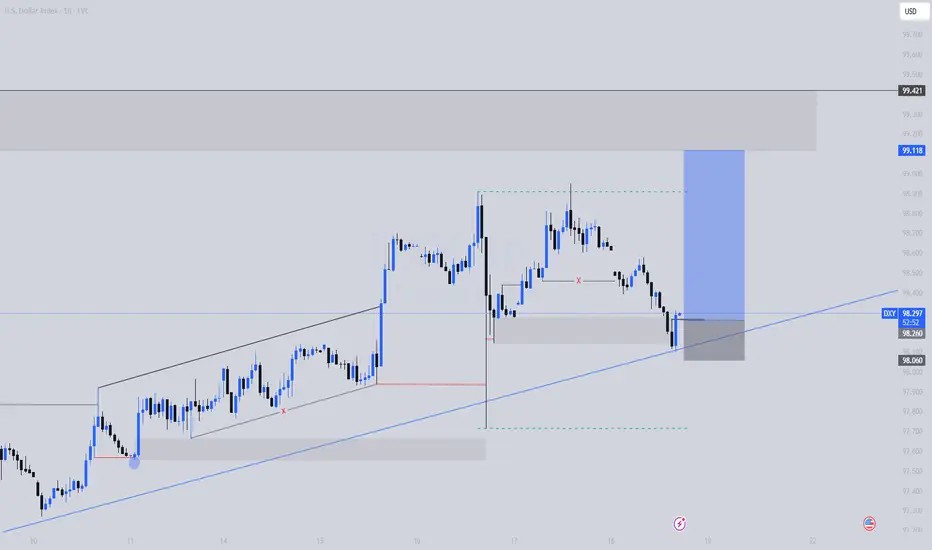
DXY LONG SETUP | Skyrocketinggggg
This is a bullish setup on the U.S. Dollar Index (DXY), taken from the 1H timeframe using Smart Money Concepts.
Price retraced into a clearly defined 1H demand zone where it also tapped a trendline support, creating a strong confluence +an LQC. The zone had internal liquidity swept and price mitigated a bullish order block, indicating potential institutional re-accumulation.
Entry was taken after bullish confirmation within the zone (engulfing candle), aligned with my SMC strategy which targets liquidity grabs and mitigation zones.
🔹 Entry: 98.06
🔹 SL: 97.83 (below the zone and structure)
🔹 TP: 99.11 (previous H1 high & clean supply zone)
🔹 RR: Approx. 4.5R
🔍 Technical Confluences:
Demand zone + OB mitigation + LQC
Trendline reaction (support respected)
Liquidity sweep + BOS (Break of Structure)
Clean imbalance above = fuel for price
Bullish engulfing as confirmation
📰 Fundamental Bias:
Today’s U.S. Jobless Claims came in better than expected, signaling labor market strength. Additionally, Retail Sales data was positive, reinforcing USD strength. These support a hawkish Fed narrative, aligning with our bullish technical setup.
Bias remains bullish unless price closes below 97.83 (invalidation level).
Pre-Market Prep 7.18.2025What it do, everyone! Here’s my pre-market prep for Friday, July 18th. Just to give you a quick overview, I'm using my prior value areas, the prior day's high and low, and the CVA levels from my market profile. I use all this history to help me plan my trades for the day.
So, starting with the S&P, as of now we’re green across the board. We’re in balance up from the prior day’s range, value area, and the CVA. My main plan is to look for acceptance and a pullback to a confluence area for longs. If we get rotational and break out of that area, I’m ready to go short.
For the NASDAQ, it's a similar story. We’re rotational in the prior value area and range, but we’re balanced up from the recent CVA. Right now, I’m waiting to see if we can confirm acceptance and then I’ll look for a short from that rotational area down to the prior value area low.
In the Russell, I’m seeing clear acceptance above all levels, so a pullback to the confluence area for a long would be ideal.
For Gold, I’m also seeing it in balance up on all fronts. My first move would be a long from the prior day’s high. If we drop a bit lower, I’ll be looking at that CVA and PVA area for another long.
The Euro is a bit more mixed. We’re rotational in the prior day’s range but balanced up in the value area and CVA. I want to clear the prior day’s high before taking any big moves.
The Yen is also rotational, so I’m looking to trade the extremes, maybe some scalps while we’re balanced in the prior value area.
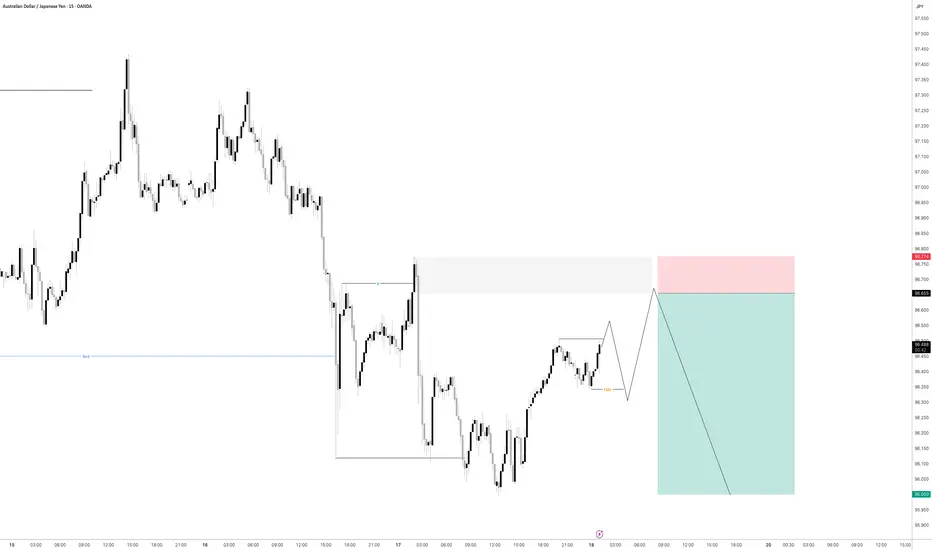
For the Aussie Dollar, we’re in balance up from the PVA, but rotational in the prior day’s range and CVA. I’m looking for shorts near the top area and longs at the bottom, staying out of the middle for now.
And finally, Crude Oil is rotational on all fronts. My first plan is to look for shorts from the confluence area down to the prior day’s range.
That’s my pre-market prep for today. Let’s trade smart. Happy Friday, peace!

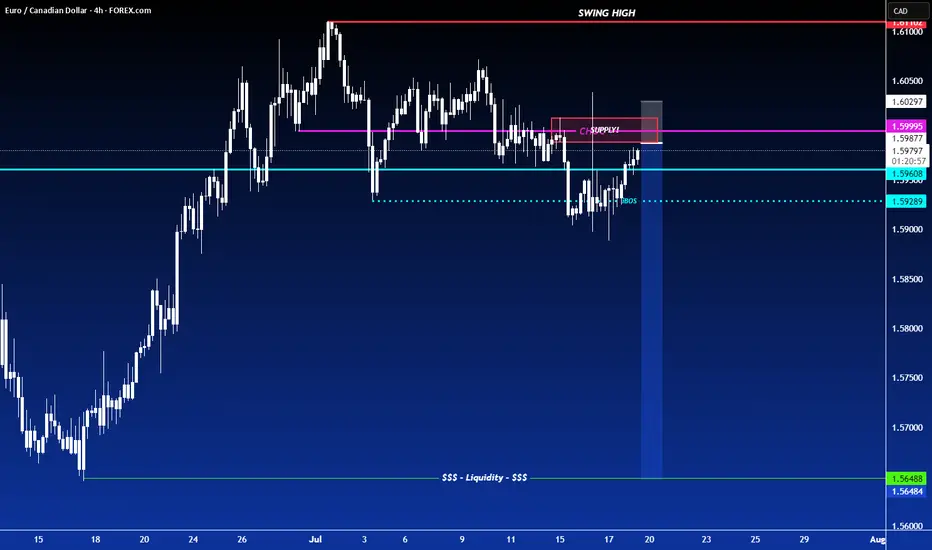
SHORT ON EUR/CADEUR/CAD has given us a nice CHOC (change of character) to the downside followed by a nice retest to supply.
I expect price to push up a little more into supply before dropping to the next support/demand level.
Looking to Catch 300-400 pips over the next few days.
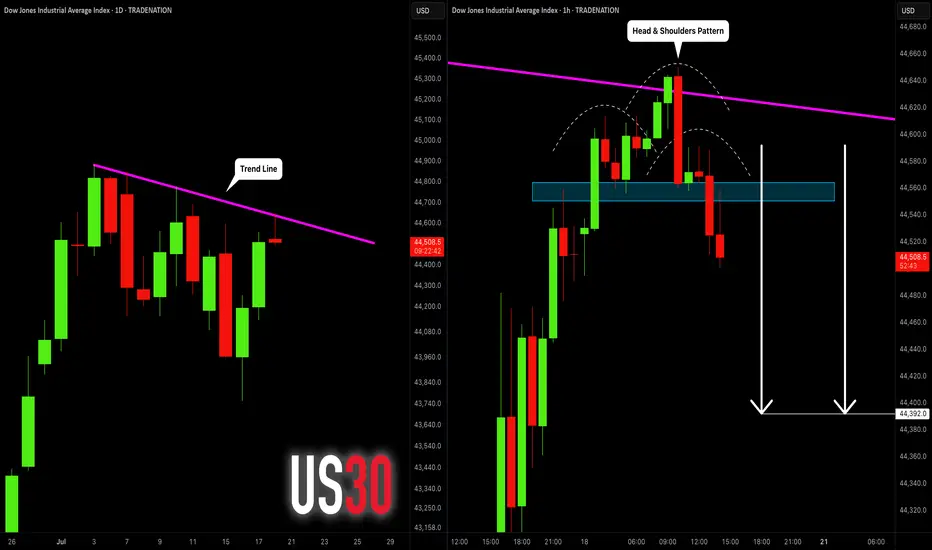
DOW JONES INDEX (US30): Bearish Move From Trend Line
I see a test of a strong trend line on US30.
The price formed a head & shoulders pattern on that
and a breakout of its neckline on an hourly time frame.
I expect a retracement to 48390
❤️Please, support my work with like, thank you!❤️
I am part of Trade Nation's Influencer program and receive a monthly fee for using their TradingView charts in my analysis.
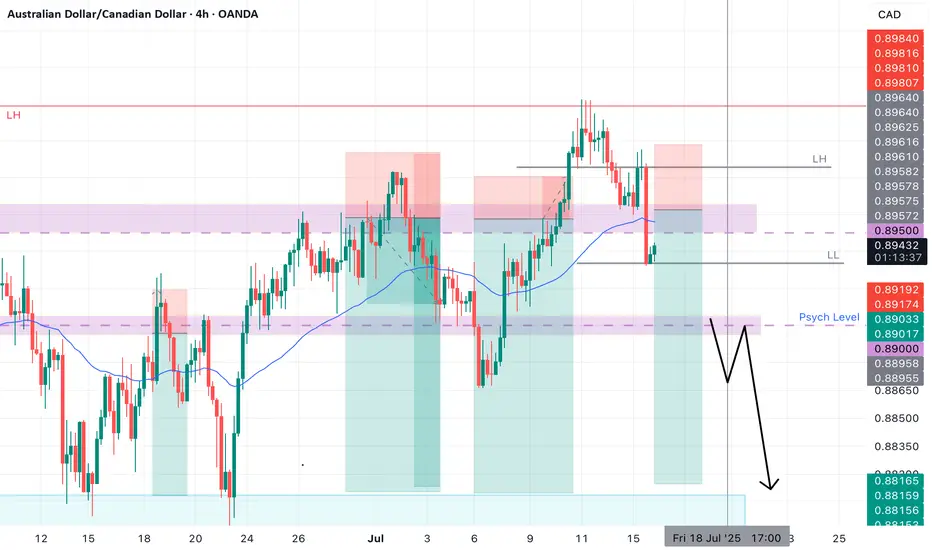
AUDCAD SHORTMarket structure bearish on HTFs 3
Entry at both Weekly and Daily AOi
Weekly Rejection at AOi
Weekly Previous Structure Point
Weekly Rejection at AOi
Daily Rejection at AOi
Daily Previous Structure Point
Around Psychological Level 0.89500
H4 EMA retest
H4 Candlestick rejection
Rejection from Previous structure
Levels 4.17
Entry 120%
REMEMBER : Trading is a Game Of Probability
: Manage Your Risk
: Be Patient
: Every Moment Is Unique
: Rinse, Wash, Repeat!
: Christ is King.
Will this stock skyrocket 500x to $700?Talk of the moment is tariffs and the impact they’ll have on business and individuals. Generally, nothing good. A zero sum game in WW opinion.
For a future preview, see Brexit for details. American citizens have chosen to impose economic sanctions upon themselves just like Brexit voters. As a result importers will be required increase their paperwork, add fees to raw materials prior to entering the country, impose checks and pass those costs onto the consumer. A consumer that is already weighted down on auto debt.
Ignoring the long term economic impacts one should appreciate the internal demand pressures from manufacturers now needed to replace expensive imports.
In my opinion a number of businesses now exist to reap this demand. The smaller the better.
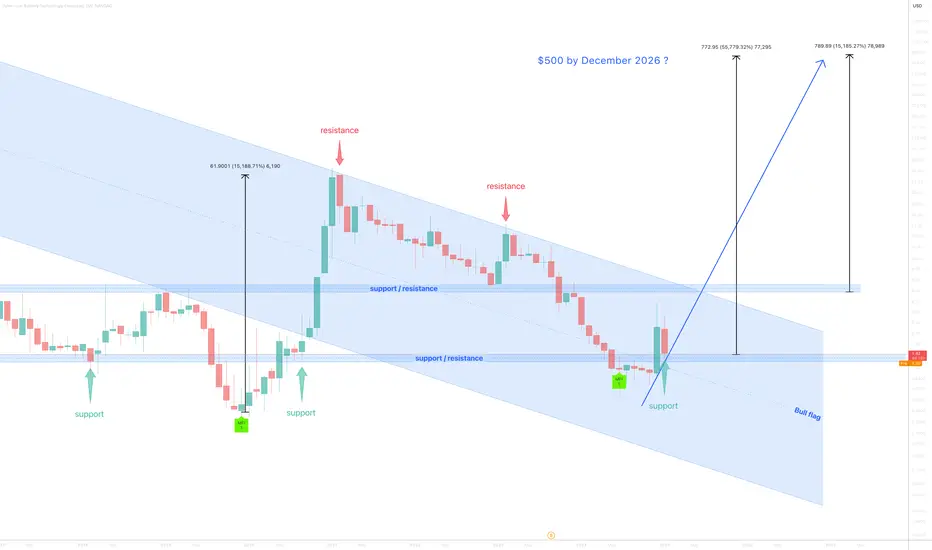
“American Battery Technology” is one such business that stands to benefit from the surge in EV growth in the US. In particular on the topic of recycling. As tariffs take hold on the imports of raw material the recycling of old becomes an increasingly attractive alternative source.
The TA:
On the above 5 week chart price action has seen a 98% correction since January 2021. A number of reasons now exist for a bullish outlook, they include:
1) Price action and RSI resistance breakouts.
2) Regular bullish divergence, settings used the same as January 2020 impulsive wave.
3) Support on past resistance, look left.
4) No share splits since 2004, excellent.
5) Short interest 9%, after a recent 70% correction?!
6) The bull flag, should it confirm, forecasts a 50,000% move or 500x to $700 area by December 2026. That’s a market capital of $60b for the industry of car battery recycling. Still small potatoes.
Is it possible price action continues to correct? Sure. Sellers, they love it.
Is it probable? No.
Ww
Type: Investment
Risk: You decide
Timeframe for long entry: Now
Stop loss: will say elsewhere
Return: Lambo’s all round
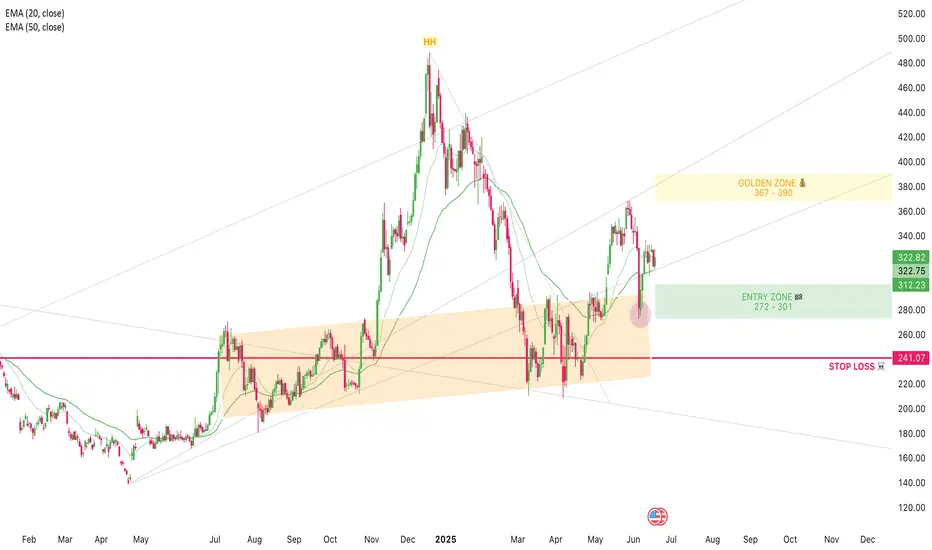
TSLA: Don't Sleep on the PullbackTesla’s bullish momentum is still in control – the weekly chart shows we’re still in an uptrend, and the trend is still our best friend. After a strong bounce from support a couple weeks ago, price is now rejecting off a weak resistance zone. Ideally, this pulls it back into my entry zone to retest the bottom or the 50% mark of the current swing. I’m using trend lines for guidance and expecting the next swing to push up into that confluence area. My golden zone is set between $367–$390, with partial profits be taken at $367 (top of the channel) and the rest near $390, where we meet the trend line. Stop loss is placed at $241, just below the level where momentum would likely shift.
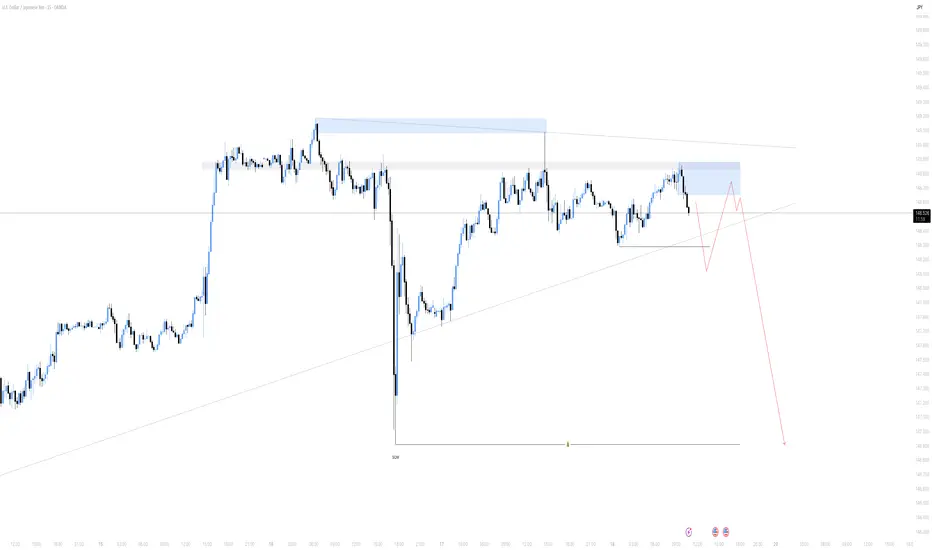
UJ shortsThe dollar is looking weak, I expect UJ to fall as well.
UJ showed some strong weakness last Wednesday following the drop in price of the dollar.
Looks like supply is in control atm, I would like to see price breaking the newest low to confirm the bearishness on UJ.
When it does, I'll start looking for new short opportunities when price mitigates the current move.
GBPCAD Bearish Continuation Patterns and ConfirmationsA broken daily demand zone, a resistance trendline showing direction to the downside, bearish continuation patterns (rejection patterns) and consistent H4 supply zones all indicate that this market is bearish and if the current H4 supply holds then use bearish confirmations on LTFs to short to the next support or demand zone.

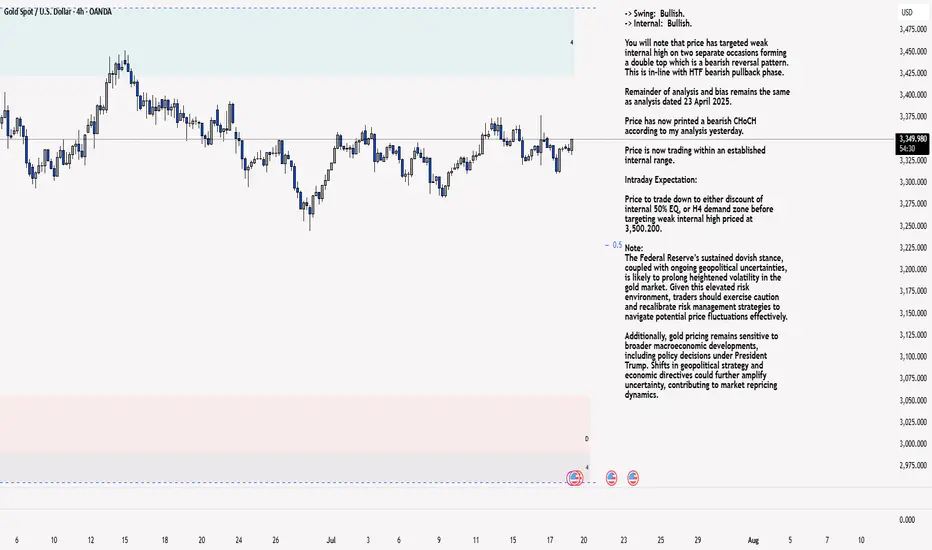
XAU/USD 18 July 2025 Intraday AnalysisH4 Analysis:
-> Swing: Bullish.
-> Internal: Bullish.
You will note that price has targeted weak internal high on two separate occasions forming a double top which is a bearish reversal pattern. This is in-line with HTF bearish pullback phase.
Remainder of analysis and bias remains the same as analysis dated 23 April 2025.
Price has now printed a bearish CHoCH according to my analysis yesterday.
Price is now trading within an established internal range.
Intraday Expectation:
Price to trade down to either discount of internal 50% EQ, or H4 demand zone before targeting weak internal high priced at 3,500.200.
Note:
The Federal Reserve’s sustained dovish stance, coupled with ongoing geopolitical uncertainties, is likely to prolong heightened volatility in the gold market. Given this elevated risk environment, traders should exercise caution and recalibrate risk management strategies to navigate potential price fluctuations effectively.
Additionally, gold pricing remains sensitive to broader macroeconomic developments, including policy decisions under President Trump. Shifts in geopolitical strategy and economic directives could further amplify uncertainty, contributing to market repricing dynamics.
H4 Chart:
M15 Analysis:
-> Swing: Bullish.
-> Internal: Bullish.
H4 Timeframe - Price has failed to target weak internal high, therefore, it would not be unrealistic if price printed a bearish iBOS.
The remainder of my analysis shall remain the same as analysis dated 13 June 2025, apart from target price.
As per my analysis dated 22 May 2025 whereby I mentioned price can be seen to be reacting at discount of 50% EQ on H4 timeframe, therefore, it is a viable alternative that price could potentially print a bullish iBOS on M15 timeframe despite internal structure being bearish.
Price has printed a bullish iBOS followed by a bearish CHoCH, which indicates, but does not confirm, bearish pullback phase initiation. I will however continue to monitor, with respect to depth of pullback.
Intraday Expectation:
Price to continue bearish, react at either M15 supply zone, or discount of 50% internal EQ before targeting weak internal high priced at 3,451.375.
Note:
Gold remains highly volatile amid the Federal Reserve's continued dovish stance, persistent and escalating geopolitical uncertainties. Traders should implement robust risk management strategies and remain vigilant, as price swings may become more pronounced in this elevated volatility environment.
Additionally, President Trump’s recent tariff announcements are expected to further amplify market turbulence, potentially triggering sharp price fluctuations and whipsaws.
M15 Chart:
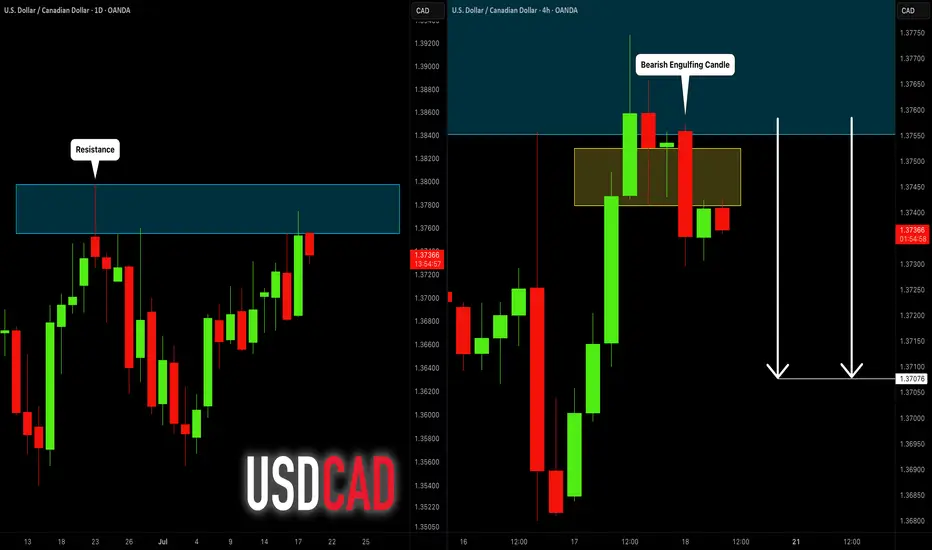
USDCAD: Bearish Move From Resistance 🇺🇸🇨🇦
USDCAD is going to retrace from a key daily resistance.
A bearish imbalance candle that the price formed after its test
during the Asian session provides a strong intraday bearish confirmation.
Goal - 1.3707
❤️Please, support my work with like, thank you!❤️
I am part of Trade Nation's Influencer program and receive a monthly fee for using their TradingView charts in my analysis.
EURJPY ANALYSISAfter seeing that the previous daily candle could not trade below the moving averages and had a retracement to the upside it will be a good idea to wait and see how the pair trades before executing in a specific direction

Has the DXY got you confused? Well, check out this analysis.Welcome back, traders, it’s Skeptic from Skeptic Lab! 😎 , the DXY has entered a corrective phase over the past weeks. In this analysis, I’ve broken down the technicals and chart with a skeptical eye, outlined long and short triggers on the 4h timeframe , and tried to give you a solid multi-timeframe view of the setup. At the end, I’ve shared a key educational tip that can seriously boost your win rate and R/R , so make sure you check out the full analysis.
💬If you’ve got a specific symbol in mind for analysis, drop it in the comments. Have a profitable Friday, fam <3

AUDJPY - POTENTIAL?USDJPY is getting super interesting.
If we can get some bearish intent to try and induce the early sellers to the downside creating some buyside liquidity then i will be all over this for a trade.
Lets see how price has moved by the morning as it does need a bit more development before we can consider entering for a short position
July 2025 - 100% Trump token move to $18 before October"Trump token, it's gonna be huge, believe me. We're talking about a tremendous move, a total win, unlike anything you've ever seen. The fake news, they won't tell you but this token it's exploding. It's happening folks everyone knows it, everyone is talking about it."
Alright, enough of that...
On the above 1 day chart price action has corrected 45% since the month of April. The chart now displays a compelling technical setup for a 100% move to $18.
Bullish Arguments:
Support and resistance
Price action and Relative Strength Index (RSI) breakout from downtrend resistance. Price action also confirms support on past resistance (red / blue arrows).
The trend
A higher low print is confirmed with the downtrend resistance breakout. The RSI also mirrors this trend reversal with a higher low print.
Divergence
Look left. Five oscillators now print positive divergence with price action.
Conclusions
The downtrend clearly now shows signs of reversal. The next two resistance levels are shown, beyond that is unknown until the upper resistance confirms support. Not expected to occur in this market cycle.
Is it possible price action continues to print lower highs? Sure.
Is it probable? No.
Ww
