MTN

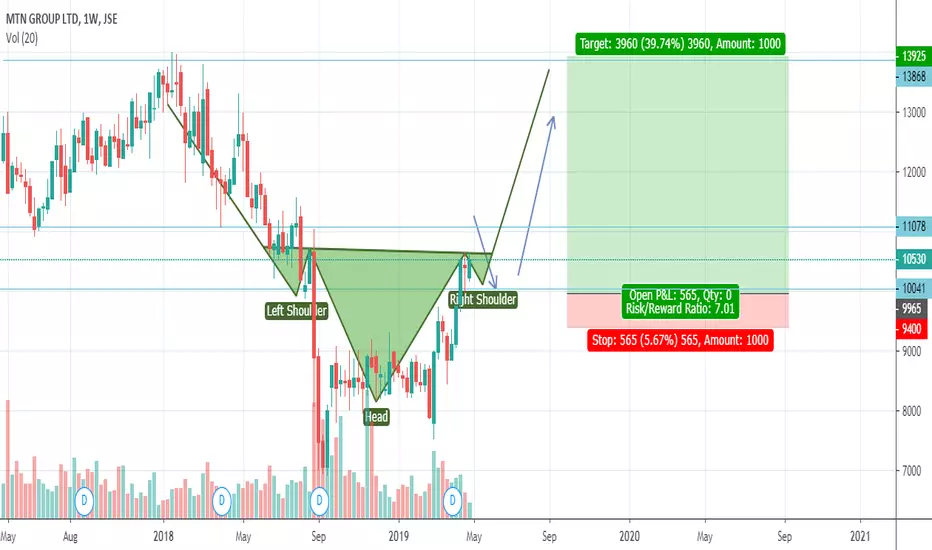
VODACOM (VOD) DAILY TIMEFRAME LONGNever has there been so many multiple confluences on a single chart as this one. Firstly, price formed a head and shoulders pattern on the weekly chart, and tumbled down after the completion of the right shoulder and breach of the price below the the neckline. Secondly, prices have managed to stay under the neckline, which was a key psychological level at 14 000. You know how crazy people can be around round numbers. Also, the price is moving in a steady downtrend as depicted by the lower lows and lower highs and the descending trendline unmasks this. Price is now around the 12 000 key psychological area and the lower timeframes already show a rejection in the form of a bearish candle. I expect prices to continue going down. A fail-safe would be to wait for prices to approach the descending trendline and opening short position once clear signs are given.
I would like to thank all the readers and fans for showing love and supporting my content. If you want me to cover a particular asset/security, please dm me.

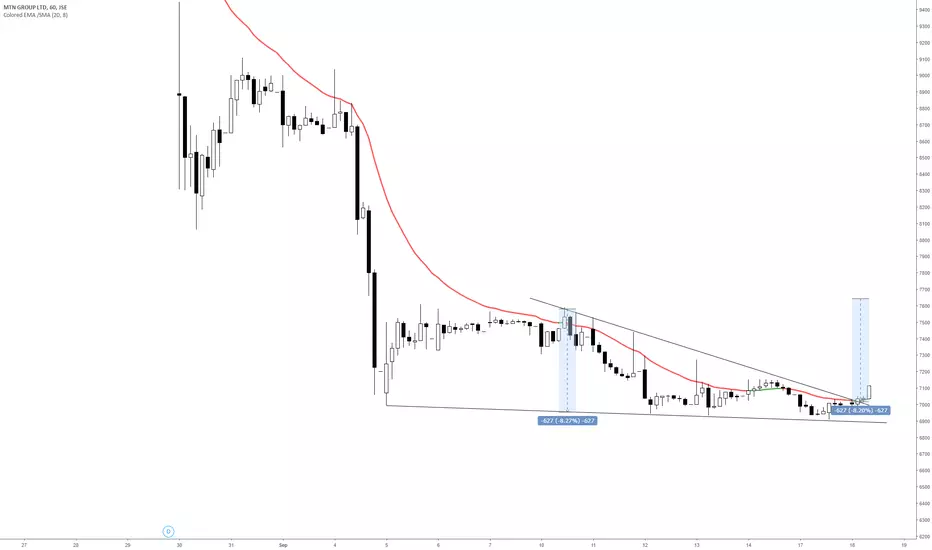
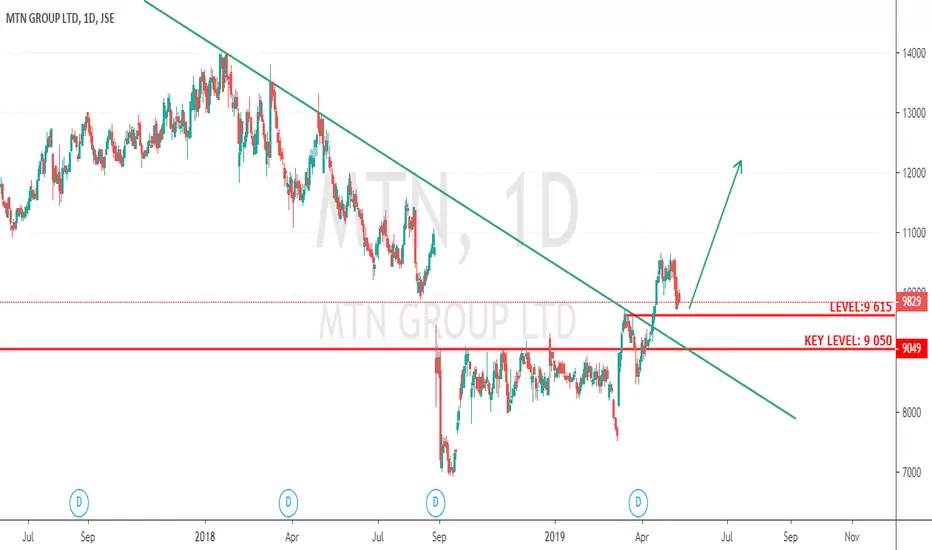
MTN DAILY TIMEFRAME LONGThis stock recently broke out of a descending trendline,and is currently retesting either the trendline itself or a support zone. I am of the opinion that t his stock will resume going up once enough buyers enter the market. Traders can possibly look to enter a long position at the 9 615 level, which rep [resents a support level.
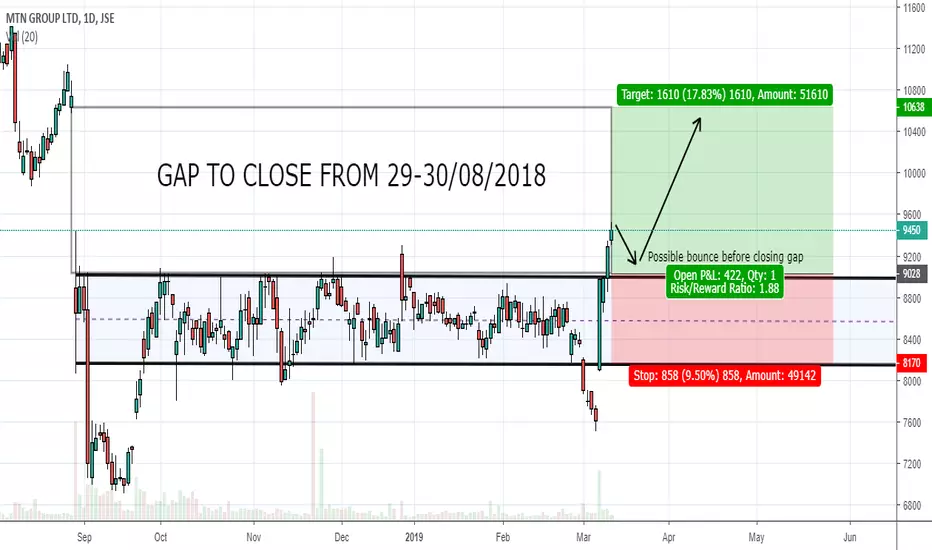
Ascending Triangle MTNJSE:MTN is on the verge of breaking through an ascending triangle pattern. If it breaks through convincingly, I will enter a long position with the target around the level of the close of the gap from August last year.

MTN headed for gap closeJSE:MTN has been trading in a sideways channel since late September 2018. It has now broken out of this channel, having moved up strongly the last few trading days. It is ready for a long position, and the target is the gap close.
Also bear in mind that it could possibly retrace back to the support level and bounce before it goes further up.