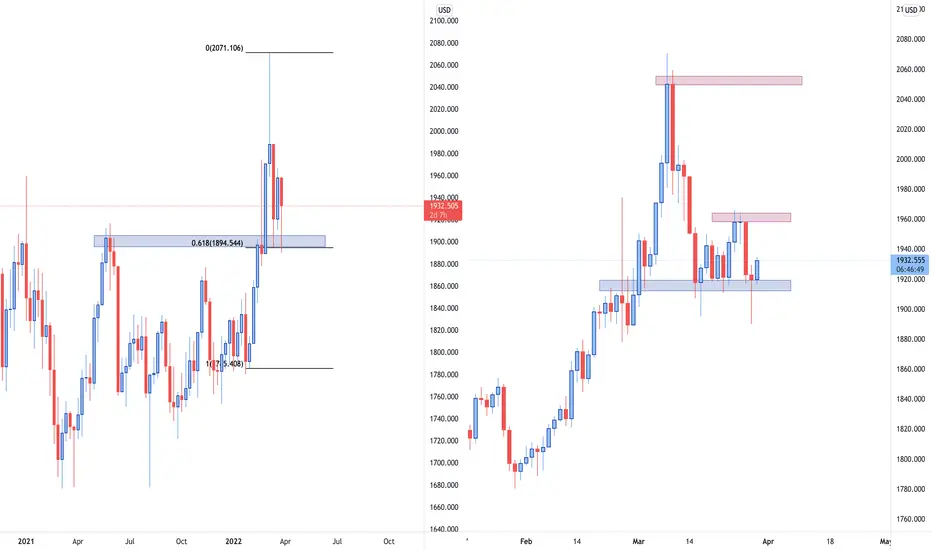
GOLD (XAU/USD): detailed breakdown. Growth will continue?Taking a look at the WEEKLY timeframe chart, it can be inferred that the price has nicely rejected the zone of support that lines up with 0.618 Fibonacci retracement level. Zooming into the DAILY timeframe chart, we can observe that the price has been nicely rejecting the local zone of 1915 support. We are carefully eyeing the price action and looking forward to opening BUY positions. $1960 is our initial target and $2050 is the long-term one.
Happy trading, everyone!
Multitimeframeanalysis
Confluence of supportsIn the 30m chart, price is in a contracting triangle. Momentarily fell to a support and came back up. In the daily, price has broken from a channel and in the weekly, entering into another channel. I expect continuation to male a (d) wave in a contracting triangle of a Wave 4 on the weekly. The d-leg of a Wave 4 is counter trend and make an ABC form. Price is breaking a resistance at the weekly, confirmed by MACD. A pull back is expected in an ABC, if not now then at $53000 which will be supported by the current resistance.
The current support is at $44000.
R/R = 1.71
2% risk of a $30000 is 0.196 Bitcoin
The confirmation to enter comes from the hourly. in 1-hr chart there is pin bar.
Robinhood does not let me!
My account sum has jumped up, it shows only $25'000.00 available to invest, and it dies not let me use it with an error!
Daily:
Weekly:
Ok. Let's wait for the pullback!

GBPUSD LongOANDA:GBPUSD
GBPUSD broke resistance/neckline yesterday on the reverse head and shoulder pattern.
Price pushed up and later retested at 38.2% with a bullish engulfing candle giving buy setup.

XRPUSD Daily Breakdown Wed.Mar.23.2022Please like and comment as it pushes me to keep creating content on pairs and my bias on it :) -This is merely MY outlook and not advice on what YOU should do just my opinion on what I see - yonsfx

XRPUSD Daily Breakdown Mon.Mar.21.2022Please like and comment as it pushes me to keep creating content on pairs and my bias on it :) -This is merely MY outlook and not advice on what YOU should do just my opinion on what I see - yonsfx

WEEKLY FOREX OUTLOOK SUN.MAR.20.2022 - FRI.MAR.25.2022Please like and comment as it pushes me to keep creating content on pairs and my bias on it :) -This is merely MY outlook and not advice on what YOU should do just my opinion on what I see - yonsfx

NATGAS/USD Daily Timeframe Price action AnalysisOANDA:NATGASUSD
Hello Traders,
Here is my Daily timeframe price action analysis.
After reaching a 12 year high in October 2021 of 6.409 , the price trended downwards to the current yearly low and key level of 3.6 , which was respected multiple times throughout 2021.
We see a turn around in the daily trend at the key level of 3.6 and have been trending upwards since.
Please note the key level from 4.65 to 4.75 , which again, was respected multiple times in 2021, currently the price is vibrating around this level and has been doing so since 16th Feb 2022.
4 hourly timeframe analysis alongside potential position entries to follow this evening. Please leave a comment and let me know what you like/dislike or agree/disagree with.

XRPUSD Daily Breakdown Wed.Mar.16.2022Please like and comment as it pushes me to keep creating content on pairs and my bias on it :) -This is merely MY outlook and not advice on what YOU should do just my opinion on what I see - yonsfx

XRPUSD Daily Breakdown Tues.Mar.15.2022Please like and comment as it pushes me to keep creating content on pairs and my bias on it :) -This is merely MY outlook and not advice on what YOU should do just my opinion on what I see - yonsfx

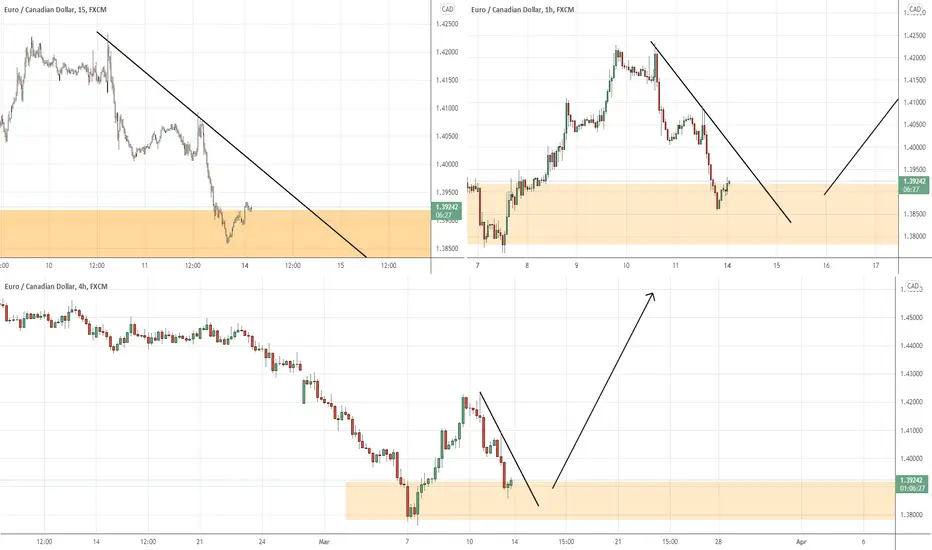
EURCAD Archers ready?Keep your eye on EURCAD as we have pulled back into a strong supply zone. We could see a strong push to the north based off of the original move we saw.
WEEKLY FOREX OUTLOOK SUN.MAR.13.2022 - FRI.MAR.18.2022Please like and comment as it pushes me to keep creating content on pairs and my bias on it :) -This is merely MY outlook and not advice on what YOU should do just my opinion on what I see - yonsfx

XRPUSD Daily Breakdown Sun.Mar.13.2022Please like and comment as it pushes me to keep creating content on pairs and my bias on it :) -This is merely MY outlook and not advice on what YOU should do just my opinion on what I see - yonsfx

XRPUSD Daily Breakdown Sat.Mar.12.2022Please like and comment as it pushes me to keep creating content on pairs and my bias on it :) -This is merely MY outlook and not advice on what YOU should do just my opinion on what I see - yonsfx

XRPUSD Daily Breakdown Fri.Mar.11.2022Please like and comment as it pushes me to keep creating content on pairs and my bias on it :) -This is merely MY outlook and not advice on what YOU should do just my opinion on what I see - yonsfx

XRPUSD Daily Breakdown Thurs.Mar.10.2022Please like and comment as it pushes me to keep creating content on pairs and my bias on it :) -This is merely MY outlook and not advice on what YOU should do just my opinion on what I see - yonsfx

XRPUSD Daily Breakdown Wed.Mar.9.2022Please like and comment as it pushes me to keep creating content on pairs and my bias on it :) -This is merely MY outlook and not advice on what YOU should do just my opinion on what I see - yonsfx

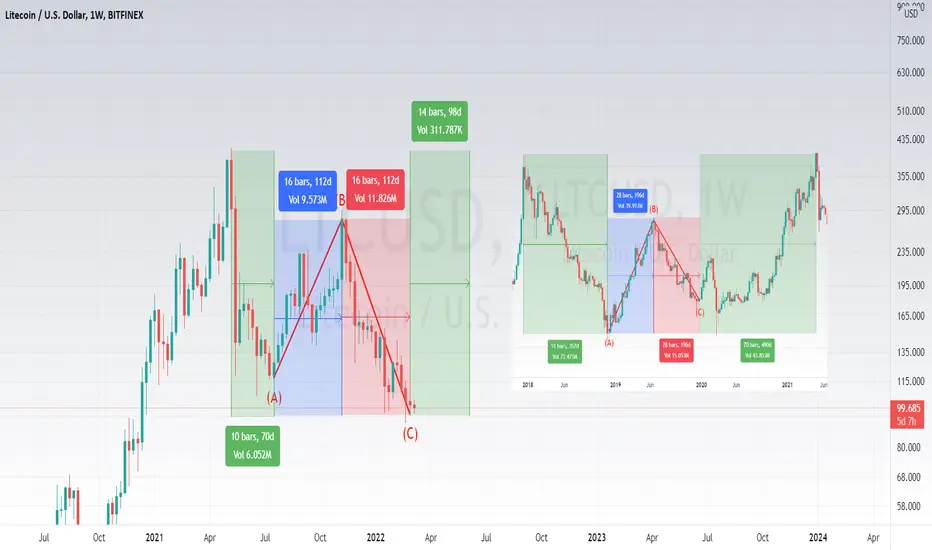
Litecoin will copy 2018-2020's cycleHey guys.
As you can see on the Litecoin charts in the past, a noticeable ABC correction wave is visible. If we take the similarity ratios of 1.375:1 (490D & 357D) and apply it to the current cycle, we can determine the next local top. 70 Days * 1.37 = 96 Days from the C bottom correction wave. These numbers are from the May-July correction, based on the 2018-202 cycle, we can mirror that and possibly find a top. Expect in June for Litecoin to hit around $300-400.
Safe Trading,
-Pulkanator
XRPUSD Daily Breakdown Tues.Mar.8.2022Please like and comment as it pushes me to keep creating content on pairs and my bias on it :) -This is merely MY outlook and not advice on what YOU should do just my opinion on what I see - yonsfx

XRPUSD Daily Breakdown Mon.Mar.7.2022Please like and comment as it pushes me to keep creating content on pairs and my bias on it :) -This is merely MY outlook and not advice on what YOU should do just my opinion on what I see - yonsfx

WEEKLY FOREX OUTLOOK SUN.MAR.6.2022 - FRI.MAR.11.2022Please like and comment as it pushes me to keep creating content on pairs and my bias on it :) -This is merely MY outlook and not advice on what YOU should do just my opinion on what I see - yonsfx

XRPUSD Daily Breakdown Sun.Mar.6.2022Please like and comment as it pushes me to keep creating content on pairs and my bias on it :) -This is merely MY outlook and not advice on what YOU should do just my opinion on what I see - yonsfx

XRPUSD Daily Breakdown Sat.Mar.5.2022Please like and comment as it pushes me to keep creating content on pairs and my bias on it :) -This is merely MY outlook and not advice on what YOU should do just my opinion on what I see - yonsfx

XRPUSD Daily Breakdown Fri.Mar.4.2022Please like and comment as it pushes me to keep creating content on pairs and my bias on it :) -This is merely MY outlook and not advice on what YOU should do just my opinion on what I see - yonsfx
