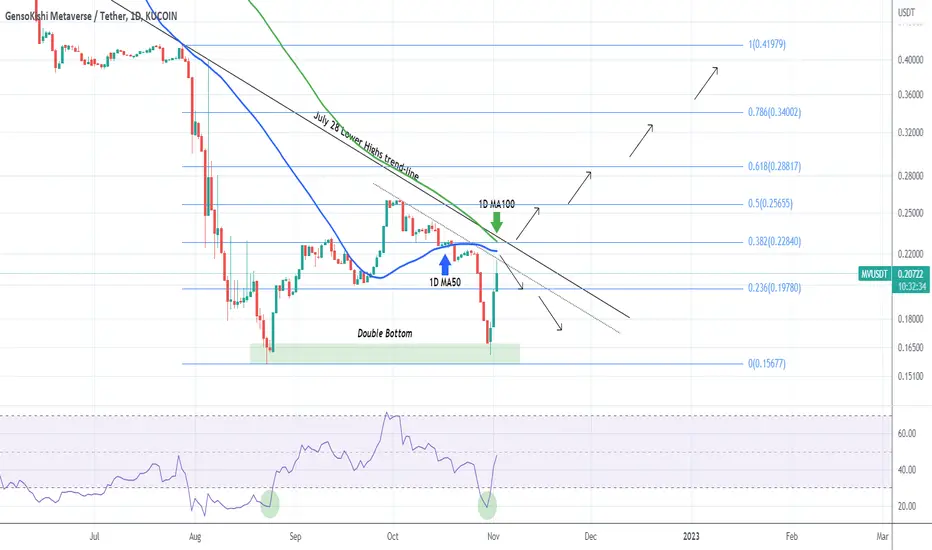
MVUSDT Crucial long-term test! Make or break time.The GensoKishi Metaverse (MVUSDT) is on a very strong three day bullish streak and is about to hit the 1D MA50 (blue trend-line) for the first time since October 19. What is even more important than that is that the 1D MA100 (green trend-line) is right above it, on the Lower Highs trend-line that started on the July 28 High.
The 1D MA100 is the long-term Resistance as it has been unbroken. The 0.382 Fibonacci retracement level is there and a break above it would be a major bullish break-out. We can then target all the upper Fibs. Until then though, the token remains limited under the Lower Highs Zone (dashed line also), eyeing the 0.236 Fib and eventually the Support Zone that formed the Double Bottom (green).
-------------------------------------------------------------------------------
** Please LIKE 👍, SUBSCRIBE ✅, SHARE 🙌 and COMMENT ✍ if you enjoy this idea! Also share your ideas and charts in the comments section below! This is best way to keep it relevant, support me, keep the content here free and allow the idea to reach as many people as possible. **
-------------------------------------------------------------------------------
You may also TELL ME 🙋♀️🙋♂️ in the comments section which symbol you want me to analyze next and on which time-frame. The one with the most posts will be published tomorrow! 👏🎁
-------------------------------------------------------------------------------
👇 👇 👇 👇 👇 👇
💸💸💸💸💸💸
👇 👇 👇 👇 👇 👇
MVUSDT
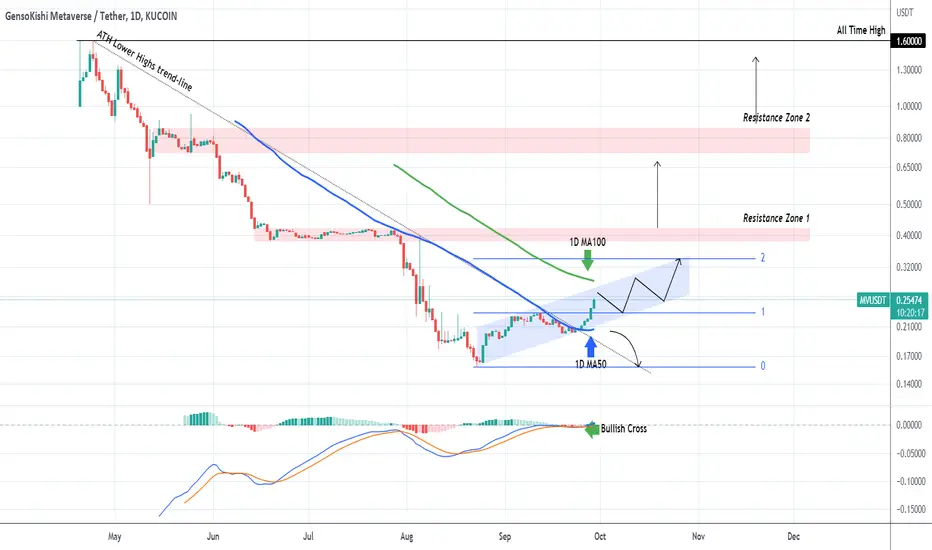
MVUSDT Staging its first bullish pattern ever*** ***
For this particular analysis on GensoKishi Metaverse we are using the MVUSDT symbol on the KuCoin exchange.
*** ***
The idea is on the 1D time-frame where MV has been trading within a Channel Up (log scale) since the August 23 2022 Low. Until then, the sell-off was extremely strong and is evident on the 1D MACD, which despite this 1-month recovery, it just hit the 0.000 neutral level.
The 1D MA50 (blue trend-line) is now the Support and the 1D MA100 (green trend-line) the Resistance. A break below the 1D MA50 could initiate a test of the 0.15800 Low while a break above the 1D MA100 may target the 2.0 Fibonacci extension as a Higher High. Beyond that, we can only consider buys after each Resistance Zone breaks. Ideal signal for a long-term buy would be when the 1D MA50 crosses above the 1D MA100.
-------------------------------------------------------------------------------
** Please LIKE 👍, SUBSCRIBE ✅, SHARE 🙌 and COMMENT ✍ if you enjoy this idea! Also share your ideas and charts in the comments section below! This is best way to keep it relevant, support me, keep the content here free and allow the idea to reach as many people as possible. **
-------------------------------------------------------------------------------
You may also TELL ME 🙋♀️🙋♂️ in the comments section which symbol you want me to analyze next and on which time-frame. The one with the most posts will be published tomorrow! 👏🎁
-------------------------------------------------------------------------------
👇 👇 👇 👇 👇 👇
💸💸💸💸💸💸
👇 👇 👇 👇 👇 👇