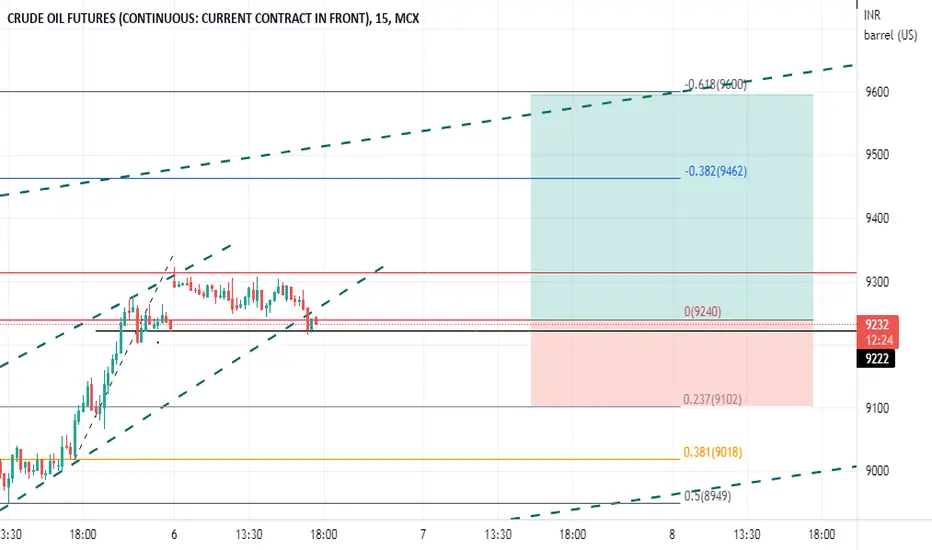
crude oil going to reach 9600 after consolidation .crude oil going to reach 9600 after consolidation .At present stoploss hunting an then its move inside the trend line
MXC
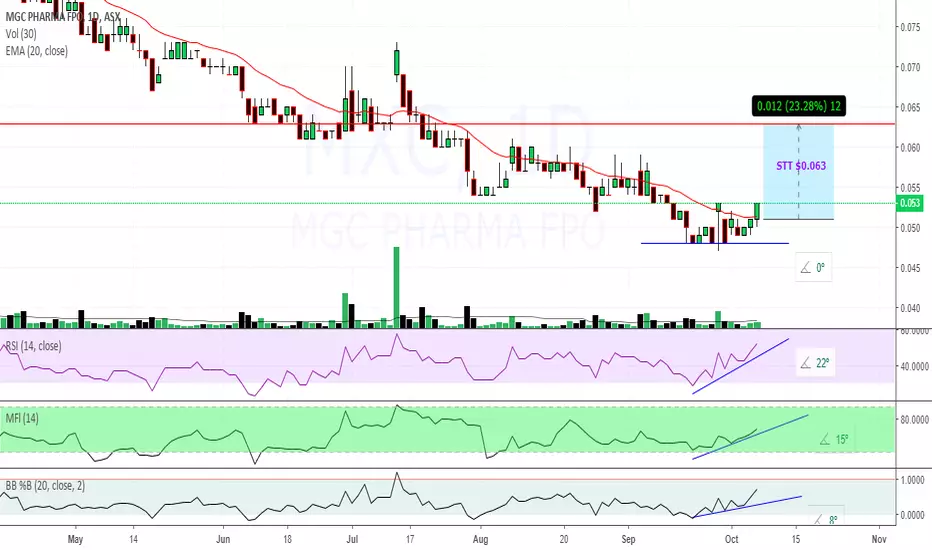
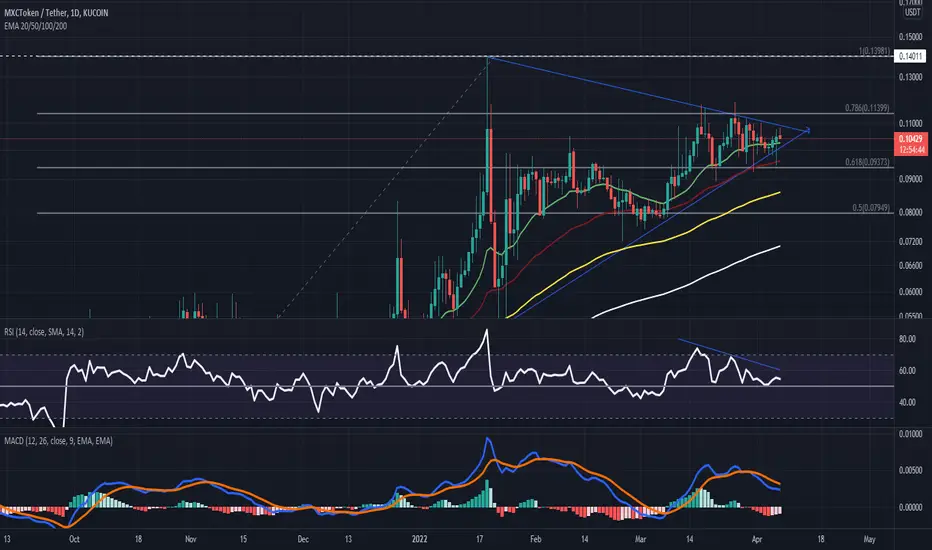
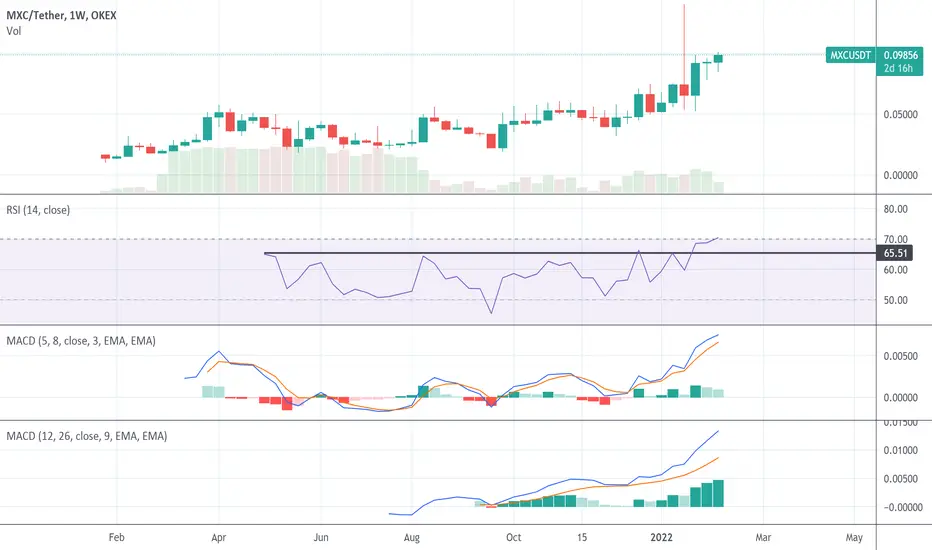
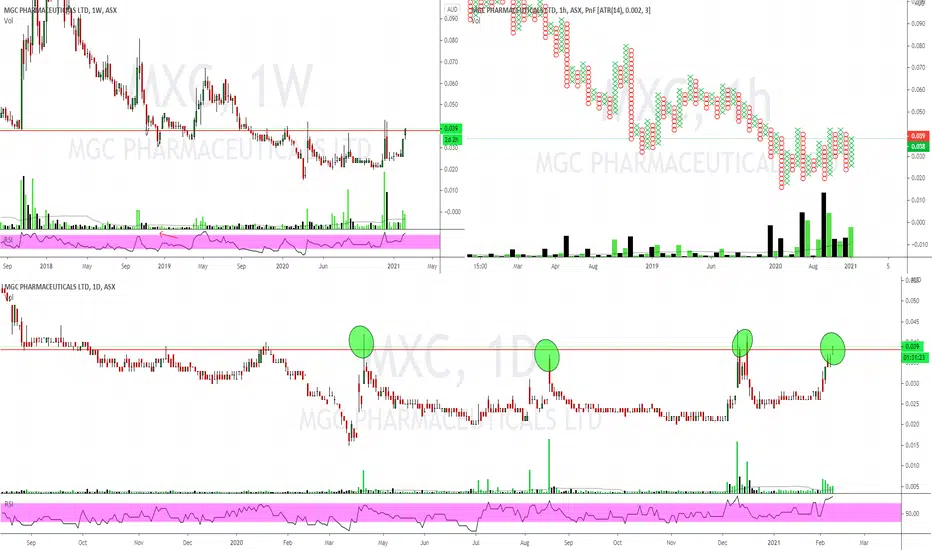
With Buyers Dominated, MXC Price Action Flashes Bullish HalvingThe MXC token has been in an uptrend since September 29, but is consolidating in a symmetrical triangle pattern nowadays.
The MXC token saw its trading volume increase by over 30% during a wide range of accumulations.
For buyers, the 20-day moving average seems to be the short term support zone.
The RSI is forming a low-high after returning from the 75 mark - the start of an overbought zone and below a sloping trend line. The RSI peak is still above the halfway line, which could save MXC holders from a scary downside.
The MACD indicator is slowly sliding lower after a bearish crossover in the positive zone in terms of the daily price chart.
The uptrend trendline (blue) is an important hedge area for MXC holders. In any case if they lose this level they can witness bloodshed. Conversely, they hold the MXC token above the 0.618 Fibonacci retracement level, then they can recover from this symmetrical triangle pattern.
Support level - $0.094 and $0.080
Resistance level - $0.115 and $0.14
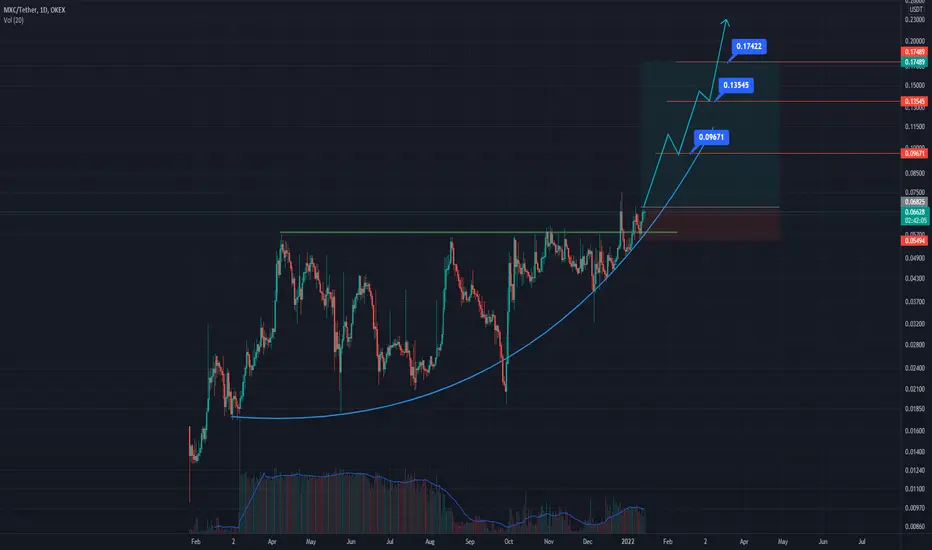
MXC Breaking out.. Get in now or never🚀🔥🔥🔥🔥MXC is breaking out now on the 9 daily and weekly chart for a big momentum to the upside.
This token could do problem 200% or more.
Remember to follow so you can get my exit signals.
MXC/USDTHello friends,
A very strong resistance has been broken and its high price has stabilized,
Enter the deal with a loss limit,
MXC seemed to be an exchange coin that has just been ranked as a good exchange and is ranked 24th in the coinmarketcap table.
There is a lot of room for growth ...
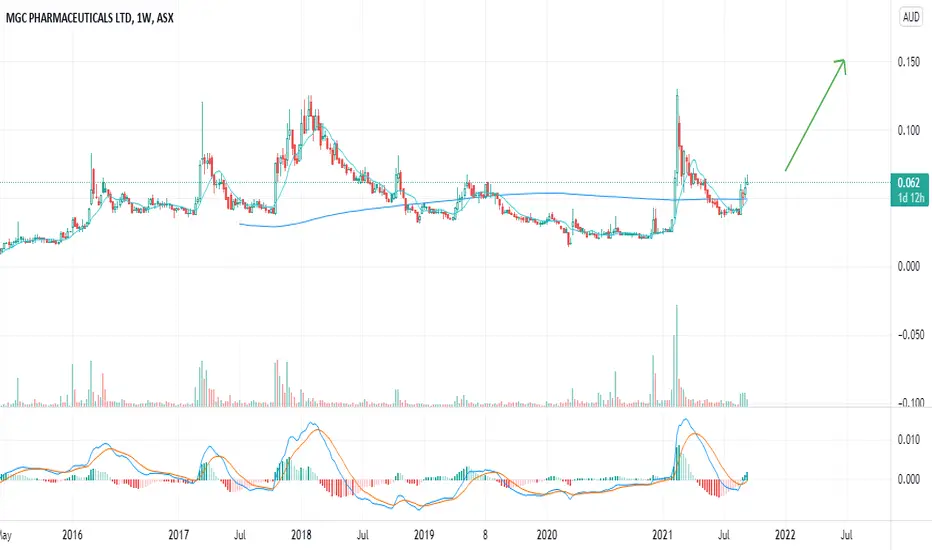
Buy, buy, buy!!!Buy no matter what. I'm in with 40k shares, plan to buy much more for long term ( 5-10 years)
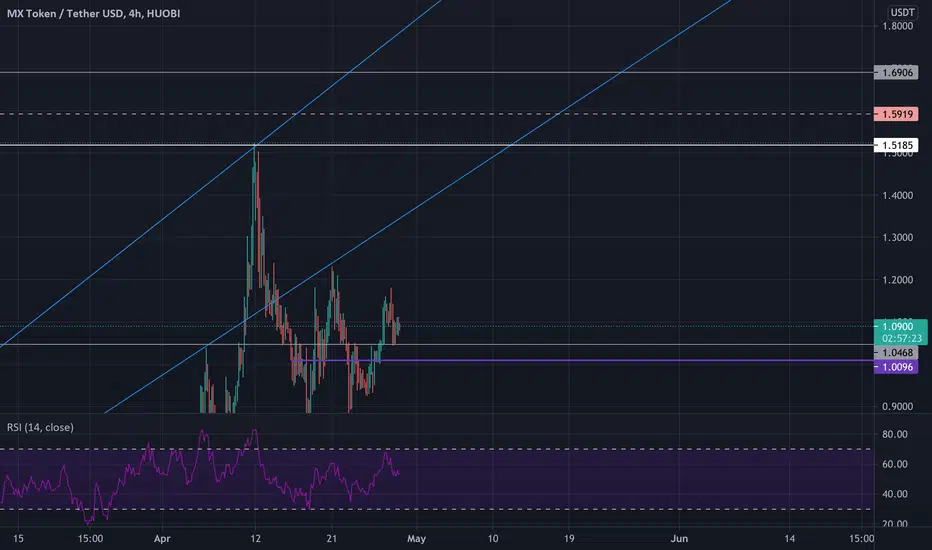
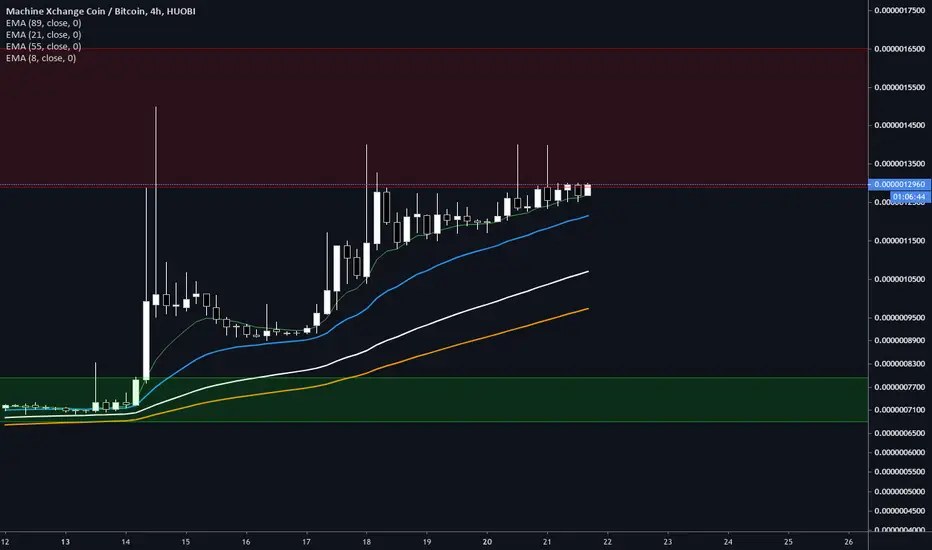
MXC/BTC: Is this the most bullish chart in crypto right now?I've been watching MXC for a long time. Recently played some of this rapid rise but ended up taking profit too early. Well look who has a second chance.
I don't normally use anything lower than a daily chart for coins on Huobi because they can be illiquid and spiky. But zooming in from the daily for some detail I was struck by how much this coin really seems to want to go up. Look how it hugs the 8 EMA, grinding up and knocking again and again on resistance.
And why does it take so much force? Because this is a weekly resistance back from 2018:
This resistance is easily the strongest in its chart, certainly now we've flipped the previous strong resistance zone at 7500.
Above here, we have a couple of resistance zones but not strong ones. And look at the VPVR - all the volume is below. Clear skies above.
In terms of fundamentals, the project announced a partnership with the Sichuan government to help build their IoT infrastructure last week. I don't know how important this really is, but the market reacted pretty hard.
In summary, lots of potential upside left even after the recent huge move.
Trade safe!

$MXC Bullish Momentum From PullbackMexco Energy Corp. operates as an independent oil and gas company, which engages in the acquisition, exploration, development, and production of natural gas properties and crude oil. The firm focuses on the Midland Basin located in Eastern portion of the Permian Basin including Reagan, Upton, Midland, Martin, Howard, and Glasscock Counties; and Delaware Basin located in the Western portion of the Permian Basin including Lea and Eddy Counties, New Mexico, and Loving County. The company was founded in April 1972 and is headquartered in Midland, TX.
SHORT INTEREST
36.73K 09/30/19
P/E Current
-722.83
P/E Ratio (with extraordinary items)
-114.83
Average Recommendation: BUY
Average Target Price: 14.00