SHIBUSDT Is Flashing Major Bearish Warnings – Are You Ready??Yello Paradisers, Have you been keeping an eye on SHIBUSDT? If not, now is the time. The market is showing clear signs of weakness that could lead to a significant bearish move, and many traders may not be prepared for what’s coming.
💎SHIBUSDT is currently looking bearish after forming a clear bearish Change of Character (CHoCH) on the higher timeframe. Adding to this, the price action on the lower timeframe is showing an internal Change of Character (I-CHoCH) originating from a 4-hour bearish Order Block (OB). This setup substantially increases the probability of a continuation to the downside.
💎What we are focusing on now is the potential pullback. If SHIBUSDT pulls back to fill the Fair Value Gap (FVG) or develops a bearish pattern from the Order Block, it would provide a strong short opportunity with an excellent risk-reward profile.
💎However, it is crucial to remain cautious: if the price breaks out and closes a candle above the identified Order Block, it would completely invalidate the bearish idea, and we would need to step aside from any short positions.
Remember, Paradisers, sustainable trading success comes from patience and disciplined execution. There is no need to rush. Waiting for confirmation will always keep you on the winning side. Be smart, wait for the right setup, and always trade like a professional. This is the only way you will make it far in your crypto trading journey.
MyCryptoParadise
iFeel the success🌴
Mycryptoparadise

Is #LTC on the Edge of a Major Breakdown? Watch Key Levels Yello Paradisers! Is #Litecoin about to collapse after completing a suspicious Ending Diagonal pattern? Let’s dive into this critical setup on #LTCUSDT:
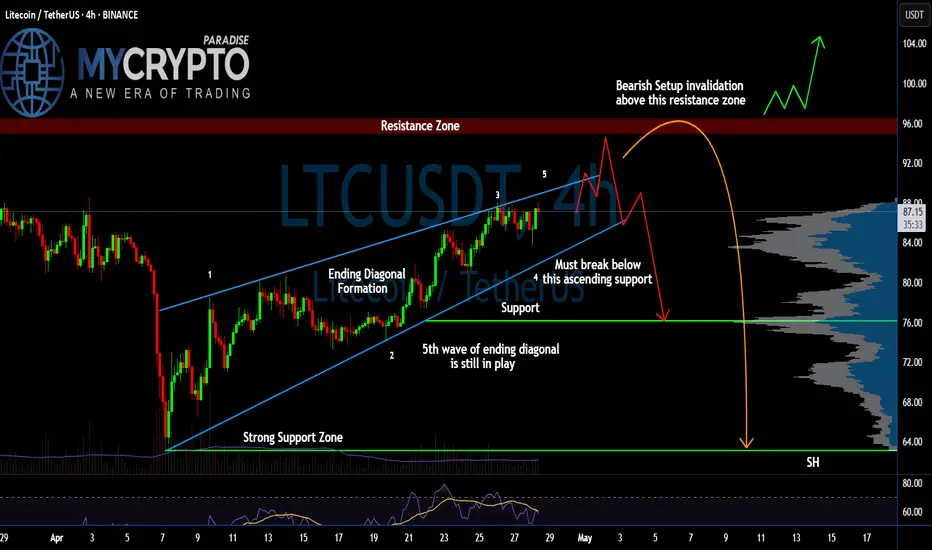
💎#LTC is currently trading around $87, sitting just below a major resistance zone between $92 and $97. Price has been moving inside a textbook Ending Diagonal formation, and based on the current structure, the 5th wave of this diagonal appears to still be unfolding—but the clock is ticking.
💎Volume has been fading even as price attempts to push higher, a classic warning sign deep inside a wedge. At the same time, momentum indicators are showing bearish divergence, hinting that the strength behind this up-move is running out of steam.
💎The red Resistance Zone above is absolutely critical. If #LTCUSD manages to break and hold above $96, the bearish setup would be invalidated, opening the path for a strong impulsive move toward $104 and beyond. However, unless that breakout happens with convincing volume, the odds strongly favor the downside.
💎If price fails to push higher, the first sign of confirmation will be a break below the ascending support trendline near $86–$84. A decisive move below this support would likely trigger a fast drop toward the next major support around $76. If that fails to hold, a full breakdown into the $64 region becomes very likely, as that's where strong historical demand exists according to the Volume Profile.
Play it safe, respect the structure, and let the market come to you!
MyCryptoParadise
iFeel the success🌴
JASMY at a Breaking PointYello, Paradisers! Have you been watching JASMY closely? If not, you might be about to miss one of the most explosive opportunities we've seen in recent days. A major breakout or breakdown is brewing, and the market is preparing for a decisive move!
💎Right now, #JASMYUSDT is sitting above a critical Demand Zone after successfully flipping a strong historical resistance into support. Price action is following an ascending structure, respecting both the Ascending Support and the broader Ascending Channel pattern. As long as the price continues to hold this support region and maintain the bullish market structure, there is a high probability of a breakout towards the Moderate Resistance level around 0.01994. A clean break above this area could fuel a sharp rally straight towards the Major Resistance zone at 0.02337.
💎However, caution is absolutely necessary here. If JASMY fails to hold the current Demand Zone and we see a confirmed close below the support at 0.01540 level, it would invalidate the bullish setup. In that case, a rapid sell-off is likely, with downside targets opening towards the 0.01397 region and possibly even lower levels. This would create a high-risk environment where inexperienced traders could get trapped very quickly.
Stay focused, Paradisers. Be the hunter, not the hunted.
MyCryptoParadise
iFeel the success🌴

Is ONDO About to Crash Before the Next Big Rally? Yello Paradisers, are you ready for the next big #ONDOUSDT move, or will you be caught off guard by the next dump? Let’s break down what’s really happening here before it’s too late.
💎#ONDOUSDT has been following a clear Elliott Wave impulse structure. After completing the 5th wave of the impulse move, we’ve now entered the corrective phase. So far, the A and B waves have already played out, and now the C wave seems to be on its way — likely heading toward a key support area around 0.8112.
💎This support level is not just psychological — it also aligns perfectly with a well-respected ascending trendline, giving the level even more technical confluence. If buyers step in strongly here, this could be the launching point for the next impulsive bullish leg.
💎However, if the 0.8112 zone fails to hold, there’s a high probability we could see a deeper correction — potentially down toward the 0.618 Fibonacci level. This would still be a technically valid correction and might attract even stronger buying interest.
💎On the flip side, confirmation of bullish continuation would come once the pair regains momentum from the support zone and pushes towards the higher resistance levels. Watch closely for reactions in those zones — they will dictate the strength of the next leg up.
💎The invalidation of this bullish structure would be confirmed if we get a candle close below 0.6967. This would mean a break below both the ascending trendline and the 2nd wave of the Elliott impulse — a clear sign to reassess the structure.
Strive for consistency, not quick profits. Treat the market as a businessman, not as a gambler. Stay sharp and follow the structure — it's unfolding right in front of us, Paradisers.
MyCryptoParadise
iFeel the success🌴

ETH Rejection Incoming? Don’t Fall for This Bull TrapYello Paradisers, are you watching how ETH is reacting right now at this key zone? This could either turn into a textbook bearish setup… or catch everyone off guard. Let’s break it down 👇
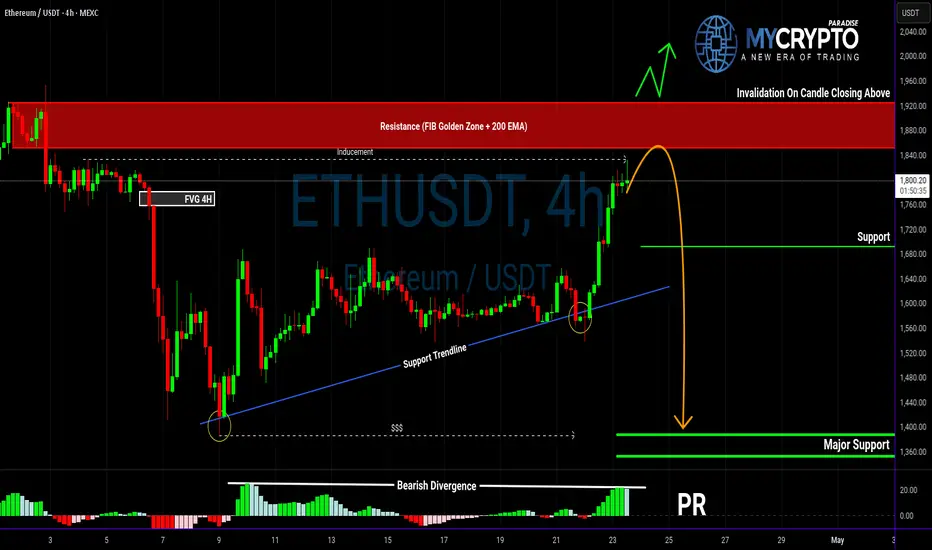
💎ETHUSDT is currently hovering at a critical resistance area, perfectly aligned with both a key Fibonacci retracement zone and the 200 EMA—classic confluence. What makes it even more concerning is the bearish divergence, which is strengthening the probability of a downside rejection from this level.
💎To add fuel to the fire, the price action has just taken liquidity (inducement) above the previous highs, another bearish signal that supports the idea of a potential reversal from here.
💎However, this bearish bias will be fully invalidated if ETH manages to break and close a candle above the resistance zone. That kind of price action would suggest strength from buyers and a likely continuation to the upside.
💎In that case, it’s wiser to stay patient and wait for a cleaner setup at a better price. Rushing into a trade at this stage, especially in a moment of indecision, is not how pros operate.
If you want to be consistently profitable, you need to be extremely patient and always wait only for the best, highest probability trading opportunities.
MyCryptoParadise
iFeel the success🌴
JASMY: Will You Catch the Breakout or Get Caught in the Trap?Yello Paradisers, did you catch the textbook pattern quietly forming on JASMY while most of the market remains distracted? Because what comes next could catch the majority off guard.
💎#JASMYUSDT is currently forming a classic Cup and Handle pattern. After a strong impulsive move, the price retraced in a rounded bottom structure, completing what now looks like the cup. The current consolidation has created the handle a downward-sloping corrective move that’s showing early signs of exhaustion.
💎What adds even more strength to this setup is that the price is now trading above both the 50 EMA and 200 EMA on the 4H timeframe. This signals a solid bullish bias and confirms that the overall momentum remains in favor of the bulls. When the price holds above both moving averages during a consolidation phase, it often indicates that a strong continuation move is brewing.
💎The price is also respecting a well-defined demand zone between 0.01430 and 0.01450. As long as this area holds, the probability of a bullish breakout remains high. A break above the descending handle resistance will be the first true confirmation.
💎If that breakout is supported by volume and sustained price action, we expect a move toward the first resistance at 0.01698. Beyond that, the final target for this pattern lies at the major resistance zone around 0.01785, where significant selling pressure could return. However, discipline is key. If JASMYUSD breaks below 0.01367, the handle structure would be invalidated.
Stay focused, Paradisers. Be the hunter, not the hunted
MyCryptoParadise
iFeel the success🌴

APT Is Squeezing Into a Reversal Pattern at a Key Weekly Level!Yello, Paradisers! Is #APT quietly gearing up for one of the cleanest reversal plays we’ve seen in weeks?
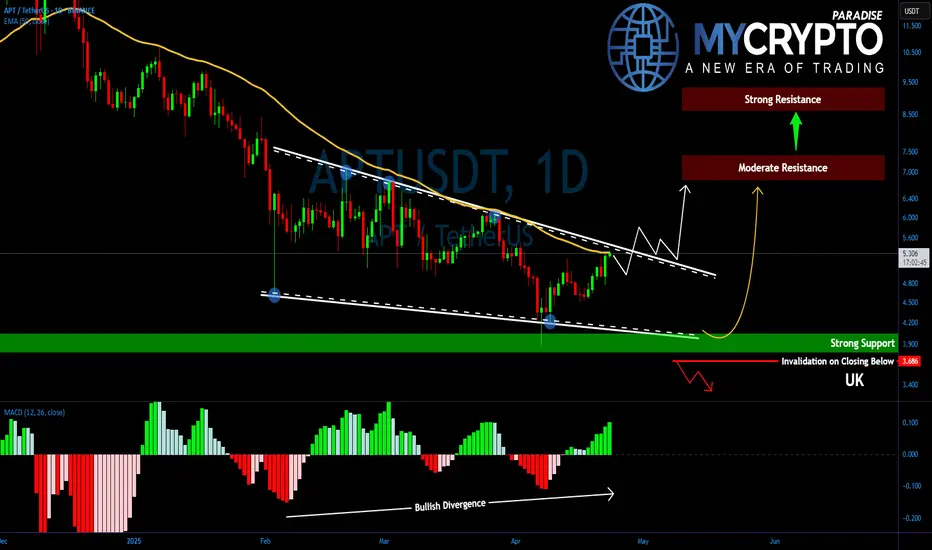
💎After a long, relentless downside trend, APT is now starting to show signs of life. The price action is compressing inside a classic falling wedge pattern, and more importantly, this is happening right at a weekly key level — the kind of setup that usually leads to significant shifts when confirmed.
💎What’s adding more weight here is the emergence of a bullish divergence on the indicators, suggesting that while price has been making new lows, momentum has already begun to turn. That’s often one of the first early signs of a coming reversal and it’s starting to gain strength.
💎#APTUSDT is now pressing against a decisive resistance zone. The price is testing the 12-hour EMA-50, currently sitting around $5.33, and just slightly above that, the wedge breakout trendline stands at approximately $5.45. These two levels are acting as the immediate gatekeepers for a bullish shift.
💎Breaking through both of these zones will be crucial. If the bulls succeed, we can expect a push toward the $7.00 – $7.35 region — a zone where short-term traders may look to take profits. However, if the momentum continues, the bigger step lies ahead.
💎A sustained breakout could carry APT to the pattern target of $8.75 – $9.25 area. This is a strong resistance zone and this is where things get more challenging. The resistance in this range is reinforced by multiple technical confluences, including the 50% Fibonacci retracement, which often acts as a magnet but also a serious barrier during recoveries.
💎On the flip side, support remains solid. Immediate support is at $4.95, while beneath that, APT sits on a major structural base that has historically held firm. Sellers will need serious volume to crack below this foundation and for now, that pressure isn’t there.
Paradisers, strive for consistency, not quick profits. Treat the market as a businessman, not as a gambler.
MyCryptoParadise
iFeel the success🌴
#HBAR Current Setup Showing Warning Signs | What's Next?Yello Paradisers! Is #HBAR teasing one last move up before everything collapses? Let’s break down what this suspicious structure on #Hedera is telling us:
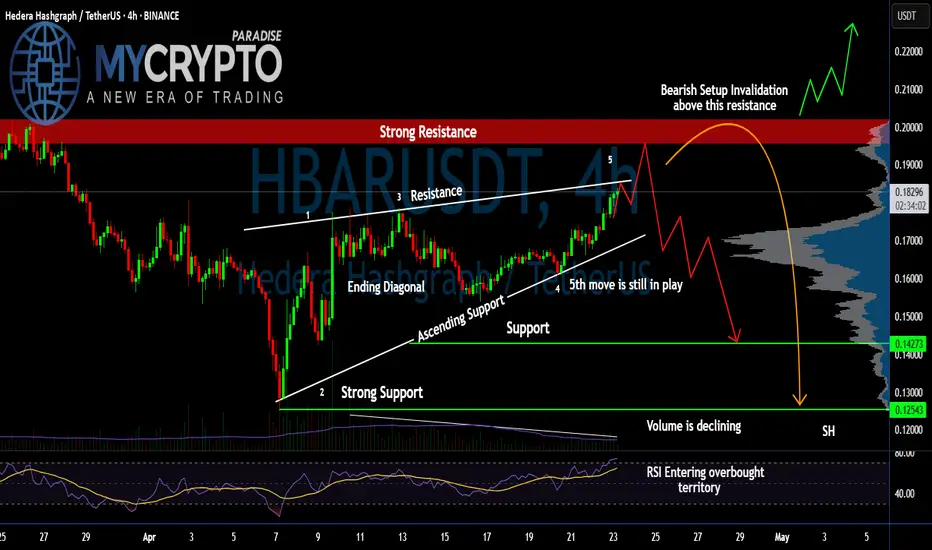
💎#HBAR is currently trading at $0.183, sitting just beneath a heavy resistance zone around $0.190–$0.200. Price has been unfolding inside a clear Ending Diagonal structure—one of the most deceptive patterns in technical analysis. Wave 5 is still technically in play, but momentum indicators and volume behavior are telling a different story.
💎Volume has been steadily declining even as the price has been climbing, which is never a good sign this deep into a wedge pattern. On top of that, the RSI is pushing into overbought territory, showing that buyers are pushing the market higher, but with weakening strength behind them.
💎The resistance zone above current price is absolutely key. If #HBARUSD manages to break above the red zone and sustain momentum above $0.200, this would invalidate the current bearish setup and could open the door for an impulsive extension toward $0.220 and even higher. However, that scenario currently remains the less likely one unless we see a clear and strong breakout above the zone backed by volume.
💎Until then, bears are in control of the probabilities. The market structure favors a reversal from the Ending Diagonal, and if that plays out, the move could unfold quickly. First, we’ll be watching how price reacts at $0.142, which is the first major support and likely target if the wedge breaks down. A confirmed close below that level would likely lead to a continuation of the drop, with the next strong support zone near $0.125. This area has acted as a solid demand level previously and is also the region where the Volume Profile starts to spike again.
Play it safe, respect the structure, and let the market come to you!
MyCryptoParadise
iFeel the success🌴
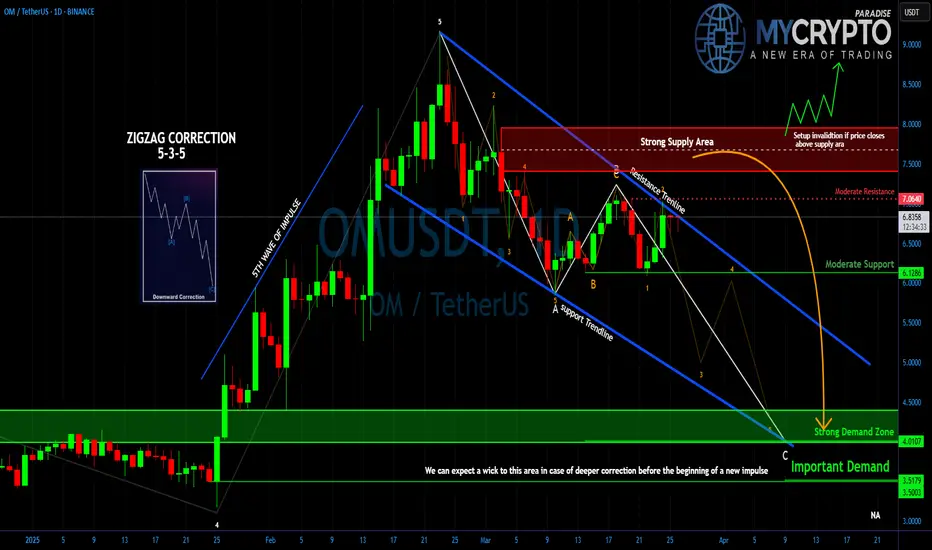
FINAL LEG OF THE ZIGZAG CORRECTION ?Yello, Paradisers! Are we about to see the end of this correction, or is there still one more shakeout coming? Let’s break it down.
💎The market is currently unfolding within a Zigzag Correction (A-B-C) pattern, and we appear to be in Wave C the final leg of this structure. Wave A has already played out with a sharp downward move, followed by Wave B, which acted as a countertrend rally. Now, Wave C is in progress, forming the last phase of this corrective cycle.
💎Since this is a 5-3-5 Zigzag Correction, the third wave of Wave C has already developed, meaning the market is nearing a critical Demand Zone at 4.0283. This level is a strong support zone where a potential reversal could occur. If the price reacts positively from this area, it could mark the end of the correction and signal the beginning of a new bullish phase, starting Wave 1 of the next uptrend.
💎However, if the price remains trapped between the Moderate Support and Moderate Resistance zones, we may see an extended period of sideways consolidation before any decisive move. A key confirmation to watch is the RSI approaching oversold conditions, which would indicate that downward pressure is weakening and the probability of a bullish reversal is increasing.
As always, Paradisers, the key to profiting in this market is waiting for high-probability setups. If this correction is indeed ending, the next move could be explosive. Stay sharp, stay disciplined, and trade smart!
MyCryptoParadise
iFeel the success🌴
Is #XLM Setting Up for a Bull Trap Before a Major Drop?Yello, Paradisers! Is XLMUSD gearing up for a breakout, or is this just a classic liquidity grab before the next major dump? Let’s break it down.
💎Right now, #XLMUSDT is testing a minor resistance at $0.28464, a level where price has repeatedly struggled to push higher. While there is a possibility of a breakout, the presence of strong liquidity around the unmitigated supply zone at $0.31917 suggests that any move higher could be a trap before a significant drop. If price does manage to break above this resistance, traders should be cautious it’s likely just a liquidity grab before a larger move to the downside.
💎Once the price reaches the unmitigated supply zone, a rejection is expected, leading to a downward move toward the key support zone at $0.22699. This level has historically been a strong demand area where buyers could step in, potentially causing a temporary bounce or consolidation before any further downside.
💎As CRYPTOCAP:XLM moves lower, it’s crucial to watch volume activity. If the decline happens with high volume, it will confirm strong selling pressure and increase the likelihood of a deeper drop. However, if the price approaches $0.22699 with low volume, it could indicate a lack of seller conviction, leading to a short-term bounce before resuming the downtrend.
💎The EMA 200 continues to act as dynamic resistance, reinforcing the bearish outlook. As long as price fails to hold above $0.28464 or gets rejected from the supply zone, the bearish setup remains intact. In that case, a move toward $0.22699 and potentially even $0.19151 becomes highly probable. Watching volume reactions at these key levels will be essential to confirm the next move.
💎The only scenario that could invalidate this bearish setup is a strong close above $0.36172 with high volume. That would signal a potential shift in market structure and could indicate renewed bullish momentum.
Paradisers, patience and precision are key in this market. Let the levels guide you, trade strategically, and stay disciplined. Avoid emotional decisions this market punishes the impatient and rewards those who stay focused.
MyCryptoParadise
iFeel the success🌴

SOLUSDT Breakdown WarningYello Paradisers! Have you spotted what’s happening with SOLUSDT right now? A major breakdown just played out, and this could be the beginning of a much deeper bearish move that many are underestimating.
💎SOLUSDT has broken down from a rising wedge pattern—an important bearish structure that often signals upcoming downside pressure. Before the drop, it swept liquidity, a typical smart money move, and has now confirmed a bearish Change of Character (CHoCH). This combination significantly increases the probability of further decline.
💎If we see a pullback into the resistance zone—it could offer a strong short opportunity with good risk-to-reward ratio. That’s where professional traders start looking to position themselves carefully.
💎However, this bearish idea has a clear invalidation point. If price breaks out and closes a candle above that invalidation level, then the bearish outlook becomes void. In such a case, it’s wiser to stay patient and wait for more precise, high-probability setups to develop.
🎖Strive for consistency, not quick profits. Treat the market as a businessman, not as a gambler. Stay disciplined, Paradisers, and wait only for the cleanest, most reliable trading opportunities. That’s how you make it in this game.
MyCryptoParadise
iFeel the success🌴

DOT About to Break Down? Don’t Fall for the TrapYello Paradisers! Could this "bullish" pump on DOTUSDT be leading traders straight into a bear trap?
💎DOTUSDT is currently forming an ascending channel, which is historically a bearish pattern. These setups often lure in breakout traders before reversing sharply, shaking out weak hands and triggering stop-losses.
💎The price is now approaching a critical resistance zone, where the Fibonacci golden pocket overlaps with the 200 EMA — a powerful confluence. If DOTUSDT grabs liquidity above the recent highs, it would significantly increase the probability of a bearish reversal from that region.
💎For safer, more conservative traders, the best strategy here is to wait for confirmation of a bearish pattern within this area. That would offer a stronger risk-to-reward ratio while allowing more control over trade execution. Patience pays, especially when the market tempts you with low-conviction breakouts.
💎However, if price breaks out and closes decisively above the invalidation level, then the entire bearish idea becomes invalid. At that point, it’s essential to step back and reassess the structure rather than forcing a trade.
Discipline is what separates professionals from gamblers. This setup demands patience, a level head, and an understanding of risk management.
MyCryptoParadise
iFeel the success🌴

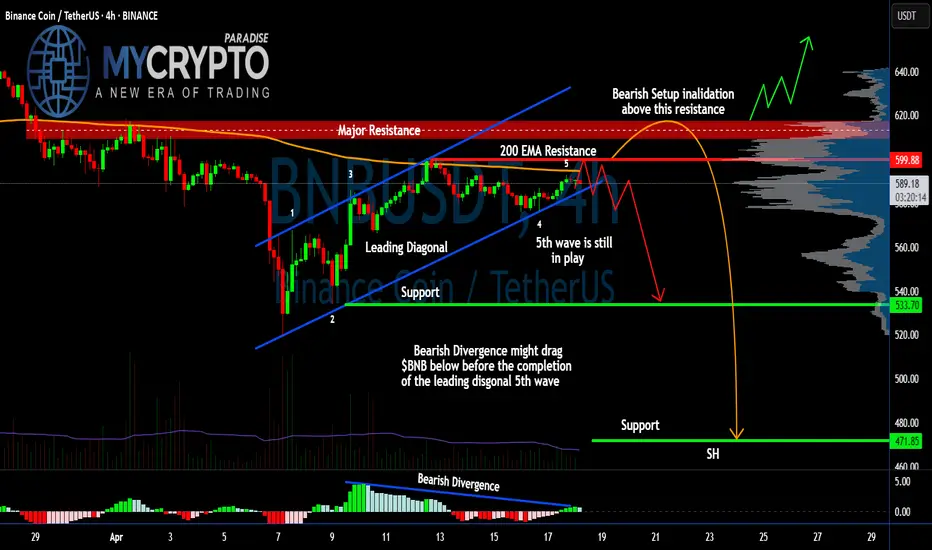
Is #BNB About to Break Down or Not? Don't Get Caught Yello, Paradisers! Is #BNB teasing one last move up before the trapdoor opens? Let’s break down what this suspicious structure of #BinanceCoin is really telling us:
💎#BNBUSDT is currently trading around $589, which is right under 200 EMA resistance. The price has been developing inside a clear Leading Diagonal Formation. Here’s the twist: Wave 5 is still in progress, and there’s growing evidence that the move might fail before it even completes.
💎We’re seeing Bearish Divergence flashing on the MACD histogram, which historically signals fading momentum. This divergence could drag #BNBUSD down before Wave 5 finishes, causing an early breakdown of the entire structure. This would completely shift the market bias in favor of the bears.
💎Key resistance levels are stacked around $599, right under the 200 EMA. A confirmed breakout and hold above this zone would invalidate the bearish setup and open the door for a potential bullish extension above $620, but that scenario remains the less probable one for now.
💎Until then, all eyes are on support zones at $533 and the critical swing low at $471. If price closes below the diagonal’s lower boundary and drops beneath $533, it’s likely to trigger a heavy selloff toward the next major demand level at $471, which could form the next Swing Low.
Play it safe, respect the structure, and let the market come to you!
MyCryptoParadise
iFeel the success🌴
XLM Is About to Trap Thousands of Traders ?Yello Paradisers are you prepared for the next major move on XLM, or are you walking straight into the bull trap? We’re now approaching a critical decision point on XLMUSD that could shake out a lot of traders who are only reacting instead of planning. Here's exactly how we're playing it, step by step.
💎#XLMUSDT is currently trading inside a descending channel. As of now, we see a high-probability scenario where the price gets rejected from the descending resistance, setting up an ideal short opportunity with the current structure still favoring sellers. Should this rejection play out, we expect a breakdown of the moderate support level, with our target set at the $0.1970 zone.
💎Adding more weight to this bearish outlook is the fact that XLM is trading below both the 50 EMA and 200 EMA. This technical alignment confirms broader weakness in the trend and reinforces that any breakout attempts at this stage are likely to be reactive rather than sustainable simply small retracements within a dominant bearish macro setup.
💎However, if price fails to respect the descending resistance and pushes higher, our next major decision area is the supply zone at $0.2537. At that point, as always, we’ll wait with full discipline for confirmation. We’ll be watching closely for clear bearish reversal patterns, such as an Evening Star or a Shooting Star, before taking action. Only a strong and confirmed breakout above the $0.2537 level would invalidate our bearish outlook and shift the market structure into bullish territory.
Stay focused, Paradisers. Be the hunter, not the hunted.
MyCryptoParadise
iFeel the success🌴

ADA Is Setting Up for a Trap? Watch This Level CloselyYello Paradisers– is ADA walking straight into a trap at resistance? The current structure is raising red flags, and traders should stay sharp.
💎ADAUSDT is moving within an ascending channel, which often signals a potential loss of bullish momentum—especially when price approaches a strong resistance area. Right now, it’s nearing a major zone that’s reinforced by the 200 EMA, acting as dynamic resistance. On top of that, a clear bearish divergence is forming, which further increases the likelihood of a downside move.
💎If price sweeps the highs to take liquidity and then prints a bearish reversal pattern from this zone, it could offer a strong short opportunity with an attractive risk-to-reward setup. This is the type of trade setup that disciplined traders focus on.
💎However, if ADA breaks out above the resistance and closes a candle above the invalidation zone, the bearish thesis is off the table. In that case, it’s smarter to stay patient and wait for cleaner price action rather than reacting emotionally.
🎖Strive for consistency, not quick profits. Treat the market as a businessman, not as a gambler.
MyCryptoParadise
iFeel the success🌴

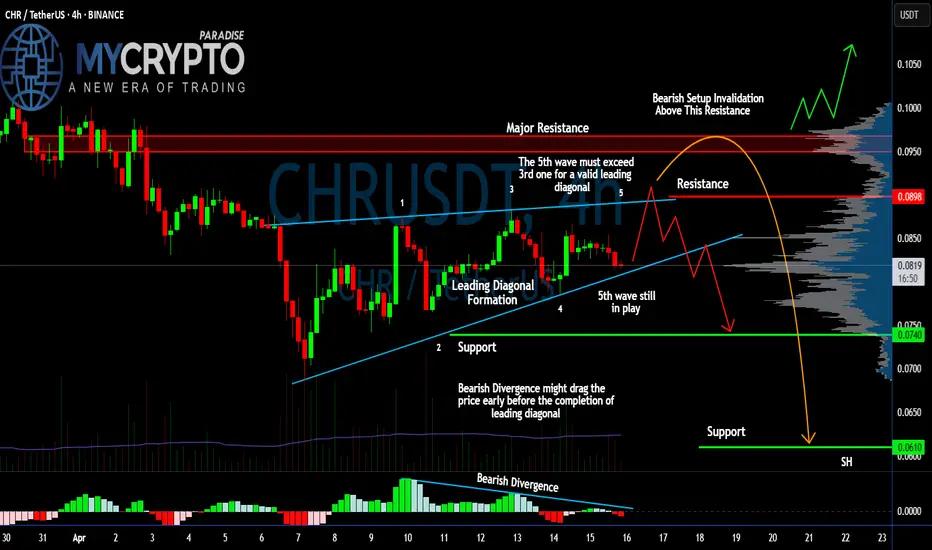
#CHR Ready For Another Leg Down? Key Levels to Watch Yello, Paradisers! #CHR is showing upside probability, but this is just a setup before the next brutal leg down? Here’s why the current move by #Chromia could be the calm before the storm:
💎#CHRUSDT is trading around $0.0819, and on the 4H chart, the price is developing within a potential Leading Diagonal Formation. But here's the catch: for the diagonal to be valid, Wave 5 must exceed Wave 3, which hasn’t happened yet. So, the structure remains incomplete and vulnerable.
💎As of now, the 5th wave is still in play, but momentum is fading fast. A Bearish Divergence on the MACD histogram is flashing early warnings. If it intensifies, it could drag #CHRUSD down before Wave 5 completes, leading to a premature breakdown and invalidation of the pattern.
💎The resistance zone between $0.089-$0.97 remains key. A break and sustained hold above this level would invalidate the bearish scenario, potentially triggering a short squeeze up toward $0.1000+. But unless that happens, bears are still in control of the structure.
💎On the downside, a confirmed breakdown below the $0.0740 support will signal the failure of the diagonal and likely accelerate the drop toward the next major support at $0.0610, where we anticipate the next Swing Low. A valid bearish breakout below needs to be backed by increasing selling pressure and market weakness.
Play it safe, respect the structure, and let the market come to you!
MyCryptoParadise
iFeel the success🌴
Is PEPE About to Crash from Here? Key Bearish SignalsYello, Paradisers — have you been watching PEPE closely? Because if not, you might be walking right into a trap. We warned about this bearish setup in advance, and right now, PEPEUSDT is flashing multiple red flags that every serious trader needs to be aware of.
💎PEPE is currently sitting under heavy pressure at a confluence of resistance — the 200 EMA, the Fibonacci golden pocket, and a major supply zone. And here’s the critical part: it has just printed a bearish CHoCH (Change of Character), significantly increasing the probability of a deeper move down.
💎On top of that, the daily timeframe is showing bearish divergence, a classic warning sign that momentum is fading, while price tries to push higher. These conditions are aligning to suggest that the bulls may be running out of fuel.
💎If we do get a pullback, there’s potential for a high-probability short entry around the breaker block and the Fair Value Gap (FVG) zones — so keep a close eye there.
💎But be careful — this setup isn’t bulletproof.
💎If PEPE breaks out and closes a candle above our invalidation level, the entire bearish bias gets invalidated. In that case, the best move will be to stay on the sidelines and wait for stronger confirmation. Never force trades — especially in this kind of volatile setup.
🎖Strive for consistency, not quick profits. Treat the market as a businessman, not as a gambler. Our focus remains on executing only the highest-probability setups with proper risk management.
MyCryptoParadise
iFeel the success🌴

Can #AAVE Bulls Sustain the Current Momentum? Key Levels Yello, Paradisers! #AAVE looks bullish on the surface—but is this setup quietly setting up for a brutal dump? Here's the key level that will trigger the next big move:
💎#AAVEUSD is currently trading around $143.66, holding inside a clear ascending channel on the 4H timeframe. The price action of #AAVE has been respecting both the ascending support and resistance trendlines, forming higher lows and higher highs—but momentum is fading.
💎A bearish divergence on the momentum oscillator is signaling early weakness despite the price climbing higher. This divergence usually marks the beginning of a bull trap, where the price appears strong just before a sharp reversal.
💎The immediate resistance to watch is in the $156. This is where price was recently rejected, near the upper channel trendline. Above that, $156 remains the key Bearish Setup Invalidation level. A breakout and hold above this would invalidate any bearish structure and could lead to a push toward $170+.
💎However, if AAVE breaks below the ascending support, currently near $140, it opens the door for a sharp drop. The first target is the $126.10 support zone, followed by the $114.35 level, which aligns with a strong historical demand area.
Play it safe, respect the structure, and let the market come to you. Discipline, patience, and strategy are what separate long-term winners from short-term gamblers
MyCryptoParadise
iFeel the success🌴

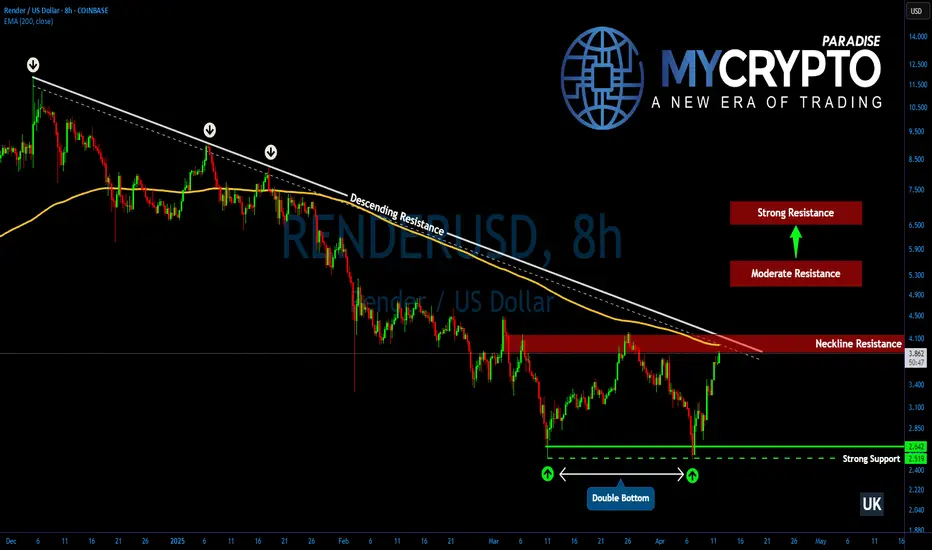
Is RENDER About to Explode? Here is What You Need to Know!Yello, Paradisers! Could this be the final shakeout before #RENDER kicks off a fresh rally? After weeks of heavy bleeding, we're now spotting a textbook bottoming structure — and if you're not paying attention, you might miss one of the cleanest setups we've seen in a while. Let’s break it down.
💎#RENDERUSDT is attempting to solidify a double bottom formation right at a strong historical support zone between $2.50–$2.65. This area has already shown its strength in the past, and now the bulls are trying to use it as a launchpad again.
💎But the real battle zone is at the $4.00 to $4.20 range. This isn't just another resistance. It's a pivotal multi-resistance zone acting as the neckline of the double bottom and is stacked with congestion from previous price rejections. For bulls to reclaim control, we need to see a strong breakout above $4.20 — ideally supported by increasing volume.
💎If that breakout plays out, the next target comes in at $5.10 to $5.40, where partial profit-taking is expected. However, if bulls remain in charge and manage to suppress any selling pressure, we could be looking at a push toward the $6.70 to $7.00 resistance — a level with significant historical relevance.
💎On the flip side, if the breakout fails and we revisit lower levels, RENDER still has a solid basing support between $2.50–$2.65, keeping the bullish structure intact unless we lose this zone.
💎Additionally, the chart is showing signs of a potential golden cross formation forming soon, which would further reinforce the bullish momentum and confirm strength ahead.
Paradisers, strive for consistency, not quick profits. Treat the market as a businessman, not as a gambler.
MyCryptoParadise
iFeel the success🌴
FLUX About to Explode or Break Your Portfolio? Yello Paradisers — are you ready for the next breakout play, or are you blindly walking into a trap? FLUXUSDT is showing signs of a major decision point, and it could catch most traders off guard if they're not prepared. Here's exactly how we're planning it.
💎#FLUXUSD is currently trading within a wedge formation, and we're seeing a high probability of an upside breakout, especially if price is able to surpass the key resistance at $0.2291. In such a case, the next magnet is the internal supply zone at $0.2650 this is where we’ll start monitoring for potential trade setups.
💎This internal supply is a critical reaction zone. If price respects it and starts pulling back, we expect a retracement toward the support level at $0.1646. The high time frame structure remains bearish, which adds more weight to this retracement scenario being likely after tagging the internal supply.
💎Also, Flux is trading below both the 50 EMA and 200 EMA, confirming broader weakness in trend structure and making any short-term breakout more of a reactive move inside the macro bearish bias.If price doesn’t reject at the internal supply zone and breaks through it cleanly, we’ll be looking for a strong reversal from the Ultra TF supply zone at $0.3115. That’s the higher level of confluence we trust more in the bigger picture.
💎At this level, we’ll wait patiently as always and look for clear bearish reversal patterns like an Evening Star or a Shooting Star. Only a confirmed breakout above $0.3115 would change the game entirely by shifting the overall market structure and invalidating this current bearish setup.
Stay focused, Paradisers. Be the hunter, not the hunted.
MyCryptoParadise
iFeel the success🌴

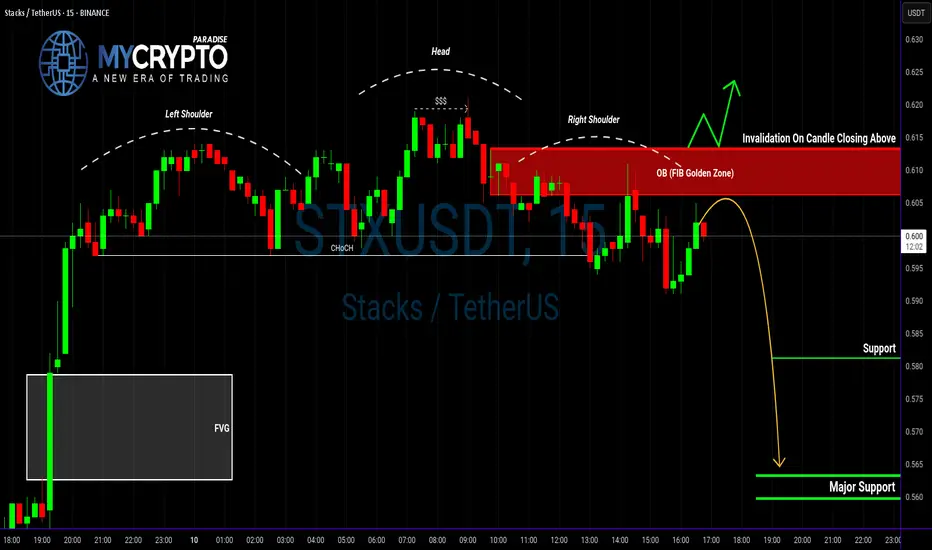
STX Bulls Beware: Is This the Calm Before a Massive Drop?Yello, Paradisers! Are you seeing what we’re seeing on STXUSDT? If not, now’s the time to pay attention—our recent predictions on bearish setups are starting to unfold again, and this one might catch many off guard. Let’s break it down.
💎Currently, STXUSDT is flashing some serious warning signs. We’re spotting a clear bearish Change of Character (CHoCH) in play, which is being reinforced by a Head and Shoulders pattern—a combination that significantly increases the probability of a downside move.
💎To make things worse for the bulls, there’s an unfilled Fair Value Gap (FVG) sitting just below the current price. This acts like a magnet and could drag the price downward as liquidity gets targeted.
💎However, if STXUSDT manages to bounce from current levels, we’ll be closely watching the Order Block (OB) and Fibonacci Golden Zone as potential entry points. These could offer an excellent risk-to-reward (RR) setup if the bearish scenario gets temporarily rejected.
💎But here’s the key invalidation point: if price breaks and closes above the OB zone, the entire bearish thesis falls apart. In that case, we’ll step aside and wait for stronger confirmation before jumping back in. No need to rush—better opportunities always come with clear setups.
🎖Trade smart, Paradisers. The market doesn't care about your bias—it rewards only patience, precision, and discipline. Stick to your trading plan, and don’t let FOMO or fear drive your decisions.
MyCryptoParadise
iFeel the success🌴
FARTCOIN Is About to Make or Break—Massive Correction Incoming ?Yello Paradisers — have you seen what’s brewing on #FARTCOINUSDT? After our spot-on predictions in previous waves, this might be the final shakeout before the real show begins. But one wrong move here… and it all falls apart.
💎#FARTCOIN has recently shown aggressive movement, completing the third wave of a classic Elliott Wave impulse. Waves 1 and 2 are in place, and with the third now printed, there's a strong probability of entering an ABC corrective phase — forming the 4th wave — which could retest areas near the previous resistance-turned-support.
💎Zooming out, the asset has been shaping a long-term Cup and Handle formation, and while we’ve seen a breakout above the neckline, a retest is highly likely before any continuation. This aligns with a potential ABC structure, adding confluence to a possible pullback scenario.
💎On top of that, FARTCOIN is flashing signs of strength within a bullish inverted Head and Shoulders pattern, with a neckline around 0.6273. A retest of this key level is probable and would further validate buyer interest in this zone.
💎Additional confluence comes from Holding the multi-timeframe EMA 20 as dynamic support. A visible order block at the 0.618 Fibonacci golden pocket (0.5217), which could act as a magnet for price during the correction.
💎If this area holds, the bullish case remains intact, with probable targets at 0.8913, and an extended move into the 1.0542–1.1361 zone. However, this structure would be invalidated on a candle close below the right shoulder, or a breakdown below the 2nd Elliott Wave low.
This is the point where the weak hands get shaken out and smart money reloads. If you're aiming for long-term success, wait for high-probability setups and protect your capital. Strive for consistency, not quick profits. Treat the market as a businessman, not as a gambler, Paradisers.
MyCryptoParadise
iFeel the success🌴

Is #POWR Bouncing Before the Breakdown? Don’t Get Caught Yello, Paradisers. Have you spotted how quietly #POWR is building up a sneaky trap? This move by #PowerLedger could wipe out impatient bulls and overly confident bears in one go:
💎#POWRUSDT is currently trading inside a clean descending channel structure, where both resistance and support levels have been perfectly respected over the past few weeks. The most recent bounce from the lower boundary (around 0.1169) was anticipated, but let’s be clear — this move is still within a bearish market structure.
💎The price is approaching a key resistance level near 0.155–0.160, which also aligns with the descending trendline. A temporary spike higher to test this area — even up to 0.179 — is likely, but don’t get fooled. These types of moves are often engineered to liquidate early short positions before the true direction resumes. Classic bull trap behavior.
💎As long as #POWR remains below the critical resistance zone at 0.180, there is no bullish market shift. This is the invalidation point for any bearish setup — and the price must close and hold above this level to suggest a sustained trend reversal. Until then, this is just another lower high in a broader downtrend.
💎On the downside, the key support levels to monitor are 0.1169, and then 0.0901 — where the strong historical support lies. If the price fails to hold 0.1169, a sharper markdown move into the 0.09 zone becomes increasingly likely. Volume remains muted and momentum indicators are not showing any strong reversal signals yet. Until we see a breakout and confirmation, every bounce is just an opportunity for the market to trap late longs.
Patience and precision are key in these conditions wait for strong confirmation before making your moves.
MyCryptoParadise
iFeel the success🌴
